International Journal of Sports and Exercise Medicine
Physiologic Changes and Nutrient Intake in Female Participants during a Simulated 80.5 Kilometer Ultramarathon Run: A Pilot Study
R Scott Van Zant1*, Justin Grogg2, Jennifer Schoon1, Jason Exposito3 and Meghan Carroll1
1The University of Findlay, USA
2Parkview Orthopedic Hospital, USA
3Aultman Hospital, USA
*Corresponding author: R Scott Van Zant, PT, PhD, Physical Therapy Program, The University of Findlay, 1000 N Main Street, Findlay, OH 45840, USA, E-mail: vanzant@findlay.edu
Int J Sports Exerc Med, IJSEM-1-022, (Volume 1, Issue 4), Original Research; ISSN: 2469-5718
Received: July 28, 2015 | Accepted: October 05, 2015 | Published: October 08, 2015
Citation: Van Zant RS, Grogg J, Schoon J, Exposito J, Carroll M (2015) Physiologic Changes and Nutrient Intake in Female Participants during a Simulated 80.5 Kilometer Ultramarathon Run: A Pilot Study. Int J Sports Exerc Med 1:022. 10.23937/2469-5718/1510022
Copyright: © 2015 Van Zant RS, et al. This is an open-access article distributed under the terms of the Creative Commons Attribution License, which permits unrestricted use, distribution, and reproduction in any medium, provided the original author and source are credited.
Abstract
Purpose: To frequently examine body weight (BW), blood parameters, nutrient/fluid (N/F) intake, urine output and vital signs of recreational female runners completing a simulated ultramarathon.
Methods: Three participants completed an 80.5 km run on a closed 8.1 km course. BW, blood glucose (BG), N/F intake and urine output were measured 24 hr pre- and post event. Complete blood count was measured 1 hr pre-and post event. BW, HR, SBP, DBP, BG, blood lactate (BL), RPE, lower extremity (LE) VAS pain rating, N/F intake and urine output were measured every 8.1 km.
Results: No differences were noted between pre- and post event BW, N/F intake, BG, and urine output. Blood lymphocyte levels were significantly (p < 0.05) decreased and monocyte levels were elevated (p < 0.05) 1 hr post event. LE VAS was 3.66/10 (L) and 4.3/10 (R) 1 hr post event, and 1.3/10 (L&R) 72 hr post. Event results (8.1-80.5 km) showed no differences for BW (0.94 kg loss) and stable ranges for BG (1.1 mmol), BL (1.8 mmol), HR (11 bpm), SBP (20 mmHg) and DBP (11 mmHg).
Conclusions: Experienced female recreational runners maintained stable physiologic parameters with their preferred N/F intake protocols, exhibiting elevated selected WBC and LE VAS pain ratings post event.
Keywords
Ultramarathon, Endurance running, Nutrient intake, Blood glucose, Hemodynamics
Introduction
Participation in ultramarathons (running events of > 42.2 km) is on the rise. In the most recent competition calendar year (2014-15), over 800 ultramarathon races worldwide are scheduled, with over 340 in both Europe and in North America [1]. Described as "one of the most physically demanding competitive sporting events in the world," [2] (p389) ultramarathon race distances typically range between 80.5 and 161 km (50 and 100 miles). Competing in these events brings unique physiologic challenges to the participants that may not only impact performance, but also may negatively impact the participant's health [3-8]. Additionally, appropriate nutrition and fluid intake protocols are essential to provide adequate exercise energy, maintain blood glucose homeostatsis, and maintain appropriate body hydration, thus avoiding such adverse effects as dehydration, compromised plasma volume, altered body electrolyte levels, and increased body temperatures [9-14]. This risk may especially be true for novice runners to these events. As the number of events and competitors rise, the need to study and understand these physical challenges in a practical manner becomes increasingly important.
While researchers have investigated, usually in isolation, such factors as hemodynamic vital signs [4,15,16], blood parameters [7,8,17], fluid/nutrient intake and weight [2,6,9,10,12-14,18], and tissue injury and pain perception [5,19-21], no studies have described the effects of ultramarathon running on all these parameters in the same investigation. This is largely due to the intense challenges (both physiologic and logistic) offered by ultramarathon running, as it is extremely difficult to conduct research measuring multiple physiologic and nutritional variables at frequent and consistent points during the time course of ultramarathon competitions. Therefore, the purpose of this descriptive pilot study was to assess, at frequent and regular intervals, changes of physiologic properties and nutritional practices of participants completing a simulated ultramarathon run of 80.5 km. With the increase in ultramarathon running, especially among novice competitors, the need to study the physiologic changes of the human body during such a unique and demanding event is becoming evermore important.
Methods
Participants
The participants in this study were three recreational female endurance runners who were recruited as a sample of convenience. All participants had previous ultramarathon (at least > 42 km) experience. Their level of typical run training was 64-87 km per week. Prior to participation, all participants completed a comprehensive health history verifying no recent injury or adverse health history, and provided their informed consent for participation in the study protocol, which had been approved by the University of Findlay Institutional Research Review Board. Table 1 summarizes participant demographic information.
![]()
Table 1: Summary of Participant Demographic Information.
View Table 1
Laboratory measures
Approximately one month prior to the event, all the participants were measured for body mass index (BMI), percent body fat, blood glucose and lactate, and peak oxygen uptake (VO2 peak). Participants were initially measured for height and weight on a standard medical beam scale, and then assessed for percent body fat via seven-site skinfold assessment [22]. Following body composition assessment, resting blood glucose was determined using a One Touch Ultra© glucose meter (LifeScan, Milpitas, CA), and resting blood lactate was assessed using a Lactate Pro© lactate meter (Arkray Inc, Shiga, Japan). Both are single drop sample analyzers that were calibrated per manufacture recommendations prior to each testing session. Resting blood pressure was assessed via auscultation, and heart rate was determined via palpation of the radial pulse.
The VO2 peak was determined via open circuit indirect calorimetry using a Trumax© gas analysis system (ParvoMedics, Sandy, UT) while participants completed an individualized progressive continuous treadmill exercise protocol. Participants ran at a self-chosen pace, with the treadmill elevation increasing at least 2% every two minutes until subjective fatigue was achieved. Every two minutes the runner's blood pressure, heart rate, and rating of perceived exertion (RPE; Borg ratio scale) was measured. Blood lactate was measured at subjective fatigue.
Field measures
The simulated ultramarathon event was performed on a controlled suburban/park 8.1 km (5 mile) loop asphalt course with minimal elevation changes. The 80.5 km run was completed in June 2012, with the ambient temperature ranged from 18-33.3°C. Body mass, measured by a scale provided by each participant, was assessed 72, 48, 24, 12, 4, and 1 hour(s) prior to and following the ultramarathon run. Blood glucose was measured 24,12,4, and 1 hour(s) prior to and after the event. The participants measured urine output, fluid and food intake 24 hours prior to and following the event.
Complete blood count (CBC) was measured with a Sysmex XE-Series Analyzer (Sysmex Corporation, Kobe, Japan) in a laboratory at a local hospital. Blood was drawn from the participants by a phlebotomist at the hospital laboratory and then analyzed in triplicate by the analyzer in the open mode. Samples for CBC measurement were taken 1 hour pre-event and post-event in all participants, and analysis included: white blood cells (WBC), neutrophils (NEU), lymphocytes (LYM), monocytes (MON), basophils (BAS), eosinophils (EOS), red blood cells (RBC), hemoglobin (HGB) and hematocrit (HCT). Changes in plasma volume (PV) levels were then calculated from the HGB and HCT readings based on the work of Dill and Costill [23].
After each 8.1 km lap, the blood pressure was measured via auscultation in the right arm by one researcher while heart rate was simultaneously determined via radial pulse palpation in the left arm by a different researcher. Blood glucose was then measured in the right hand and blood lactate assessed in the left hand. RPE and visual analog scale (VAS) pain rating was assessed. All fluid consumption was measured with graduated cylinders, and marked fluid bottles were refilled. Food was measured with a Taylor Digital Kitchen Scale Model #3800N (Taylor Corporate Headquarters, Oak Brook, IL) for exact serving portions prior to consumption and recorded. Fluid output was measured with a urinal. All measurements were made by the same personnel during the events to maximize intra-rater reliability.
The participants were encouraged to consume fluids and foods as they would normally during an ultramarathon event. Body mass was taken with running attire and shoes using a scale provided by the participant prior to starting the next lap; the running attire and shoes were then later subtracted to give an accurate body weight. The time to complete all measures was approximately three minutes but the runners were at the station longer depending on their need to eat, rest, change apparel, or use the restroom. Nutritional consumption related to caloric, carbohydrate, fat, protein, sodium, potassium, and magnesium intake were calculated from an online source [24].
All data was treated to descriptive statistical analysis using the SPSS statistical program Version 22 (IBM SPSS, Inc. Chicago, IL). Inferential statistical analysis via matched group t-tests was performed on mean data for pre-event and post event parameters, and data obtained from the first 80.5 km during the event was compared to data obtained at the 8.1 km mark which served as an "active baseline."
Results
Changes pre-event to post event
Table 2 summarizes the changes in CBC blood parameters obtained one hour prior to and following the ultramarathon run. Modest (non-significant) increases were noted in RBC, HGB, HCT after the event, and a non-significant decrease of 6% was noted in PV. Blood levels of LYM were significantly (p = 0.004) decreased, while MON were significantly (p = 0.022) elevated one hour post event. While failing to reach significance, there were statistical trends for increases in WBC (p = 0.071), NEU (p = 0.066), and EOS (p = 0.074).
![]()
Table 2: Changes from Pre-Event to Post-Event: Complete Blood Count.
View Table 2
No significant differences were noted in either body weight or blood glucose in the 24 hour period preceding and following the ultramarathon run. The immediate (one hour) variation in body weight was a 1.2 kg (1.7%) loss following the event, and a 0.6 mmol/L (9.5%) reduction in blood glucose post event. Similarly, nutrient / fluid intake and urine output for the 24 hour period prior to and following the event demonstrated no significant differences. Total energy, carbohydrate, and fat intake and were all non-significantly increased (total energy 23.3%, carbohydrate 20.3%, fat 41.1%) following the event, while non-significant decreases were seen in protein and fluid intake (protein 22.1%, fluid 20.6%) and urine output (10.4%) after the event.
Changes during the event
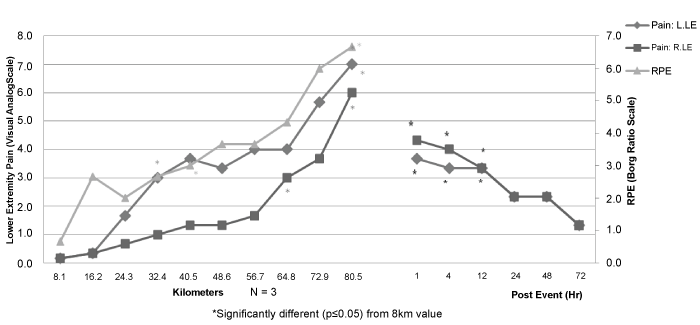
Lower extremity pain as determined by VAS increased progressively during the event (Figure 1). Compared to the VAS at 8.1 km, VAS of the left leg was significantly (p < 0.05) greater from kilometers 32.4 through 80.5, and up to 12 hours post event, while VAS of the right leg was significantly greater at kilometers 64.8 through 80.5, and up to 12 hours post event. Compared to the RPE at 8.1 km, RPE was significantly elevated from kilometers 40.5 through 80.5.
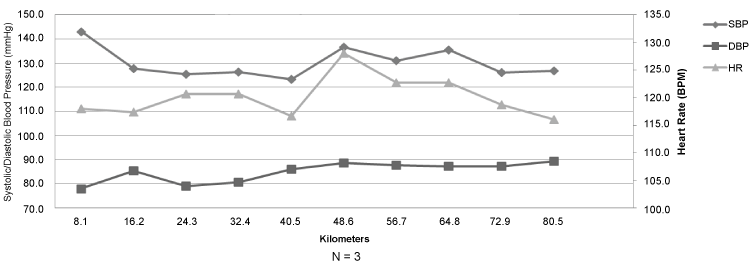
Figure 2 summarizes the changes in systolic and diastolic blood pressure, and heart rate during the event. In general, blood pressure remained stable during the 80.5 km, with systolic blood pressure showing an in-event range of 20 mm Hg and a diastolic blood pressure range of 11 mm Hg. Heart rate was also stable during the 80.5 km, demonstrating a range of 11 bpm.
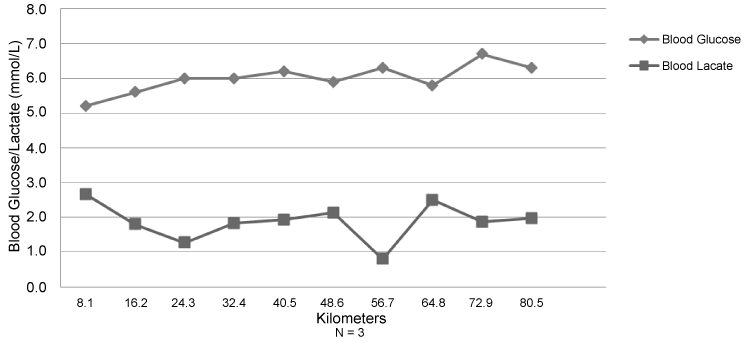
Blood glucose and lactate remained stable during the 80.5 kilometers (Figure 3). Over that run distance, blood glucose demonstrated a range of 1.1 mmol/L, while blood lactate had a range of 1.8 mmol/L.
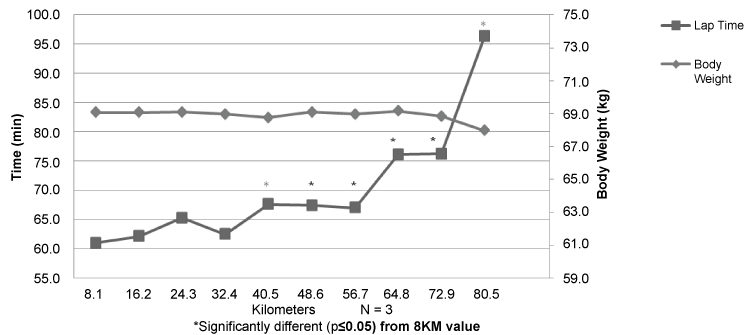
Body weight remained quite stable during the 80.5 km, with a mean change from the beginning of the event to kilometer 80.5 of 0.94 kg (Figure 4). The first 8.1 km lap time was the fastest (mean time 60.9 min), with lap times increasing modestly or stabilizing through 56.7 km. Lap time at 64.8 kilometers increased by 9.2 min, and dramatically increased (20.1 min) at 80.5 km. Lap times from kilometers 40.5 through 80.5 were significantly (p < 0.05) slower than the 8.1 km lap time. Mean event time for 80.5 km was 11.68 hours.
Figure 5 summarizes Caloric and fluid intake, and urine output during the event. Kilometer 8.1 demonstrated the lowest intake of fluid (166.7 ml), while the fewest Calories (110 kcal) were consumed at 80.5 km. Fluid intake significantly (p < 0.05) exceeded the 8.1 km intake level from kilometers 32.4 to 80.5, while Caloric intake was significantly greater at 48.6 and 64.8 km. Urine output demonstrated a range of 183.3 ml over the 80.5 km, but no significant differences were noted. Average total urine output over the 80.5 km was 899.3 ml (13.3% of total fluid consumed).
Over the course of the entire 80.5 km, participants on average consumed 6,743.4 ml of fluid and 2,921 kcal (575 g carbohydrate, 59.9 g fat, 50.4 g protein). Table 3 summarizes the mean rate of fluid, energy, macronutrient, and mineral (sodium, potassium, magnesium) intake over the 80.5 km.
![]()
Table 3: Mean Rate of Intake for Selected Nutrients during 80.5 km Ultra-marathon Event.
View Table 3
Discussion
The increased participation of runners in ultramarathons, many of them new to the sport, necessitates a better understanding of the physiologic demands of this type of activity. While numerous studies [2-4,7-10,13,15-21] have measured variables associated with ultramarathon running, this study is the first to our knowledge that has assessed a broad spectrum of physiologic responses and nutrient and fluid intake in participants prior to, at regular intervals during, and post 80.5 km ultramarathon run.
A primary finding in this research was the consistency and stability of body weight, blood parameters (glucose, lactate, PV), blood pressure, and heart rate of the recreational runner participants. Following the participant-selected protocol of "run-walk" cycling and nutrient and fluid intake, the runners in this study maintained remarkably stable and consistent physiological properties regarding body weight, blood glucose and PV, and cardiovascular system functional status, thus optimizing the runners' overall health, safety, and performance in the face of a significant exercise challenge. Secondly, the study findings indicate that ultramarathon running poses considerable tissue stress, as demonstrated by significantly elevated measures of fatigue (RPE) and lower extremity pain (VAS) during and at least 12 hours following the event. These findings are further supported by the significant or trending elevations of WBC, NEU, and MON post event.
Over the 80.5 km distance, the runners in this study lost 0.94 kg, which was 1.3% of their pre-event body weight. While several studies [4,10,15,16] of competitive ultramarathon runners have demonstrated body weight losses exceeding 2% of pre-event weight, our results are consistent with the findings of Hsu et al. [3] who, in their study of urine output and body weight change of 21 runners competing in a 12 hour ultramarathon, found a decrease of 0.9% of body weight following the race. Newmark et al. [2] also demonstrated minimal body weight changes in a small sample (n = 3) of ultramarathon racers on a standardized hydration protocol.
While some research [3,12] has suggested that minimal change of body weight is an important factor in optimizing health and performance in ultra-endurance events, other research [10,15,16] suggests that weight loss exceeding 2% of pre-race body weight does not inhibit performance. Many factors (age, fitness level, prior training level, environmental conditions) other than fluid loss can impact changes in body weight in ultramarathon runners [15]. Still, researchers [10] have suggested that body weight loss of ≥ 3% may be indicative of dehydration in ultramarathon athletes, and fluid homeostasis alteration of this level may lead to health concerns of heat stress [6,12] or alteration in cardiovascular hemodynamics (especially in the presence of pulse pressures ≤ 25 mm Hg) [15]. For this reason, the practice of periodic monitoring of body weight and blood pressure during ultramarathon races, especially in elite runners competing in conditions of elevated heat and humidity, may be prudent assessments to protect the health of runners.
The participants in this study showed a modest and non-significant decrease (5.97%) in PV, consistent with previous work showing stable or increased PV in ultra-endurance runners [2,8,17]. The minimal changes in body weight and PV in our runners suggest they adequately met nutrient and hydration needs in the face of the substantial exercise challenge posted by the run. All three runners selected a "drink to thirst" hydration strategy. The stable PV values also likely contributed to the stable cardiovascular response (during the event HR ranged 11 bpm, SBP ranged 20 mmHg, DBP ranged 11 mmHg, and mean pulse pressure at 80.5 km was 37 mm Hg) seen during the run. In contrast to these findings, Fallon et al. [9] reported significant reductions in body weight and PV among seven ultramarathon runners completing 100 km, but these findings were obtained under competitive conditions. Our runners participated in a simulated race event, thus perhaps impacting their overall exercise intensity.
Caloric intake during the ultramarathon run (2,921 kcal) approximated 52.2% of the total energy required for a 70 kg man to run 80.5 km [25] (p281). Our participants consumed approximately 75% of Calories from carbohydrate, 18% from fat, and 7% from protein. This percentage of Calories from carbohydrate exceeded that of the 24 h pre-event and post event diets (approximating normal dietary intake), which ranged from 60-63% of calories. The total Caloric intake of our runners was considerably greater than that reported Fallon et al. [9] (1,011 kcal) measured in competitive runners during a 100 km event, and was similar to that of runners studied by Stuempfle et al. [10] who completed approximately 96.5 km of a competitive 161 km event. The percentage of Calories from carbohydrate in the studies by Fallon et al. [9] and Stuempfle et al. [10] (> 80%) was greater than the participants in our study. Rate of total energy (3.68 kcal.kg-1.hr-1) and carbohydrate (0.72 g.kg-1.hr-1) consumption of our runners fell slightly below recommended levels (4-6 kcal.kg-1.hr-1 and 1-1.5 g.kg-1.hr-1, respectively) as noted by Kreider [11]. The combination of total Caloric intake and percentage of Calories from carbohydrate in our subjects allowed for adequate carbohydrate availability for endurance exercise, as evidenced by the very stable blood glucose values (range 1.1 mmol/L), and the minimal impact on blood lactate levels (range 1.8 mmol/L; peak 2.67 mmol/L).
The mean fluid intake for the 80.5 km in the current study was 6,743.4 ml, which exceeded the mean fluid intake reported by Fallon et al. [9] (5,700 ml). The rate of fluid intake of our subjects for 80.5 km was 8.50 ml.kg-1.hr-1, which was almost identical (8.6 ml .kg-1.hr-1) to the 96.5 km runners studied by Stuempfle et al. [10].
Performance time for each 8.1 km loop increased over time during the 80.5 km event and was significantly greater from kilometers 48.6-80.5. The dramatic rise in run time seen at 80.5 km was influenced by elevated ambient temperatures during the end of the run (peak of 33.3°C), which forced the participants to walk most of this final 8.1 km interval, with two of the three complaining of nausea and vomiting. The effect of the ambient temperature may be further demonstrated in the changes seen in PV of the subjects, as all subjects showed a reduction in PV (range 1.3 to 23.8%), suggesting increased fluid loss associated with sweating [9].
The findings of this study support previous work that demonstrates ultramarathon running induces considerable tissue stress and damage [4,7,9,17-20]. Our subjects demonstrated a consistent increase in both fatigue (as measured by RPE) and subjective assessment of lower extremity pain (as determined by VAS) both during the event, and up to 12 hours following the run. These findings are consistent with those of Utter et al. [20], who examined RPE of 28 participants completing an 68 km ultramarathon race, noting increases in RPE in light of stable HR and blood glucose responses (as with the subjects in this study). Tissue damage was further suggested by the significant increase in blood MON, and trends toward increases in blood concentrations of WBC, NEU, and EOS immediately following the run. These findings likely correspond to the initial response following injury caused by the prolonged musculoskeletal activity from completing an ultramarathon, and are consistent with several researchers [4,7,9,17] who have assessed hematological recovery in ultramarathon runners.
A prominent limitation to this study was the small number of participants. While a greater number of subjects would have been desirable, the extensive number of variables measured made timely collection of data challenging given our research team's personnel and financial resources. Future studies with access to enhanced research resources could potentially use this test protocol to sample more participants, perhaps encompassing both genders across a broader age range. The participants in this study were ultramarathon experienced, but recreational runners completing a simulated untramarathon event. This poses the advantage of our subjects representing the ever-growing number of novice participants in ultramarathoning events, but poses a disadvantage of comparing these results directly with other research obtained from competitive events. It would have also been desirable to assess other blood parameters, such as C-reactive protein (CRP) and creatine kinase (CK), as markers for inflammation and tissue damage. Several researchers [7,9,17] have noted increased levels of CRP, CK and other biomarkers of liver and tissue dysfunction in ultramarathon runners.
Conclusion
This research showed through serial measures of multiple physiologic factors and nutrient and fluid intake that experienced recreational female ultramarathon runners were able to maintain physiological homeostasis over the course of an 80.5 km run. While these runners were able to maintain body weight, blood parameters, and cardiovascular system function, they perceived ever-increasing fatigue and lower extremity pain during, and up to 24 hours following the event. This, along with increases in selected WBC components, suggests the pain and fatigue were likely impacted by tissue inflammation and damage as a result of the prolonged exertion.
Acknowledgement
This work was presented in abstract form at the 2013 American College of Sports Medicine National Meeting in Indianapolis, IN USA.
The authors declare no conflicts of interest, and no external sources funded this research.
Ethical Statement
The study protocol was approved by the University of Findlay Institutional Research Review Board (approved 13 April 2011) and all participants provided their written informed consent. All investigators met certification from the USA National Institute of Health "Protecting Human Research Participants" training.
References
-
Ultramarathon Running (2014).
-
Newmark SR, Toppo FR, Adams G (1991) Fluid and electrolyte replacement in the ultramarathon runner. Am J Sports Med 19: 389-391.
-
Hsu TF, Chen YJ, Chou SL, Kao WF, Fan JS, et al. (2009) Urine output and performance of runners in a 12-hour ultramarathon. Clin J Sport Med 19: 120-124.
-
Passaglia DG, Emed LG, Barberato SH, Guerios ST, Moser AI, et al. (2013) Acute effects of prolonged physical exercise: evaluation after a twenty-four-hour ultramarathon. Arq Bras Cardiol 100: 21-28.
-
Clarkson PM (2007) Exertional rhabdomyolysis and acute renal failure in marathon runners. Sports Med 37: 361-363.
-
Kenefick RW, Sawka MN (2007) Heat exhaustion and dehydration as causes of marathon collapse. Sports Med 37: 378-381.
-
Wu HJ, Chen KT, Shee BW, Chang HC, Huang YJ, et al. (2004) Effects of 24 h ultra-marathon on biochemical and hematological parameters. World J Gastroenterol 10: 2711-2714.
-
Fallon K, Sivyer G, Sivyer K, Dare A (1999) The biochemistry of runners in a 1600 km ultramarathon. Br J Sports Med. August 33: 264-269.
-
Fallon KE, Broad E, Thompson MW, Reull PA (1998) Nutritional and fluid intake in a 100-km ultramarathon. Int J Sport Nutr 8: 24-35.
-
Stuempfle KJ, Hoffman MD, Weschler LB, Rogers IR, Hew-Butler T (2011) Race diet of finishers and non-finishers in a 100 mile (161 km) mountain footrace. J Am Coll Nutr 30: 529-535.
-
Kreider RB (1991) Physiological considerations of ultraendurance performance. Int J Sport Nutr 1: 3-27.
-
American College of Sports Medicine, Sawka MN, Burke LM, Eichner ER, Maughan RJ, et al. (2007) American College of Sports Medicine position stand. Exercise and fluid replacement. Med Sci Sports Exerc 39: 377-390.
-
Lebus DK, Casazza GA, Hoffman MD, Van Loan MD (2010) Can changes in body mass and total body water accurately predict hyponatremia after a 161-km running race? Clin J Sport Med 20: 193-199.
-
Hew-Butler T, Ayus JC, Kipps C, Maughan RJ, Mettler S, et al. (2008) Statement of the Second International Exercise-Associated Hyponatremia Consensus Development Conference, New Zealand, 2007. Clin J Sport Med 18: 111-121.
-
Landman ZC, Landman GO, Fatehi P (2012) Physiologic alterations and predictors of performance in a 160-km ultramarathon. Clin J Sport Med 22: 146-151.
-
Blaber AP, Walsh ML, Carter JB, Seedhouse EL, Walker VE (2004) Cardiopulmonary physiology and responses of ultramarathon athletes to prolonged exercise. Can J Appl Physiol 29: 544-563.
-
Peters EM, Robson PJ, Kleinveldt NC, Naicker VL, Jogessar VD (2004) Hematological recovery in male ultramarathon runners: the effect of variations in training load and running time. J Sports Med Phys Fitness 44: 315-321.
-
Hoffman MD, Stuempfle KJ (2014) Hydration strategies, weight change and performance in a 161 km ultramarathon. Res Sports Med 22: 213-225.
-
Martin V, Kerherve H, Messonnier LA, Banfi JC, Geyssant A, et al. (2010) Central and peripheral contributions to neuromuscular fatigue induced by a 24-h treadmill run. J Appl Physiol (1985) 108: 1224-1233.
-
Utter AC, Kang J, Nieman DC, Vinci DM, McAnulty SR, et al. (2003) Ratings of perceived exertion throughout an ultramarathon during carbohydrate ingestion. Percept Mot Skills 97: 175-184.
-
Hoffman MD, Lee J, Zhao H, Tsodikov A (2007) Pain perception after running a 100-mile ultramarathon. Arch Phys Med Rehabil 88: 1042-1048.
-
Jackson AS, Pollock ML (1985) Practical assessment of body composition. Phys Sport Med 13: 76-90.
-
Dill DB, Costill DL (1974) Calculation of percentage changes in volumes of blood, plasma, and red cells in dehydration. J Appl Physiol 37: 247-248.
-
Fat Secret (2012) All things food and diet.
-
McArdle WD, Katch FI, Katch VL (2006) Essentials of Exercise Physiology. 3rd (edn) Baltimore, MD: Lippincott Williams & Williams 187-188, 452.


