This work introduces a deterministic model of COVID-19 spread aimed at analyzing non-pharmaceutical interventions in Kenya. The model accounts for symptomatic, asymptomatic and environmental transmission. Using the SEIR (Susceptible-Exposed- Infected-Recovered) compartmental model with additional component of the pathogen, the dynamics of COVID-19 outbreak is simulated while focussing on the impact of different control measures in the reduction of the basic reproduction number. The resulting system of ordinary differential equations (ODEs) is solved using a combination of fourth and fifth-order Runge-Kutta methods. Simulation results indicate that non-pharmaceutical measures such as school closure, social distancing and movement restriction emphatically flatten the epidemic peak curve by reducing the basic reproduction number.
Basic reproduction number, COVID-19, Intervention, SARS-CoV-2, SEIR-P, Simulation
Corona Virus Disease (COVID-19) is an infectious disease that is caused by Severe Acute Respiratory Syndrome Coronavirus 2 (SARS-CoV-2). The first case was reported in main-land China, City of Wuhan, Hubei on 29th December 2019 [1]. Later on, the novel disease spread to countries in contact with China resulting in World Health Organization (WHO) declaring it as a Public Health Emergency of International Concern (PHEIC) on 30 January 2020 World Health Organisation [2]. As of 27th July 2020 the number of reported confirmed cases globally had exceeded sixteen million [3] with Africa recording approximately seven hundred thousand of those cases. The 1st case in Kenya was reported on the 13th of March 2020 [4] and currently there are close to twenty thousand confirmed cases [3].
The three main types of infectiousness of COVID-19 are asymptomatic, pre-asymptomatic and symptomatic. The incubation period for COVID-19 in the pre-asymptomatic infectious group, which is the time between exposure to the virus (becoming infected) and symptom onset, is on average 5-6 days, however it can be up to 14 days. During this period some infected persons can be contagious. In a symptomatic COVID-19 case, the disease manifests itself with signs and symptoms. Asymptomatic transmission refers to transmission of the virus from a person, who does not develop symptoms [5]. The basic reproductive number (R0), defined as the average number of secondary infections produced by a typical case of an infection in a population where everyone is susceptible [6], is affected by the rate of contacts in the host population, the probability of infection being transmitted during contact and the duration of infectiousness. The COVID-19 R0 in Kenya ranges from 1.78 to 3.46 [7]. The outbreak is thought to spread through a population via direct contact with infectious individuals [8] or cross transmission through pathogen contamination in the environment. Specifically, the virus is primarily spread between people during close contact, often via small droplets produced by coughing, sneezing, or talking [5,6,9,10,11]. After breathing out these droplets usually fall to the ground or on to surfaces rather than remain in the air over long distances [6,7,9]. People may also become infected by touching a contaminated surface and then touching their eyes, nose, or mouth [9,10]. The virus can survive on surfaces for up to 72 hours [11].
This kind of transmission has had adverse social and economic impact because all segments of the population are significantly affected. The disease is particularly detrimental to vulnerable social groups such as older age-groups, persons with disabilities and people with other underlying diseases. If the pandemic is not properly addressed through policy, the social crisis generated from COVID-19 could also increase inequality, exclusion, discrimination and global unemployment in the medium and long term United Nations: Department of Economic and Social Affairs Inclusion [12]. Inorder to achieve suitable control measures of COVID-19, a Susceptible-Exposed-Infected-Recovered (SEIR) mathematical prediction model is required. Prediction trends from the model are largely influenced by policy and social responsibility of a given country [13]. These trends enable us to understand how SARS-CoV-2 could spread across a given population and inform control measures that might mitigate future transmissions [11]. Nonpharmaceutical interventions based on sustained physical distancing have a strong potential to lower and flatten the epidemic peak in the absence of a vaccine [14]. Premature and sudden lifting of such interventions could lead to an earlier secondary peak [15].
An epidemiological study was done on a human-pathogen model that incorporated individuals with robust immunity in its compartments; the model examined human behavior during the disease outbreak, such as ignorance of social distancing so as to advise health care workers (HCW) [16]. It was established that nonpharmaceutical interventions play a major role in flattening the epidemic peak.
According to the WHO/China Joint Mission Report, 80% of laboratory-confirmed cases in China up to 20 February 2020 have had mild to moderate disease including both non-pneumonia and pneumonia cases; whilst 13.8% developed severe disease and 6.1% developed to a critical stage requiring intensive care [9]. It is therefore paramount to come up with an epidemiological model that factors in hospitalization of the mild to moderate cases and severity of the disease transmission.
In this study we explore a human-pathogen model mathematical model with infectious groups, hospitalized population, human population in intensive care unit and the fatalities. The study further investigates the effects of lifting non-pharmaceutical interventions such as school closure, physical distancing and lockdown on the model. It is envisaged that the dynamics of the results shall inform health experts in their research of efficient and effective ways of flattening the curve.
In this study a human-pathogen SEIR-P model for COVID-19 outbreak is formulated. The model considers a short-time period thereby ignoring the demographics of births and natural death. The total human population is subdivided into the susceptible human beings S(t), the exposed human beings E(t), the asymptomatic infectious population IA(t), the symptomatic infectious population IM(t), the critical infectious population IC(t), the hospitalized population H(t) in ordinary wards and U(t) in Intensive Care Unit (ICU), the fatalities D(t) and the recovered population R(t). The pathogen vector in the environment is denoted by P(t).
The model in Figure 1 culminates to a ten dimensional system of ordinary differential equations as follows;
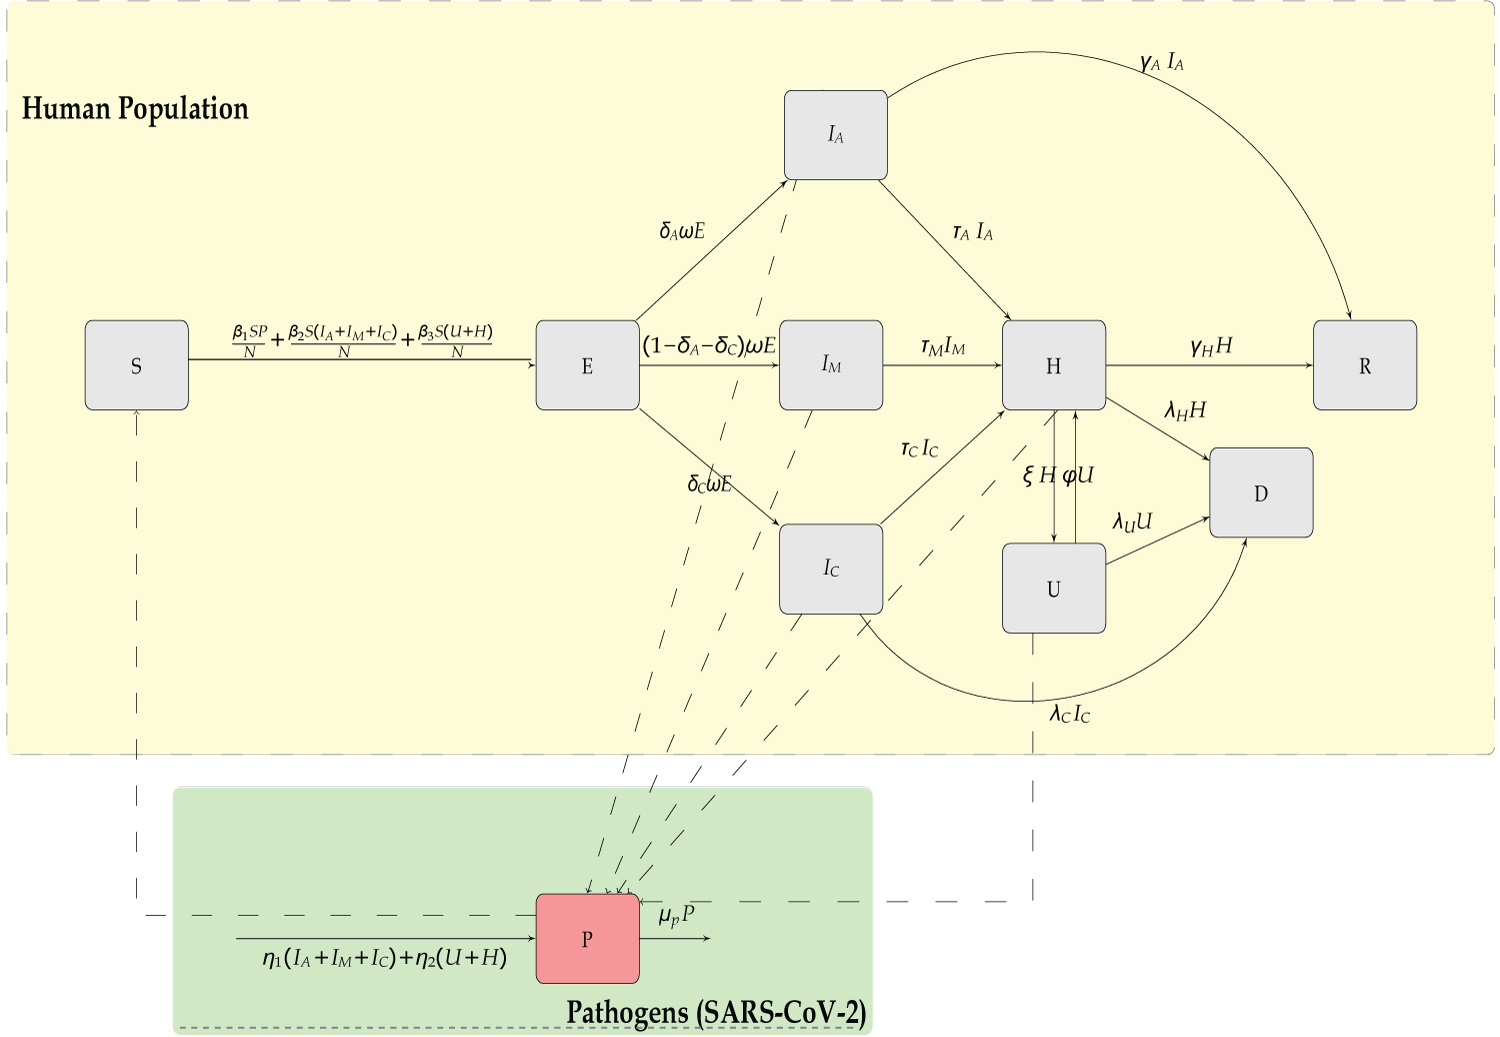 Figure 1: Compartmental model of the SEIR model of transmission of COVID-19.
View Figure 1
Figure 1: Compartmental model of the SEIR model of transmission of COVID-19.
View Figure 1
with the initial conditions:
S(0) > 0, E(0) > 0, IA(0) = 2, IM(0) = 2, IC(0) = 2,
H(0) = 0, U(0) = 0, D(0) = 0, R(0) = 0, P(0) = 5000. (2.2)
The terms and denote the rate at which the susceptible individuals S(t), gets infected by the pathogens from environment (P(t)), infectious humans (IA(t), IM(t) and IC(t)), and hospitalized humans (U(t),H(t)) respectively. A quarter of reported cases of COVID-19 are mainly asymptomatic infectious IA(t), while the larger group is mild infectious IM(t), with a smaller proportion being critical infectious IC(t).
IA(t) may join the recovery group R(t) or seek medical intervention from H(t). IM(t) and IC(t) may go to hospital H(t), but upon critical diagnosis be referred to the ICU U(t) which may result to fatalities D(t) or recovery R(t). The table of parameters is as shown in Table 1 below.
Table 1: Description of Model Parameters. The parametric values are determined based on the references [5,7,14-19]. View Table 1
In the Disease Free Equilibrium (DFE) there are no infections from the humans nor the pathogens resulting to S = N. This implies that P = IA = IM = IC = U = H = 0 which further implies that E = D = R = 0. The Basic Reproduction Number (R0) is defined as the average number of secondary infections produced by a typical case of an infection in a population where everyone is susceptible [6]. This number is affected by the rate of contacts in the host population, the probability of infection being transmitted during contact and the duration of infectiousness. The next generation matrix method is used to obtain the R0.
Let x = (E, IA, IM , IC, H, U, P )T then the model can be written as
where
Evaluating the derivatives of F and V at the Disease Free Equilibrium yields matrix F and V as follows;
Substituting, λC + τC = C2, τA + γA = C3 , (φ + λU )-ξφ = C6 -ξφ = C4, ξ + λH + γH = C5, φ + λU = C6 and (ξ + λH + γH ) (φ + λU ) = C5C6 - ξφ = C1 in matrix V yields
The inverse of matrix V is determined as
The product FV-1 that results to;
where
R0 is the spectral radius of the product FV-1 that results to;
Here R0 is the sum of three terms representing the average new infections contributed by each of the three infectious classes; pathogens, infectious groups (mild, asymptomatic and critical) and hospitalized groups denoted by β1, β2 and β3 respectively.
Implementation of the NPIs is aimed at reducing the contacts within the population. Reduction of the contacts reduces the R0, which is expressed in terms of the infection transmission rates β1, β2 and β3 in the previous section. Since low rates of infection transmission implies a low value of R0 then we implement the non-pharmaceutical interventions (NPIs) by multiplying the rates of infection transmissions by a 20% and 30% factor. The interpretation is that the NPIs yield an overall mitigation of the epidemic spread by 20% and 30% respectively. Kenya instituted various mitigation strategies immediately the first case of COVID-19 was confirmed, therefore in this study the R0 at the beginning of epidemic is taken as 1.50. The R0 corresponding to 20% and 30% contact reduction are 1.28 and 1.17 respectively.
A simulations study was done using a total population of Kenya, N, as 4.76 × 10⁷. Additionally, an identification rate p of new infectious cases was considered and determined as the ratio of confirmed cases over the total number of tested individuals. At the time of this study p was 0.022, while the parameter values were taken as shown in Table 1. The simulation was initialized at date 13-3-2020 and run for 365 days with the initial values IA(0) = 2, IM(0) = 2, IC(0) = 2, and P (0) = 5,000, while the other variables (except S(0)) were initially set to 0.
The results of the infectious (IA + IM + IC) and hospitalized (H + U) cases in Kenya are shown in Figure 2, and epidemic peak values and dates are depicted in Table 2. In unmitigated situation, the peak arrives rather quickly, in about 4 months probably due to the asymptomatics significantly contributing to the epidemic spread. We note that the Kenyan population is largely comprised of youth, who are majorly presumed to be an asymptomatic population. Our model predicts that if the overall control measures achieve 20% effectiveness in slowing the spread of COVID-19, then a delay of slightly 2 months is realized, which gave the health care systems time of gathering resources to manage the epidemic. Consequently, the reported infectious and hospitalized cases are reduced by about 49%. However, there is a likelihood of exceeding the health capacities. A 30% effectiveness of the applied NPIs substantially bring the epidemic further down, and as noted in Figure 3 the simulated cumulative infectious cases largely coincides with the data of COVID-19 epidemic in Kenya. Moreover, this particular mitigation effort reduce the cumulative infectious cases from just under 839,510 down to around 498,812 cases by date 13-Mar-2021. A similar reduction is also seen in the cumulative number of hospitalized cases. Moreover, the cumulative deaths attain about 59.4% reduction, from about 6,584 cases in unmitigated situation to around 3,909 cases in the 30% mitigation scenario. Majority of deaths emanate from those already in intensive care unit (ICU) U, which is presumably overwhelmed by the many critically ill patients arising from H and IC populations. The inability to access the limited ICU resources results to additional deaths from H and IC populations.
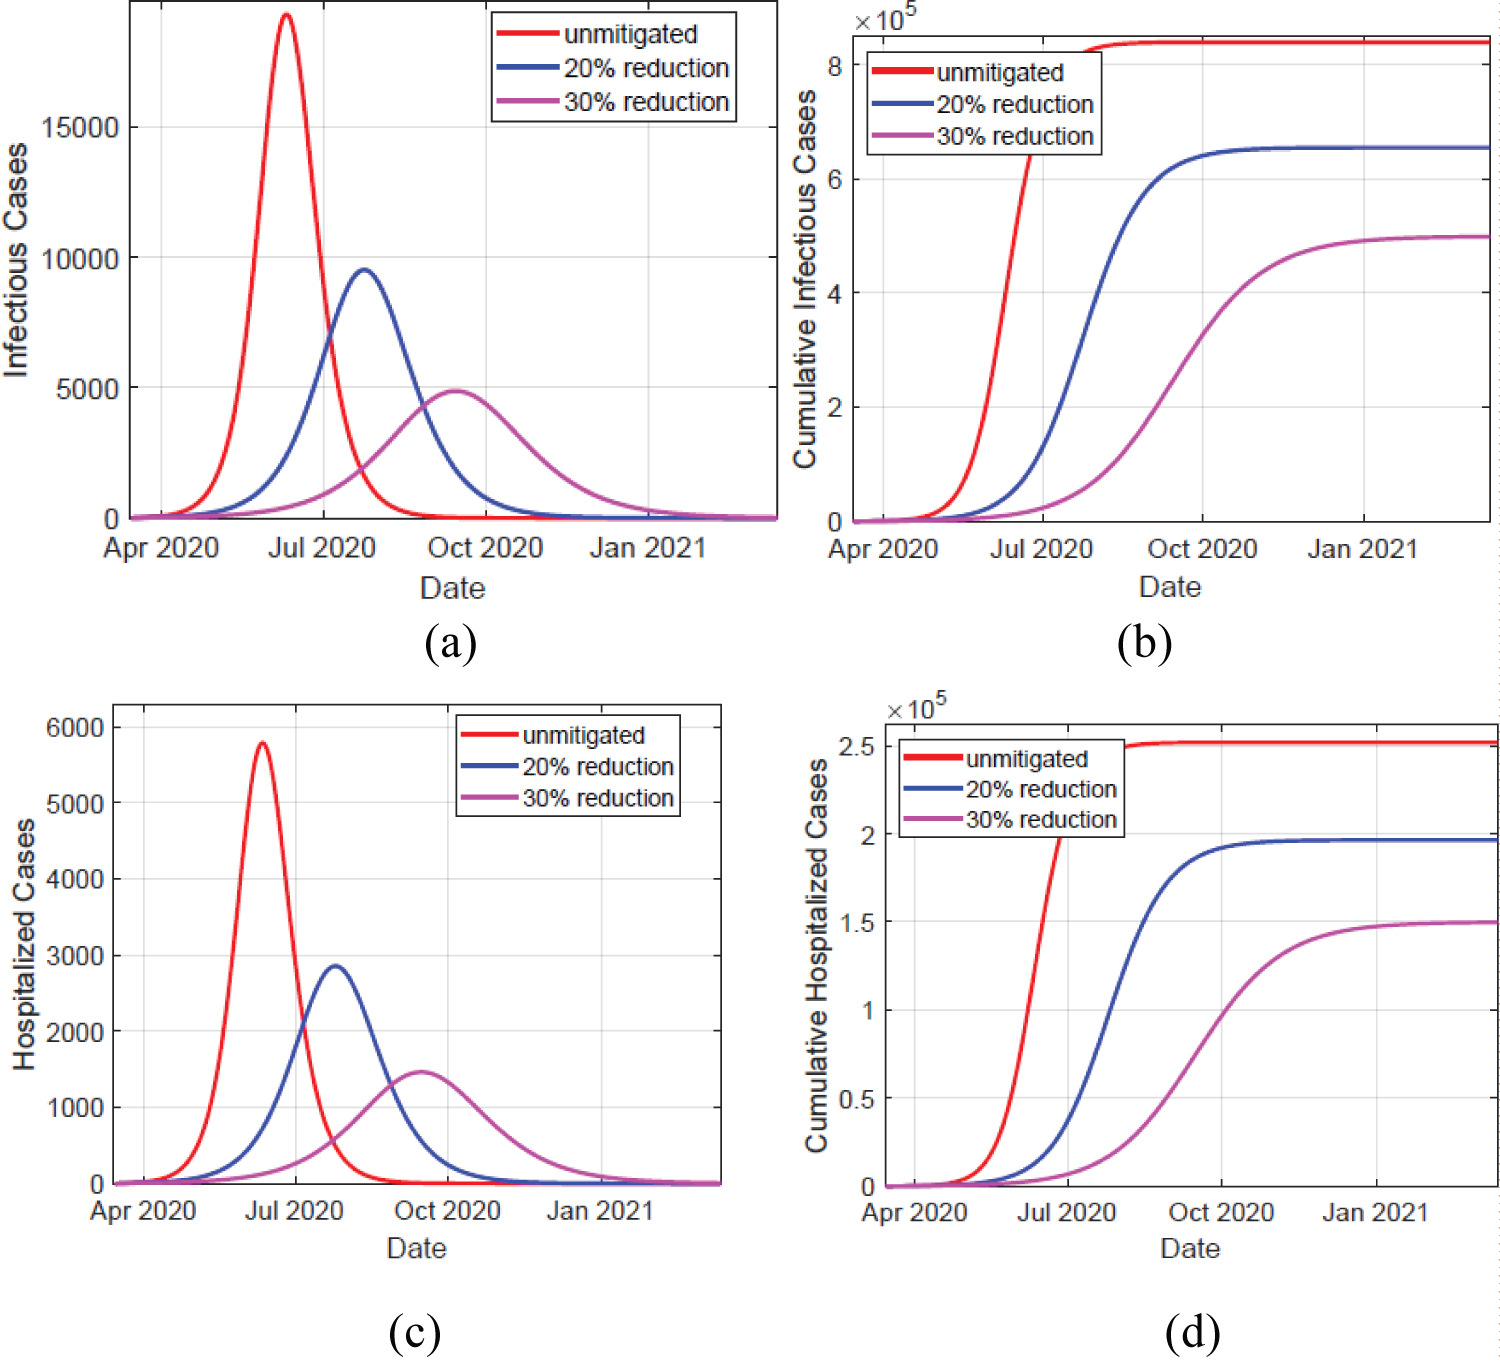 Figure 2: Left panels depicts simulation of infectious and hospitalized cases, in unmitigated and mitigated situations. The implementation of NPIs results to a delay and significant reduction in the cases, as shown by the varying peaks. Right panels show the simulated cumulative cases for both infectious and hospitalized individuals. The infectious cases comprise of individuals in compartments IA, IM , and IC cases. The hospitalized cases comprise of individuals in compartments H and U.
View Figure 2
Figure 2: Left panels depicts simulation of infectious and hospitalized cases, in unmitigated and mitigated situations. The implementation of NPIs results to a delay and significant reduction in the cases, as shown by the varying peaks. Right panels show the simulated cumulative cases for both infectious and hospitalized individuals. The infectious cases comprise of individuals in compartments IA, IM , and IC cases. The hospitalized cases comprise of individuals in compartments H and U.
View Figure 2
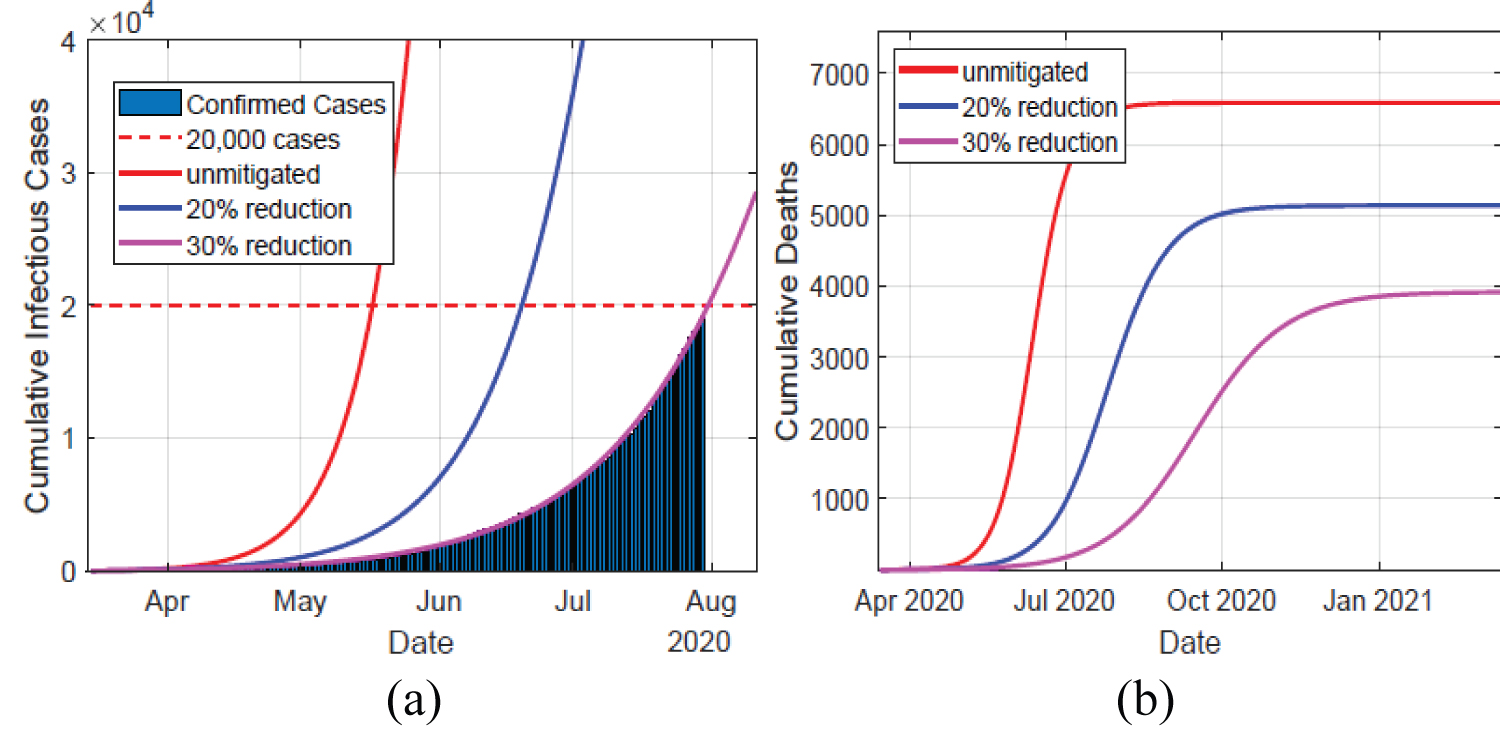 Figure 3: Left panel depicts the data of the confirmed cases in Kenya against the simulated infectious cases for the first 150 days, in unmitigated and mitigated situations. The simulated results of a 30% NPIs effectiveness coincides with the data. Right panel show the cumulative deaths, which decline significantly as the NPIs take effect.
View Figure 3
Figure 3: Left panel depicts the data of the confirmed cases in Kenya against the simulated infectious cases for the first 150 days, in unmitigated and mitigated situations. The simulated results of a 30% NPIs effectiveness coincides with the data. Right panel show the cumulative deaths, which decline significantly as the NPIs take effect.
View Figure 3
Table 2: Simulated peaks of infectious and hospitalized cases, with the associated peak dates. The table depicts the predicted peak values of (daily) reported cases and corresponding times. The cases are placed in two categories, namely: infectious (IA + IM + IC) and hospitalized (H + U). View Table 2
The control measures were put in place for the entire simulation time, so there was no rebound of the infections. A strong one-time social distancing measure would not sufficiently prevent overwhelming of the health care capacities, since it keeps a significant number of the population in susceptible compartment such that a rebound in infections, after the measure has been lifted, will lead to an epidemic wave that surpasses the capacity. Moreover, previous studies have shown that intermittent application of the NPIs maintains the infections within the health care capacities, but prolongs the total duration of the epidemic.
With absence of cure or vaccine for COVID-19 non-pharmaceutical that include measures such as contact tracing, quarantine, social distancing, wearing of face masks, and handwashing should be maintained. Mass testing and effective contact tracing has been a great challenge in low-income countries due to inadequate testing reagents and lack of proper coordination. Therefore, these countries have adopted social distancing measures such as closure of schools, reducing sizes of gatherings, minimizing contact in workplaces, and imposing curfews. The main aim of such interventions is to flatten the curve i.e. prevent infection from spreading fast and bring down the number of infected cases. Curve flattening is necessary because it avoids overwhelming the health systems and gives them time to develop treatment mechanisms.