COVID-19 outbreak was first reported in Wuhan, China and has spread most of the countries of the world. The outbreak spreads are largely influenced by each country's policy and social responsibility. According to WHO, the estimate of attack the rate on 23, June, 2020 to be between 1.4 to 2.5. In India the situation is somehow controllable compared to the situations of developed countries. It will be worth interesting to know about the fact and figures of corona cases in India. The different types of data are available on worldometers. We have tried to analyse such data for India and made different kinds of prediction regarding affected rate, daily new cases, daily total finished cases etc. From our study we observed that the affected rate may decrease after 31-03-2020. Daily new cases will be under control and decreases from the end of April, 2020. After 23-06-2020 there may not be any pending effective cases.
DTC: Data Consist Daily Total Cases; DNC: Daily New Cases; DRC: Daily Recovered Cases; DD: Daily Deaths; AR: Attack Rate; PAR: Predictive Attack Rate; TFC: Total Finished Cases; FR: Finished Rate; PTFC: Predictive Total Finished Cases
The corona virus COVID-19 originated from Wuhan, the city in central China. The symptoms of corona virus are fever, cough and shortness of breath. It typically causes flu-like symptoms. In some patients particularly the elders and others with other chronic health conditions- these, symptoms can develop into pneumonia, with chest tightness, chest pain and shortness of breath. It seems to start with a fever, followed by a drug cough. After a week it can lead to shortness of breath, with about 20% patients requiring hospital treatment.
According to WHO-China Joint Mission published the following median time to clinical recovery:
- Mild cases: Approximately 2 weeks.
- Sever or critical disease: 3-6 weeks.
- Time from onset to the development of sever disease: 1 week.
The coronavirus COVID-19 is affecting 192 countries and territories around the world and one international conveyance (the Diamond Princess Cruise Ship harbored in Yokohama, Japan).
Wuhan, the city in Central China where the virus originated. The city on January 23, shutdown transport links. The attack rate (how rapidly the disease spreads) of a virus is indicated by its reproductive number, denoted by Ro. The reproductive rate represents the average number of people to which a single infected person will transmit the virus. According to WHO, the estimate of the rate on 23, June, 2020 to be between 1.4 to 2.5.
In India first case reported on 30, January 2020 from Kerala. The number of corona virus infected in India crossed the 200 number after a spike in cases over the past six days. The challenge for India versus its peers is starker if infections spread rapidly considering the higher density of population per capita and weaker health infrastructure. Day by day total number of corona virus cases have been increasing in folded. The centre and state governments have decided to completely shutdown 75 districts across the country where corona virus cases have been reported. It has also been decided to suspend the interstate bus services till March 31. Major train services are also suspended till March 31, including sub-urban rail services, exempting goods trains. All metro rails services are also suspended. At present it is extended to 3, May 2020. Millions of people across the country stays indoors.
India is at second rank as per the area and the population density. Compared to other developing countries of the world, India possess a good control on the spread of corona virus. It will be worth interesting to know the attack rate, and rate of finished cases (recovered and death).
Various types of analysis have been made on COVID-19 data. Rachah and Torres [1] have done Analysis, simulation and optimal control of a SEIR model for Ebola virus and modelled with MCMC. Porter [2] used demographic effects such as birth and death rates in the SEIR to model equilibrium with vital dynamic. Hamzah, et al. [3] has considered Worldwide COVID-19 Outbreak data analysis and prediction using SEIR models with nonlinear ordinary differential equations. Rodriguez-Morales [4] have performed systematic review including mete analysis to assess clinical, laboratory imaging features and outcomes of COVID-19 confirmed cases.
Kumar, et al. [5] analyzed state wise data related to COVID-19 in India. Salgotra, et al. [6] reported time series model to forecast confirmed cases and death cases in India across the most affected states namely Maharashtra, Gujarat and Delhi and as a whole India using the genetic programming.
Ghosal, et al. [7] have determined the trend related to death counts observed at 5th and 5th week of the COVID-19 in India based on linear regression and multiple regression analysis. Schueller, et al. [8] have studied the potential impact of lockdown in India and estimated a basic reproduction rate, but in both the papers they have not predicted the number of cases.
Ranjan [9] estimated a final epidemic size of 13000 cases and predicted that India will enter in equilibrium position by the end of May 2020. The prediction has been made based on exponential, logistic and SIR models. In this article we have analyzed the corona cases data of India. The data is downloaded from the website: worldometers.info/coronavirus/country/India on 28-April 2020.
The data consist daily total cases, daily new cases, daily recovered cases and daily deaths. The attack rate for day t is calculated from the ratio of DNC of day t to DTC of day t-1.
This work was aimed to develop a model to predict attack rate and total finished cases for future and to find out the breakeven point for total cases and total finished cases. That means a time point after which there will not be any new active cases of corona virus in India under the assumption that the current environmental situations remains same.
We have used the data of COVID-19 cases in India from 1-3-2020 to 28-4-2020 time period. Based on the data regarding daily total cases, daily new cases, daily recovered cases and daily deaths the following simple mathematical equations are used to calculate attack rate, effective cases and finished rate.
ARt = Daily new cases produce on day (t + 1)/total cases on day t
Effective cases on day t = Effective daily cases on (t-1) + daily new cases on day t - daily
finished cases on day t
FRt = daily finished cases on day t/effective cases of day t
First of all we have plotted the daily attack rate against day t. The graph is shown below for 48 days (from 1-3-2020 to 17-4-2020). Here t = 1 for date 1-3-2020 and so on.
From the Figure 1 we observed that the attack rate was fluctuating up to 31 days (31-3-2020) but after that it seems decreasing which shows the significant effect of lockdown period started form 23-3-2020. So we have used the attack rate from 31-3-2020 to build up a predictive model based on day time.
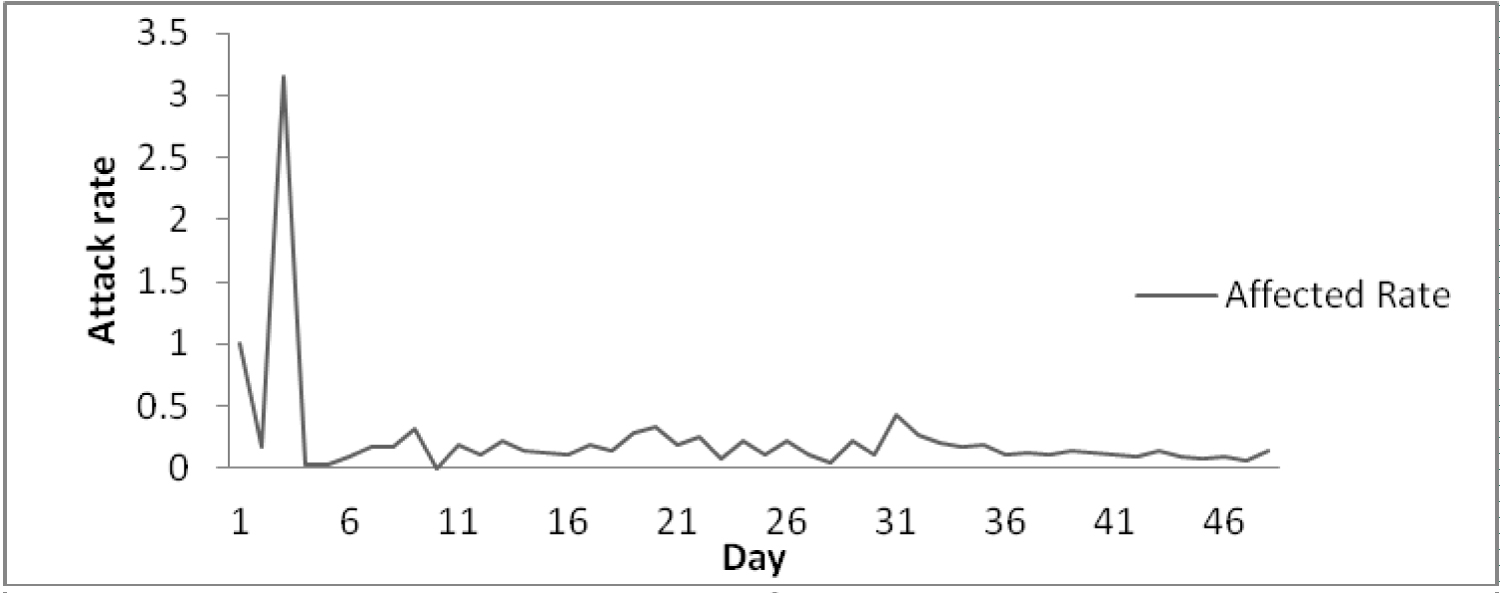 Figure 1: The graph of AR.
View Figure 1
Figure 1: The graph of AR.
View Figure 1
Power curve model is used for attack rate (rate of infection) against time (day) t based on the data 31-3-2020 to 17-4-2020. Table 1 shows that R-squared and adjusted R-squared are high with p-value 0.000 which shows the good capability of the model (Table 2).
Table 1: Power curve model summary. View Table 1
Table 2: ANOVA of power curve. View Table 2
From Table 3, the outcomes of the fitted model summary, we build up the prediction equation for attack rate on day t as
Table 3: Coefficients for power curve. View Table 3
The above fitted power curve model is used to predict daily attack rate. A very simple mathematical equation for daily new cases for time period after 31 days can be determined as follow:
Predicted daily new cases on day t = ARt (total cases on day (t-1)) (2)
Hence the predictive cumulative total cases up to day t can be computed by adding predicted daily new cases on day t to previous day total cases.
The following graph shows the observed values and predicted values of AR (Figure 2).
 Figure 2: Graph of predicted AR.
View Figure 2
Figure 2: Graph of predicted AR.
View Figure 2
To predict total finished cases (TFC) up to day t the cubic model is developed as below:
From Table 4 and Table 5 we observed a very strong value of R-squared and adjusted R-squared. Which revels the strong goodness of fit of the cubic model for TFC.
Table 4: Cubic model summary. View Table 4
Table 5: ANOVA of cubic model. View Table 5
From the Table 6 we observed very high significant effect of time t and t3 on total finished cases, since p-values are 0.000, which shows that the cubic model is highly reliable to predict total finished cases.
Table 6: Coefficients for cubic model. View Table 6
Thus, the cubic model for total (cumulative) finished cases up to day t is built up as
Predictive total finished cases can be obtained by the above model for future days.
From the Figure 2 and Figure 3 we say that the total (cumulative) finished cases will increases day by day with higher rate. And affect rate (infection rate) decreases day by day (after 31 days) may be due to strict lockdown effect and proper treatment to the affected cases.
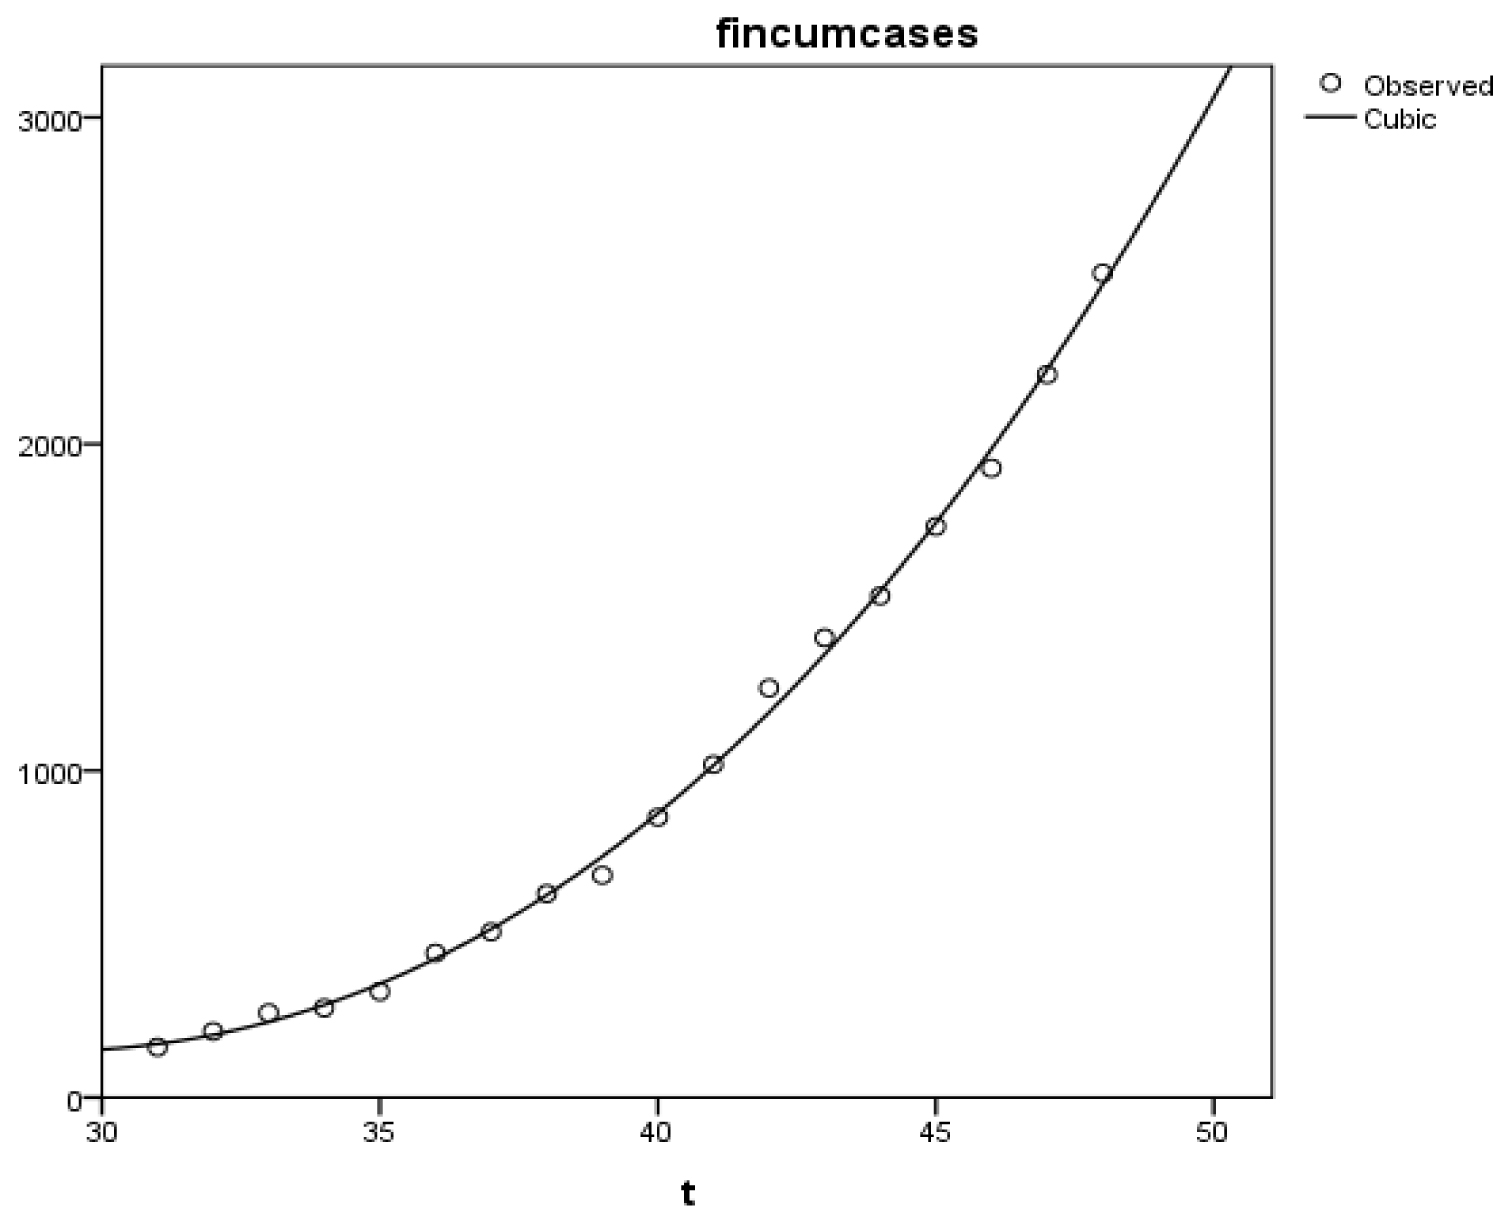 Figure 3: Graph of predictive total finished cases.
View Figure 3
Figure 3: Graph of predictive total finished cases.
View Figure 3
The predictive effective cases up to day t is computed by subtracting predicted total finished cases from predicted total cases up to day t.
To know the break-even point the graph of predictive total cases and predictive total finished cases are plotted on the same graph as Figure 4.
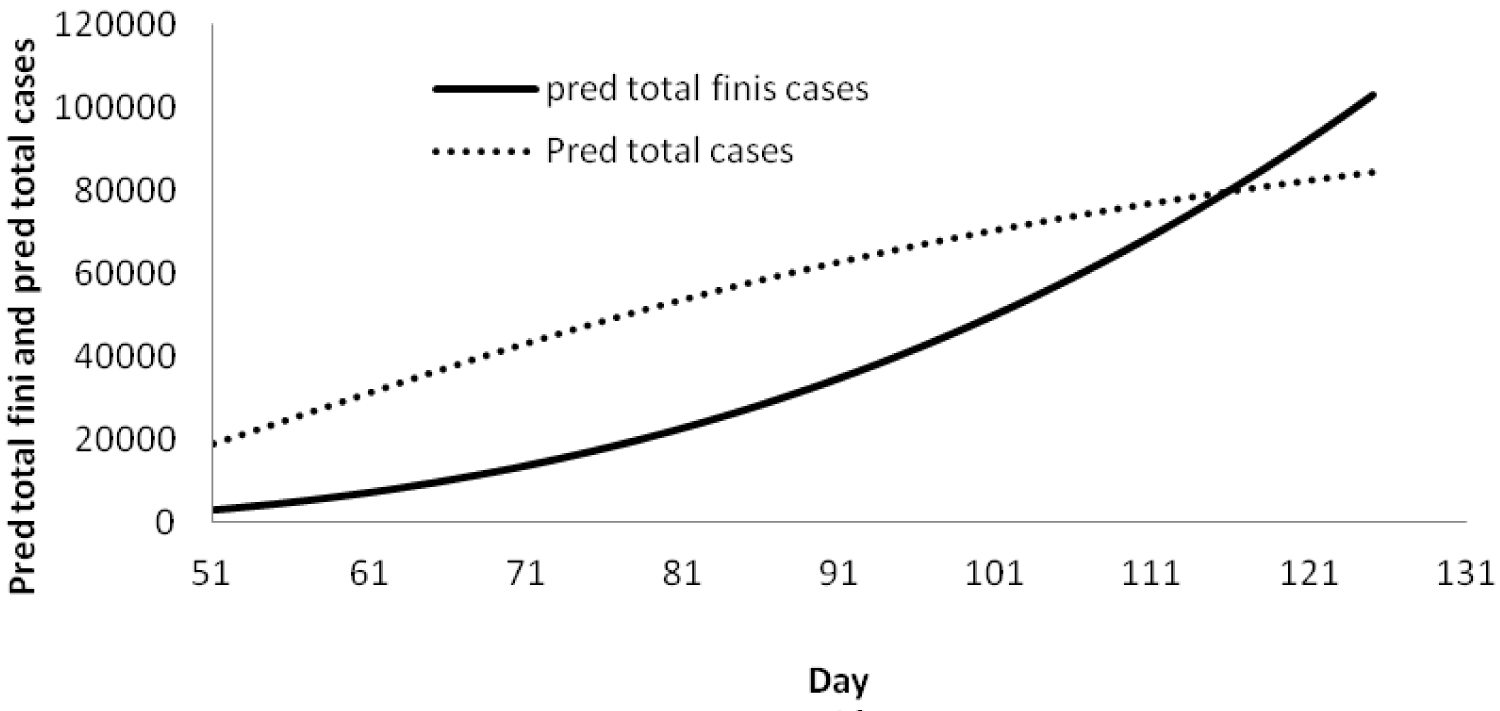 Figure 4: Graph of cumulative finished cases.
View Figure 4
Figure 4: Graph of cumulative finished cases.
View Figure 4
From the Figure 4 we observed that both the curves intersect between day 115 and 116. That means the rate of predictive finish cases would be more than that of predictive total cases after the day 115. Hence there will not be any pending effective cases after 115 days (i.e. after 23-6-2020) (Table 7 and Table 8).
Table 7: Data Downloaded from Worldometer. View Table 7
Table 8: Table of Predictive Results. View Table 8
The spread of COVID-19 epidemic has been slow in India compared to other countries like USA and Italy due to the social distancing measures taken by the government of India. In our study we observed that due to lockdown measure the affect rate was decreasing, though the rate is slow but it has also a positive effect on total cases. We also observed that the total finished cases increases, which is the outcome of the good efforts taken the government and medical staffs. On the basis of the current environment and situations we have tried to fit two models (i) Power curve model for attack rate and (ii) Cubic model for total finished cases. The following conclusions have been formulated on the basis of the proposed analysis.
1. The proposed power curve model is highly reliable in predicting attack rate in India.
2. The R values and adjusted R values both are high with p-value 0.000, which shows the higher chance of reliable prediction about the attack rate.
3. The cubic model used to predict total finished cases found highly reliable for prediction since R-squared and R-squared adjusted values are very much high and significant. Also the time variables t and t3 both are significant with p-values 0.000.
We also observed that total finished cases increases heavily day by day. This shows the good efforts done by central and state governments and medical staffs.
4. Daily new cases decrease from the end of April-2020.
5. As total cases decreases and finished cases increases, a break-even time is observed on 23-06-2020. That means after 23-06-2020 there will be not be any actual affected cases left. Hence the spread of COVID-19 cases would be under control.
Thus overall, it can be said that the power curve model and cubic models are highly reliable and can be used as predictive model for predicting attack rate and total finished cases in India. According to our analysis, if situation continue in present state; after 6-05-2020 the attack rate decreases to 3 per day per 100 total cases and will be 1 per 100 total cases after 9-06-2020. We suggest that the government should take more effective actions to control the spreads of COVID-19 cases. The outcomes of our analysis would help planning for the future course of action to the government and the medical team associated with treatment to COVID-19 cases. The projections are based on the current trend and may fail if an unforeseen development occurs.
None.
None.
The author is grateful to the Editor and the anonymous referee for making many helpful comments and suggestions on an earlier version of this paper.