The co-infection of Tuberculosis with HIV has continually placed an immense burden on public health systems, mostly in Low and Middle Income (LMIC) countries. We present a geographical analysis of current intervention programs and prevalence rates in two West African states (Ghana and Nigeria). In some regions with higher co-infection rates and dense population, interventions were seen to be relatively lower, relative to other less densely populated regions. A hybrid mathematical and agent-based model for determining optimal treatment strategy for Active TB and HIV co-infection is presented. Deterministic mathematical equations for each sub-model were implemented in continuous models. Analysis of our model output indicates that full treatment of active TB prior to the commencement of HIV treatment could be more effective in eradicating TB. In resource-scarce settings, intervention programs should be geared towards detecting and treating HIV negative individuals infected with active TB disease, as a method of preventing co-infection.
Despite significant progress in diagnosis, prevention and treatment, tuberculosis (TB) and HIV/AIDS co-infection has remained a major public health problem in many parts of the world. Persons living with HIV (PLHIV) are about 30 times more likely to develop active TB, due to compromised immunity [1]. Both diseases have remained raging epidemics, particularly in developing countries. TB is the leading cause of death among PLHIV, including individuals on antiretroviral treatment. An estimated 1.3 million persons globally are living with TB and HIV/AIDS co-infection [2]. About 84% of these cases occur in sub-Saharan Africa [3]. 32% of AIDS-related deaths in 2017 were as a result of TB complications and 920,000 HIV positive individuals became ill due to TB within the same period [1,4]. In West and Central Africa, 65% of people living with HIV are unaware of their status and are therefore not receiving any form of treatment. This results in higher vulnerability to tuberculosis [5]. Tuberculosis is caused by a bacteria called Mycobacterium tuberculosis and transmitted from an active TB infected person, through airborne routes [6]. Human Immunodeficiency Virus (HIV), the virus that causes AIDS is transmitted through contacts with certain body fluids of someone living with the virus. It attacks the body system and over time, destroys the immune system. However, effective use of antiretroviral therapy (ART) can lower the virus concentration in the body to an undetectable level and stop its multiplication.
Nigeria is one of the high burden countries for TB and TB/HIV co-infection, reportedly having approximately 8% of global TB cases (approximately 2 billion cases), is ranked first in Africa [7]. An average of 219 persons per 100,000 population are infected with TB each year in Nigeria and the prevalence of TB/HIV co-infection is 19.1% [8]. This results in 115,000 deaths per year from TB cases and 39,000 deaths from the co-infected population [9]. It is worrisome that only 104,904 cases were detected in 2017, out of the estimated 407,000, indicating treatment coverage of only 25.8%. The fact that only 1 in 4 of estimated cases are diagnosed each year makes TB control nearly impossible. The National Tuberculosis and Leprosy Control Program (NTBLCP) champions the fight against TB epidemic in Nigeria. It controls provision of basic treatment, prevention, testing and control strategies to and stop the spread of the TB/HIV disease co-infection, such as the Directly Observed Treatment Short-course (DOTS), Multi-Drug Therapy (MDT) and Buruli Ulcer (BU) drugs. In addition, it provides appropriate case management services to patients in collaboration with partner agencies. Commendable strides have been achieved in the expansion of TB testing and treatment sites. At the end of 2014, a total of 5,728 DOTS centers and 1,765 microscopy sites were operational in Nigeria. These additional testing sites increased TB case detection by 92%, with 65% of patients referred for appropriate treatment operational in Nigeria. These additional testing sites increased TB case detection by 92%, with 65% of patients referred for appropriate treatment [10] (Figure 1).
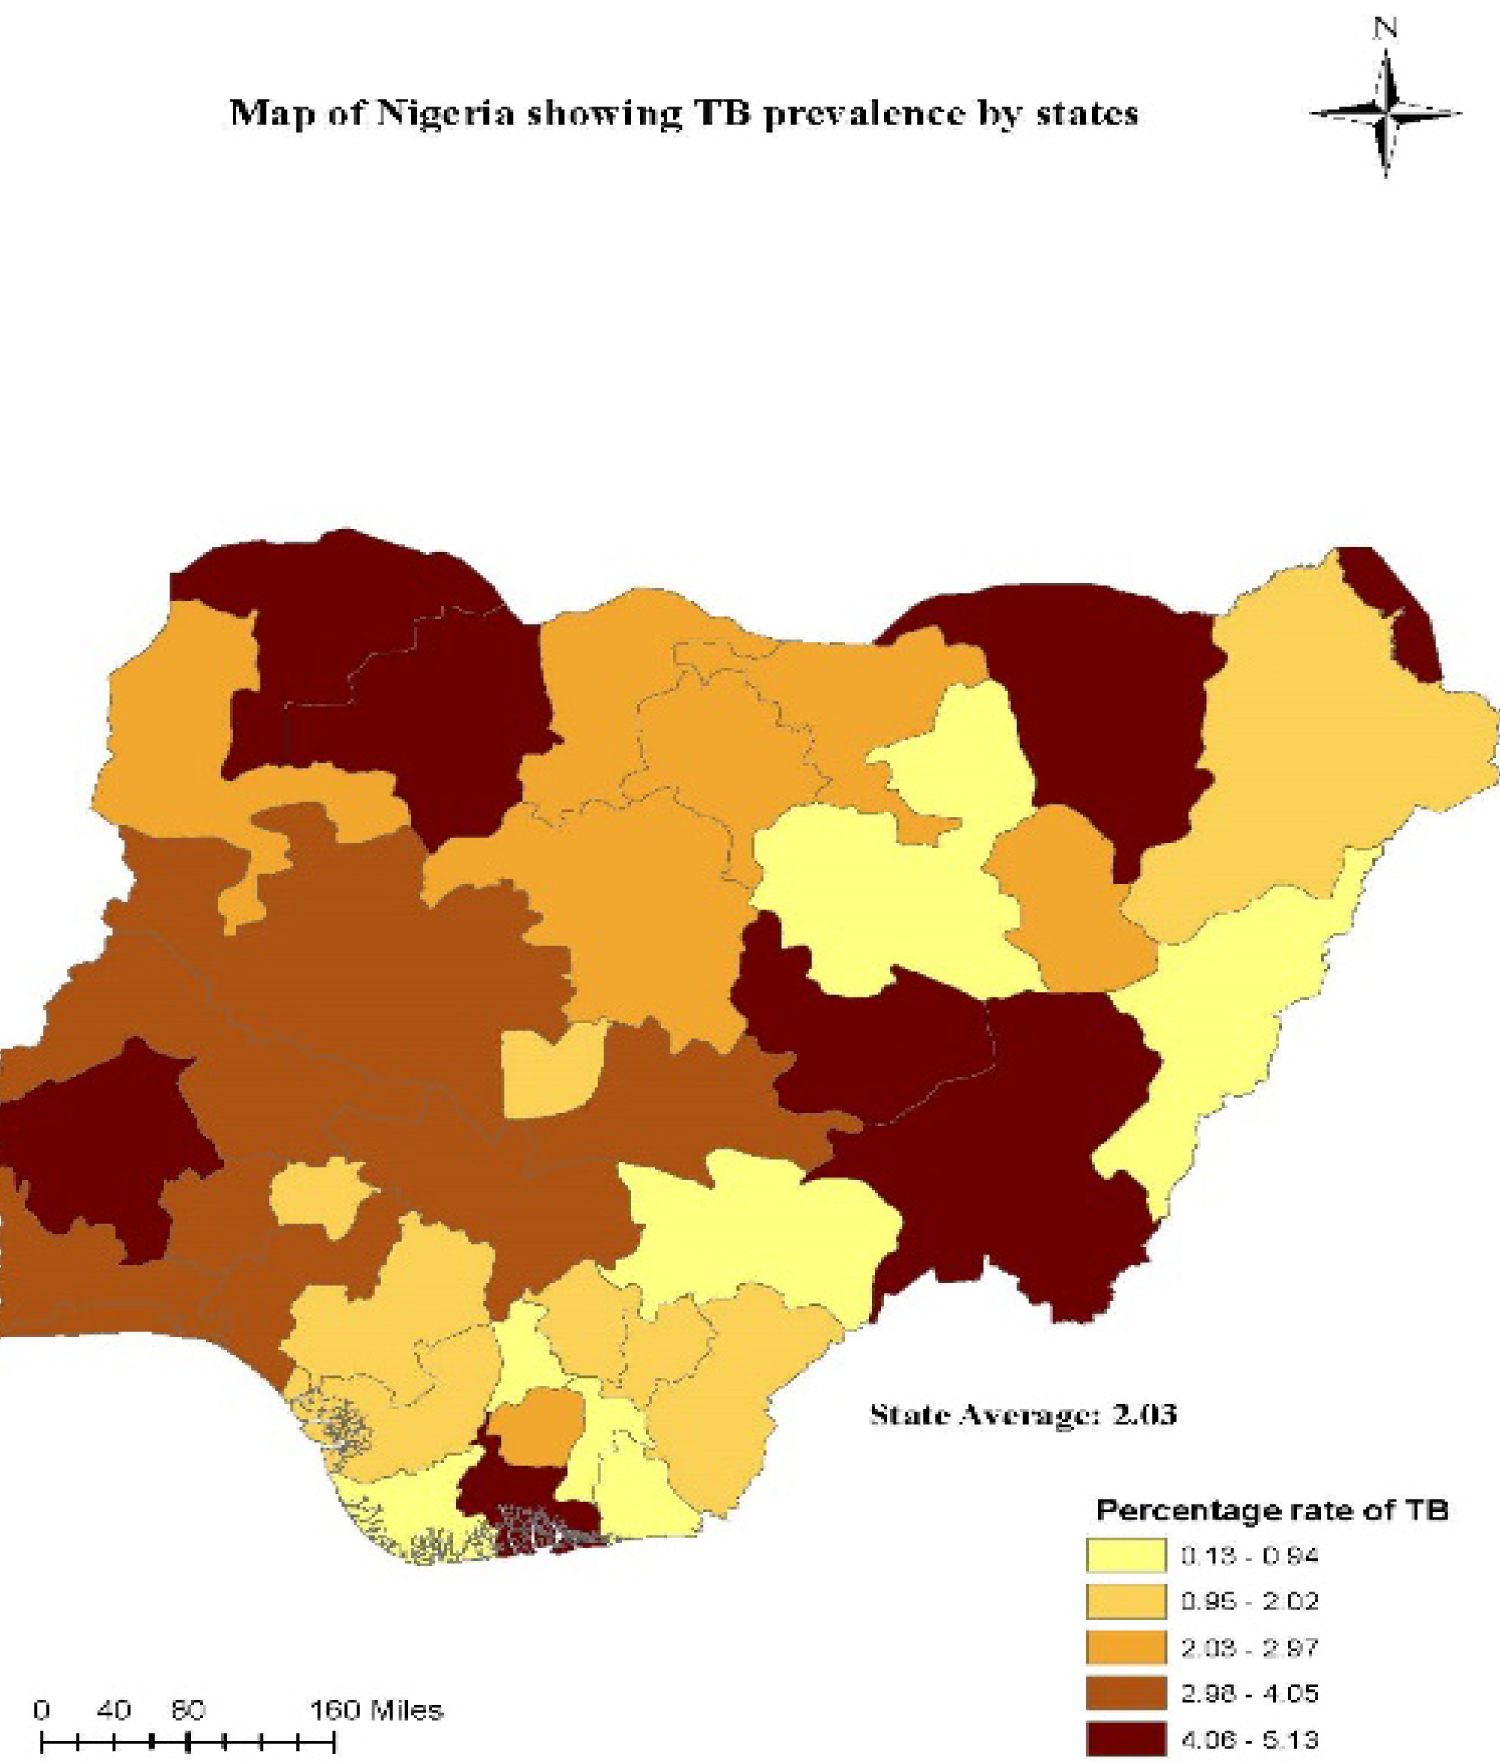 Figure 1: Tuberculosis Prevalence in Nigeria, 2015 [6].
View Figure 1
Figure 1: Tuberculosis Prevalence in Nigeria, 2015 [6].
View Figure 1
In Ghana, the implementation of the WHO DOTS strategy commenced in 1994, and by 2005, TB services had been integrated 100% into the national primary health care program [7]. The strategy heralded the reduction of TB/HIV co-infection by 14.7%, with improvements in case notification from 50% to 84% in 2012, including the provision of TB services to over 1600 health facilities in the country. Despite these laudable efforts in the expansion of TB detection sites, early TB case notification remain a challenge in densely populated areas, to attain the global target of 10 people per 100,000 population TB incidence rate by 2035 [4]. This could increase case detection rate in both countries and reduce drug-resistant TB (DR-TB), which poses a major challenge to the End TB Strategy.
In Ghana, although the HIV prevalence in the general population is low, TB prevalence is high at 152 per 100,000 persons [11]. The average TB/HIV co-infection rate is 21% as at 2017, [12], which varies from 9.4% in the Upper East Region to 33.4% in the Eastern Region, as shown in Figure 2. The case detection rate is lower at 20.7% [13]. This leaves a huge gap and underscores the importance of an analysis of current intervention strategies.
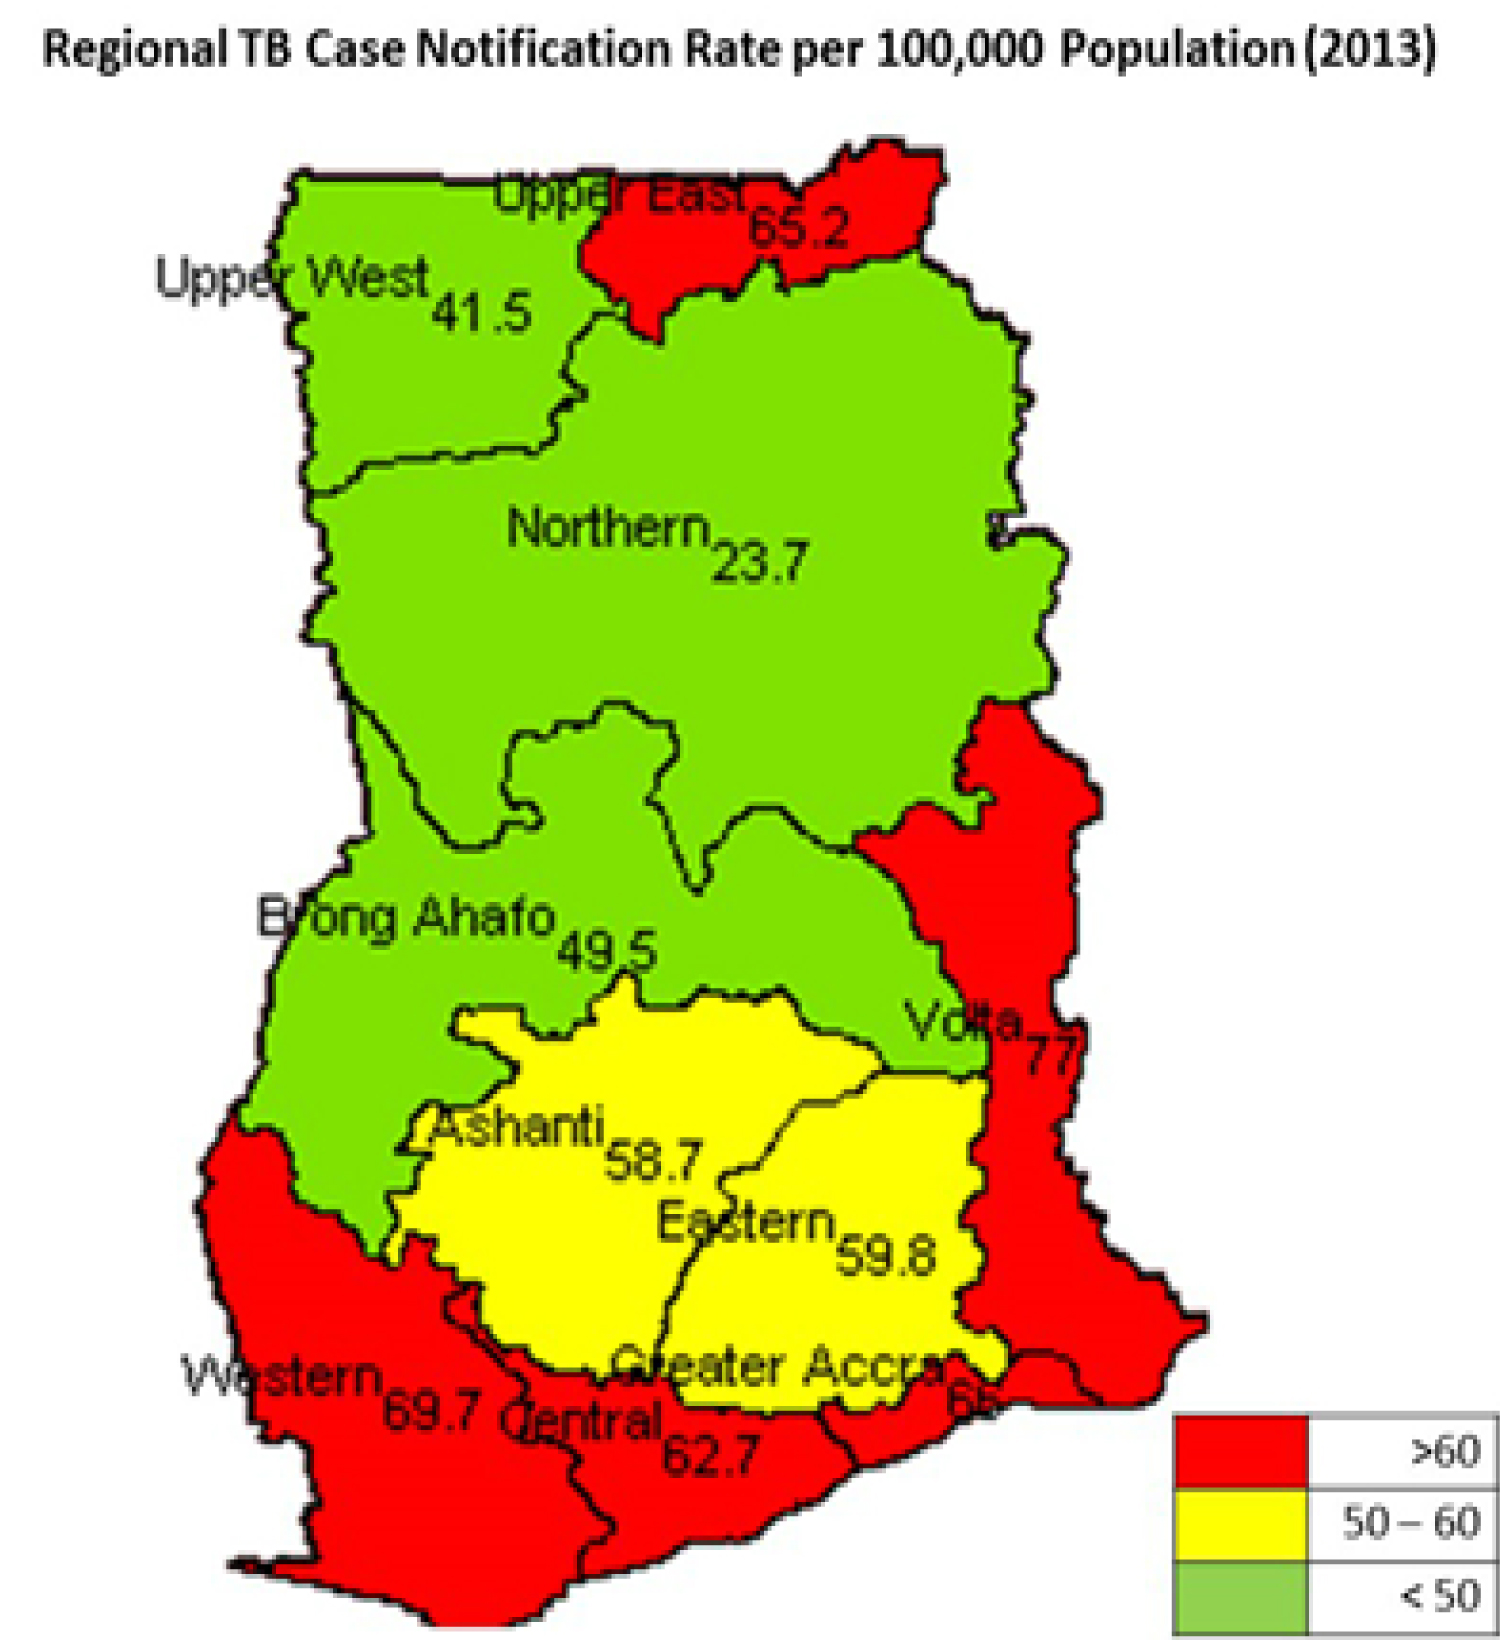 Figure 2: Regional Prevalence of Tuberculosis in Ghana [8].
View Figure 2
Figure 2: Regional Prevalence of Tuberculosis in Ghana [8].
View Figure 2
When co-infected with HIV, Diabetes Mellitus or similar infection, the epidemiology, control and management of TB cases becomes very complex. Lately, series of collaborative TB/HIV activities including testing, treatment and prevention were rolled out in many parts of the world. A recent report from the World Health Organization (WHO) including; End TB strategy, the STOP TB Partnership and the Global Fund fight against TB are some of the programs that have gained support globally for their effectiveness to end the disease by 2035, with over 1.3 million deaths prevented yearly as a result of these collaborations. These joint interventions have also shown to be crucial in reducing TB/HIV co-infection [14]. Although later reports from UNAIDS indicated a decline in the number of tuberculosis related deaths among people living with HIV [6], ART and TB treatment services are not provided to most affected regions for TB/HIV co-infected patients, especially in areas with the highest infection rates as evident in Figure1 and Figure 3. Notable among the latest TB eradication strategy globally is the introduction of the Gene Xpert machines - introduced by the WHO in 2013, to help halt the spread of this deadly disease [4].
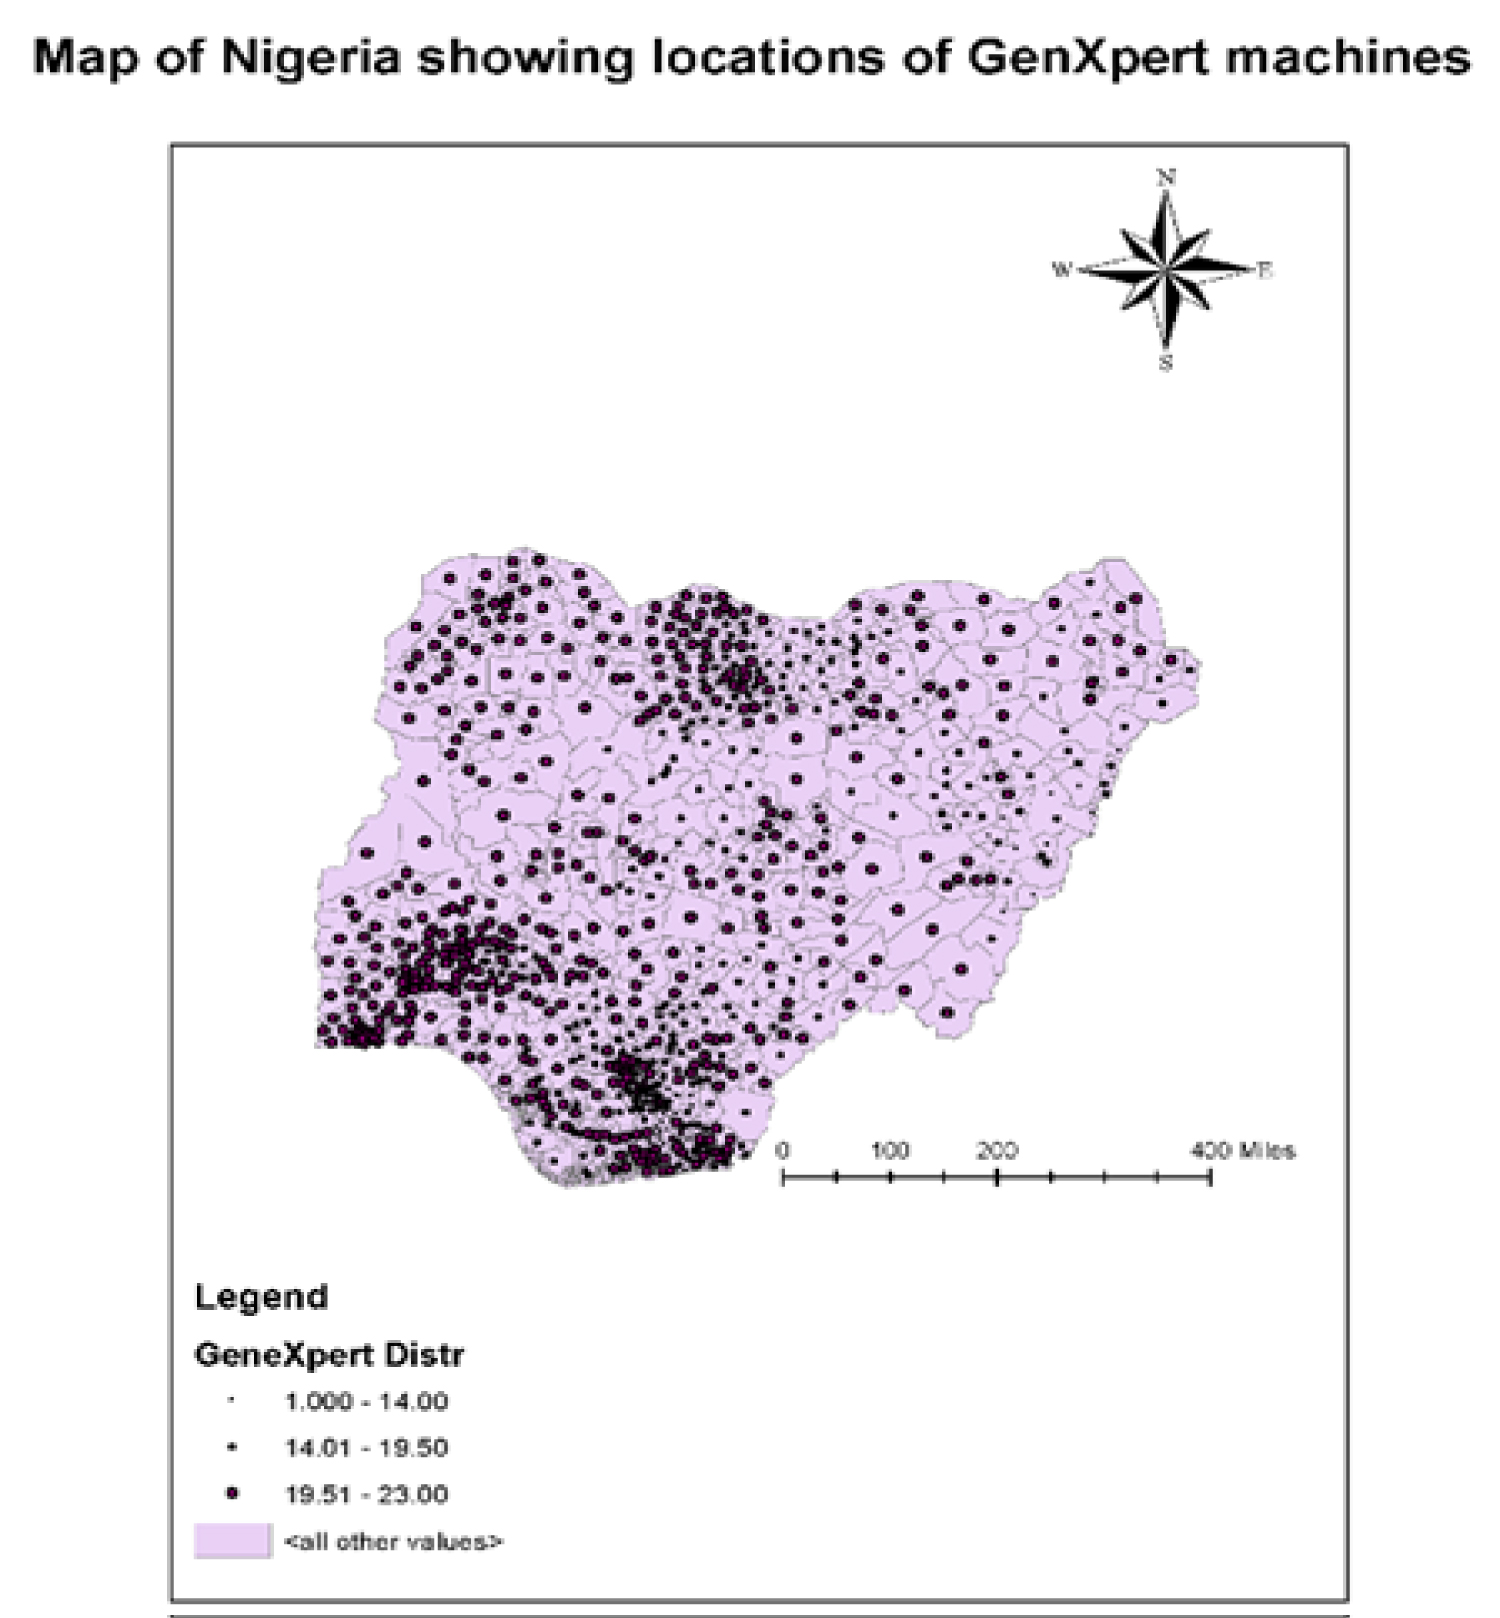 Figure 3: Geographical distribution of TB intervention centers in Nigeria.
View Figure 3
Figure 3: Geographical distribution of TB intervention centers in Nigeria.
View Figure 3
The Gene Xpert machine (Xpert MTB/RIF Assay) is a revolutionizing TB testing tool that helps to diagnose Mycobacterium tuberculosis complex and rifampicin resistance in a single reaction rapidly [15]. Using these machines, new TB cases are detected in less than 2 hours of testing compared to 2-6 weeks duration when cases are tested in the laboratory [16]. This facilitates early diagnosis and commencement of treatment. Furthermore, the introduction of the Xpert machine is documented to have reduced TB/HIV co-infection in 21 countries in 2015, from recorded cure rates of 48% to 68% including providing better treatment regimes for infected patients [17]. Although there are reports of a breakdown of the Gene Xpert machines as a result of technicalities in operations, the benefit to be derived from the machines far outweighs the equipment cost. Moreover, individuals who are tested and found to be free of the disease are removed quickly from unnecessary treatment regimes, further reducing cost to both the health providers and the patients.
According to a UNAIDS report (2018), less than half of TB patients were not evaluated for the disease before the onset of HIV, during the reporting period. This gap in the fight against TB/HIV co-infection underscores the importance of a more effective strategy in program design that considers the peculiarities of the different regions when planning TB/HIV intervention programs, especially for low- and medium-income countries of sub-Saharan Africa. It is therefore imperative to comprehensively analyze current intervention strategies, available reports and model possible intervention schemes, with a view to proposing more effective strategies.
Hence, this study aims to analyze the spatial distribution of HIV and TB co-infection prevalence in West Africa, using two countries (Ghana and Nigeria). We look at prevalence rates and the distribution of existing interventions and the relative outcomes over the years. We also develop models to evaluate various treatment strategies.
Mathematical and agent-based models have proven to be useful in investigating disease dynamics and assessing treatment strategies for specific groups and general populations [18-21]. Agent-Based Modelling (ABM) is a bottom-up approach of modeling, which has gained popularity in recent years, as a tool for providing insights into complex systems, policies, and solutions. An ABM allows the simulation of the dynamics of a population by controlling the characteristics and behavior of each individual or micro components of a system. The study of TB/HIV co-infection, using joint models is mathematically challenging. This is because these diseases have distinct dynamics and infection attributes. There are many single disease models that focus on either TB dynamics [22] or HIV transmission system. Some models have been developed to study TB infections and its interactions with individuals living with HIV, though. Kumar, et al. developed a model to compute the variations of the reproduction number R0 of TB and HIV only situations and compared this to an epidemic setting of co-infection [23]. The population-based model compared changes in the number of new infections, TB-related deaths for PLHIV, with changes in R0, due to treatment. Awoke, et al. [22] studied behavioral pattern of infected individuals and developed models to compare prevention and control strategies in the analysis of TB/HIV co-infection.
However, very few attempts have been made at developing combined models to study the dynamics of co-infection of TB and HIV. Most of these joint models use complex fourth-order differential equations to calculate the equilibrium state of the joint R0. Castilo Chaves, et al. at [24], developed a model, involving separate classes of transmission sub-models. This model targets the general population and assumes that co-infected individuals are in acute TB stages. This implies that patients are sexually inactive, and therefore were not considered in the transmission chain of the model. We, therefore, present a joint simplified model for evaluating interventions.
Two major approaches are employed in this study. In the first method, we analyzed available data on current interventions for preventing or mitigating effects of TB-HIV co-infection in West Africa. Geo-spatial distributions of the programmatic interventions, including provisions of Gene-Xpert machines, an increase in testing and availability of treatment centers, as reported by the implementing agencies [8,25] were considered. The results of these interventions, as depicted by varying rates of co-infections from the regions, within the last five years were also analyzed. The rate of co-infections and number of individuals on both antiretroviral treatment and the directly observed, short course (DOTS) TB treatment, either concurrent or subsequential commencement of treatment was considered.
The second approach involves developing a model to project programming outcomes, using different intervention scenarios within the next cycle of programs, depicted by modeling ticks in weeks. Modeling real-life situations allow researchers to comprehensively study an otherwise complex set of events, environment or populations and their interaction with causative agent factors. In epidemiology, biology, computer science and other public health-related fields, modeling and simulations are becoming a widely-used central research tool [26,27]. Agent-based models, with spatio-computational components, have strong predictive power and are able to leverage spatial and temporal dynamics. They are used to assess the effects of introducing autonomous agents, such as public health interventions into a system [28].
Secondary analysis of available data from some regions of West Africa was the target. Due to paucity of data documentation, available data on HIV and TB co-infection rate from only two countries: Nigeria and Ghana was used. Current intervention programs was also collected and juxtaposed against prevalence rate in those regions. ART treatment, testing and counselling are also offered at these facilities.
To study how variations in treatment strategies affect dynamics and outcomes, we developed an agent-based model, based on modified versions of virus and HIV models of Netlogo [29]. Our model uses a mathematical framework, adapted from a TB-HIV/AIDS Co-infection model proposed by [30]. Individuals in the latent state of TB infection are ignored in our model, due to the insignificant contribution of this sub-model to the entire transmission chain. In our model, the population is grouped into six sections: active-TB infected individuals, who are infectious (T1), individuals who just recovered from active TB infection (TR), individuals living with HIV who have no symptoms of AIDS (H1), individuals who are co-infected with HIV and active TB, with no symptoms of AIDS, but infectious (TH1), coinfected individuals who recovered from TB and having no clinical AIDS symptom (THR), and coinfected individuals with active TB and AIDS symptoms (AT). This is in addition to susceptible individuals from the general populations (SN). For this modelling purposes, we assume individuals between ages 15 and 54 are sexually active and highly susceptible to HIV infection [11].
Table 1 shows model parameters and represents the variables in the equations. Most of the values were obtained from available literature on HIV/TB prevalence, treatment and care services in Nigeria and Ghana [8,31-33]. These equations were to calculate number of individuals in each sub-population. We further developed models to project the prevalence rate of these twin diseases in future, in relation to ongoing intervention programs. To model current interventions for HIV/TB co-infections in specified geographical locations in West Africa.
The model was initialized with 1660 agents, which is a representative of combined current estimate of sexually active population of Nigeria and Ghana: 116.5 million [34]. A schematic diagram of the model interactions is presented in Figure 4. The equations are given below:
Where susceptible individuals' force of infection for TB, is given by:
And the force of infection for HIV is given by
Sliders were used to vary parameter values before each simulation. Switches and choosers, corresponding to different intervention strategies on treatment were created. Simulations were run on different scenarios. In the first scenario, TB treatment was switched off and rate of new infections recorded. The next scenario is where TB treatment doses were not completed. We also looked at single treatment scenarios.
In the model, all agents move randomly through the environment, and interact with other agents. Infections occur when a red, lime or gray agent comes in contact with a green agent. Actions of an agent may be: To move, to infect, to get sick, to start treatment, to abandon or finish treatment, to recover, and to die. Some of the actions take place daily for all the individuals in the system. The population of the model is assumed to remain unchanged within any simulation period. At the end of each time tick, global variables are updated according to behavioral pattern of all agents' group (model classes).
The flow diagram, subprocess and sub models are shown in Figure 4, adapted from [10]. Some actions can only happen if some conditions are fulfilled. Details of the sub-models, occurring during the infection and treatment stages are as shown in Figure 4. The probability of infection, decreases with time, but is drastically heightened with an HIV co-infection, as expected.
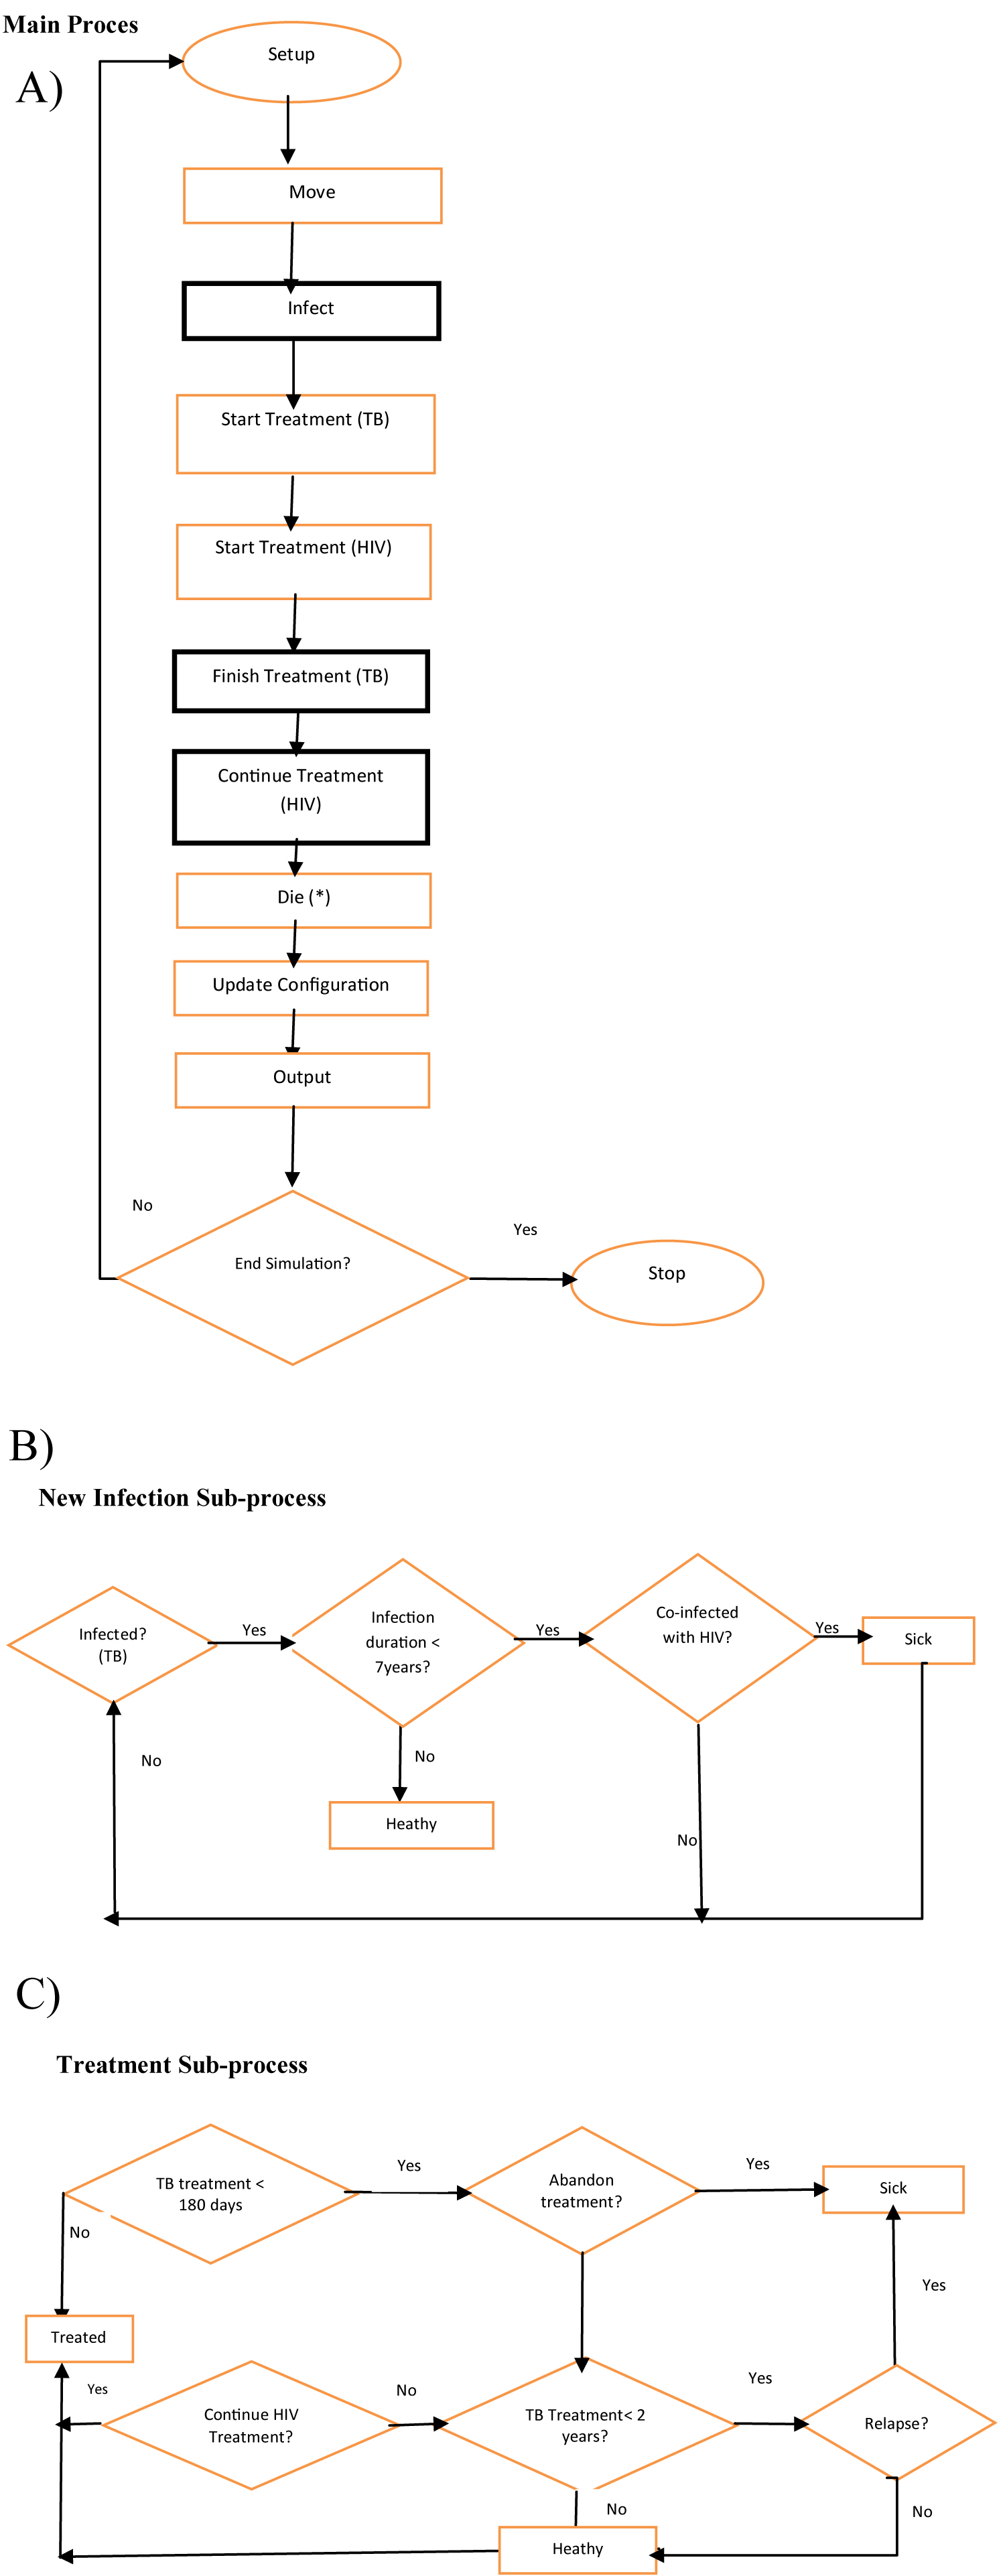 Figure 4: Model flow Diagram, including sub-processes [11].
View Figure 4
Figure 4: Model flow Diagram, including sub-processes [11].
View Figure 4
A person infected with latent TB for more than 2 years, who is co-infected with HIV and not on treatment is expected to progress to the sickness stage in the model. The treatment details (as model parameters) are considered during the Finish or Continue Treatment stages. A TB infected individual may not develop active TB or become sick. Only about 10% of latent TB infection progresses to active TB. An infected person remains in a latent stage for an extended period of time and the probability of developing the active stage decreases with time [35]. However, only infected agents can move and infect other agents, and are considered. A sensitivity analysis was carried out by comparing average output of multiple runs with reported data from Nigeria and Ghana.
A central entity in our model is an agent, which represents a person. Each person can belong to one of the six states of our model at a time and may move to a different state. An individual in the susceptible group is considered to be in a healthy state. Hence, individual parameters of our model do not apply to this group. A susceptible person acquires model parameters once the individual enters the infection cycle. An infected person may develop active TB within a period of 5 years, subject to annual probability that decreases over time. Setting the infection slider to zero represents this scenario. The infectiousness slider is also set to zero to obtain agents that have completed the TB treatment and have not relapsed. These parameters are outlined in Table 1. Other model parameters are estimated, and public health programming interventions are represented by varying these figures.
Table 1: Model Parameters and Variables. View Table 1
• All active TB-infected individuals are susceptible to HIV infection
• All co-infected individuals are sexually active and can transmit HIV
• Recovered Active TB-infected individuals may relapse as immunity wanes after 2 year
Various scenarios, involving different HIV and TB treatment combinations, obtained by varying the model parameters, are simulated. In each of these scenarios, the number of individuals on the model classes (AT, THR, THI, TR and TI) varies with each tick. In the first scenario, TB treatment completion button is switched on. Infected agents are on TB treatment, but the required cycles are not being completed.
The number of co-infected agents (THI) recorded a peak rise and then stabilizes. A slight but sustained increase is recorded on the number of new cases. When a TB single treatment option is switched on, and all other options are constant, the co-infection rate is considerably higher (Figure 5). A similar gradual rise in the number of co-infected agents results from single HIV treatment option. Exported values of different simulation runs are plotted and shown in Figure 6. Slight differences exist amongst the three scenarios of TB single treatment, HIV-single treatment and Dual-treatment options. Percentage of co-infected agents is slightly lower in dual treatment options, compared to the single treatment options.
 Figure 5: Model Interface.
View Figure 5
Figure 5: Model Interface.
View Figure 5
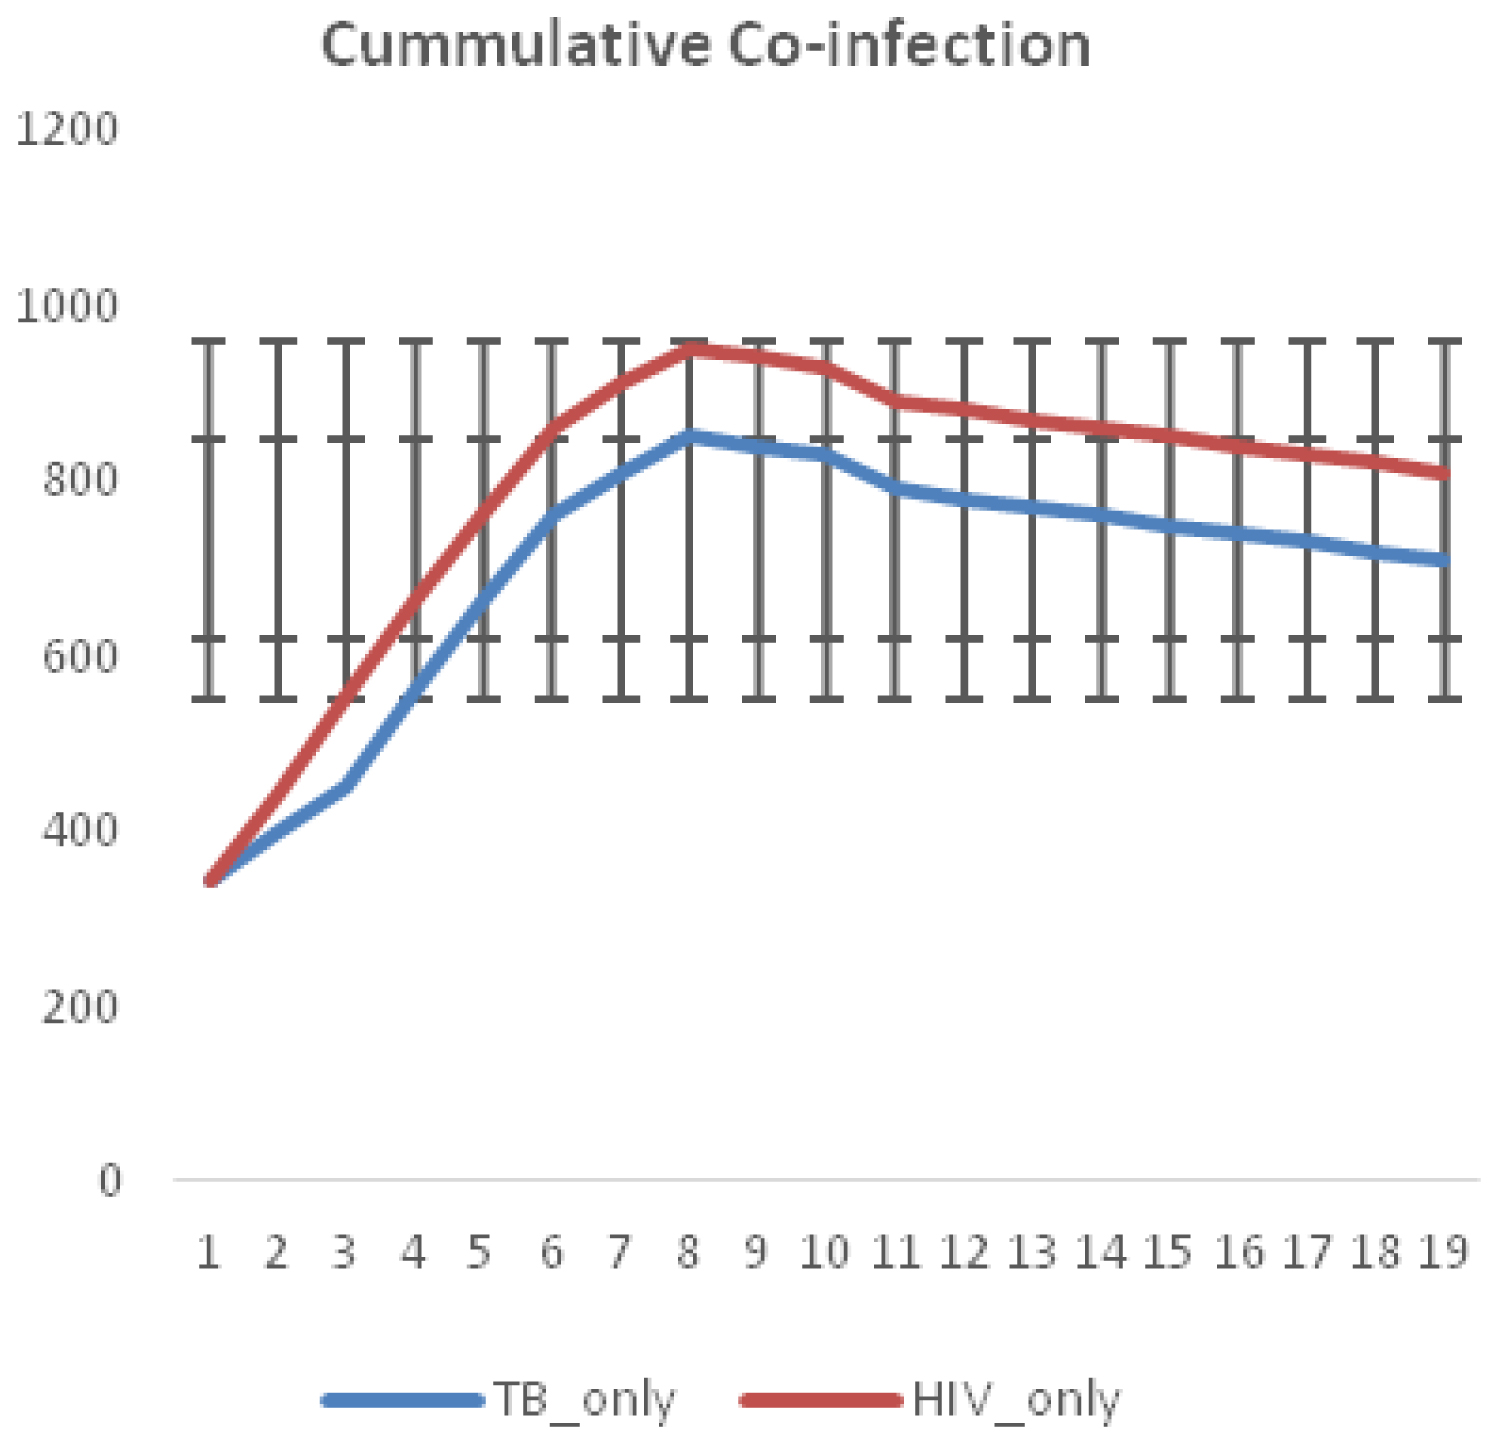 Figure 6: Effects of Single Treatment option on co-infection rate.
View Figure 6
Figure 6: Effects of Single Treatment option on co-infection rate.
View Figure 6
As shown in Figure 7. Non-completion of TB treatment results in far higher number of co-infection cases. There is a sustained and considerable increase in the number of new cases, when treatment completion rate is set to a very low value. From Figure 8, we can therefore deduce that TB treatment completion is far more effective in controlling new cases of co-infection than HIV-only treatment option. TB infections bounces back in this case and multidrug resistant (MDR) strains may develop. The number of new cases are relatively stable initially, but gradually goes up.
 Figure 7: Effects of Non-completion of TB treatment on co-infection rates.
View Figure 7
Figure 7: Effects of Non-completion of TB treatment on co-infection rates.
View Figure 7
 Figure 8: Effects of Dual Treatment option on co-infection rate.
View Figure 8
Figure 8: Effects of Dual Treatment option on co-infection rate.
View Figure 8
The second scenario involves TB treatment only. It is assumed infected agents are not receiving HIV treatment. They may not have been tested and are not aware of their HIV status. The third scenario is for individuals receiving HIV treatment only. As shown in the WHO Nigerian report [25], the prevalence in some Northern states ranges from 3.4 to 7.4. In some states, such as Kano and Lagos, the incidence ratio to the population is still high at 1:100,000. Despite increased interventions and outreaches aimed at preventing co-infection rate, these ratios are still high. This is an indication of low coverage of the population. Due to high population growth rate and poor sanitary conditions, more targeted interventions are needed. Overall, the Gene Xpert machine has been documented as an effective method for case detection, treatment and prevention. In Nigeria for instance, 96 Gene Xpert machines were distributed to the 36 states in 2013, and by 2018, a total of 391 Gene Xpert machines were available in the states. It is hoped that if government funding for TB and HIV programs are sustained, (current domestic funding support is at 9%), and the Xpert machines are at optimal performance, TB case notifications by states should increase, thus reducing the challenge of undetected cases. Figure 5, shows a chart of the distribution of Xpert machines and the number of total case notifications by regions. Four states in the northeastern part of the country, (Benue, Taraba, Adamawa and Plateau states and one state in the northwestern region (Sokoto state), had a total case notification between (65-89) cases, with a total of 31 Xpert machines installed; Two states in the north central zone (FCT and Nassarawa) and one state in the south west zone (Oyo state), had total case notifications of above 90 cases, with 43 Xpert machines installed; The remaining 27 states of the four regions in the country had total case notifications of between (25-64) cases; and finally, two states, one in the south west (Ekiti) the other in the south east (Imo) had total case notifications less than 25 cases. A Comparison of the total case notifications by the distribution of Xpert machines indicate there is an association between the number of Xpert machine and the total number of cases detected, the machines are noticed to be distributed in the South-western and North-western regions in Nigeria, whereas, TB is seen to be mostly prevalent in the North-Central and North-Eastern regions of the country. Effective use and deployment of Gene Xpert machines in these areas has the potential to rapidly detect new cases, with accurate diagnosis and treatment of infected patients.
Valuable inferences for efficient decision making, during program planning can be drawn from this study. Directly Observed therapy short course (DOTS) is an established means of ensuring adherence and completion of TB treatment. Analysis of locations of Gene-Xpert machines in Nigeria indicates unequitable citing. Regions with higher cases of TB/HIV co-infection are having lesser number of machines. Its implementation should be strengthened, as compliance is key to curbing rising new infection rates. Locations of more Gene-Xpert machines should be cited closer to the people, with linkages to health centers in the hinterland.
The full model, with both HIV and TB, is simulated to evaluate the impact of the various treatment strategies. It is shown that the TB-only treatment strategy averted more cases of mixed infections than the HIV-only strategy. However, the dual treatment strategy saves higher number of cases (of HIV, TB, and the mixed infection) in comparison to the other strategies. Thus, this study shows that if resources are limited, establishing centers, where same resources (financial, personnel and structural) are used for treating both diseases is more beneficial in reducing new cases of the mixed infection.
Authors have declared no conflict of interest. Specific ethical approval was not required for this study.