For decades, it has been a big challenge to directly and accurately measure an irregularly shaped area for a tumor volume evaluation of prostate cancer. All current methods are not ideal for different reasons. An objective, practical, accurate, and reliable method for measuring of prostate cancer volume is needed, in particular in modern precision medicine setting, pursuing accuracy and quality of health care.
In this study, we applied a mathematical method - the Gauss area calculation formula to the evaluation of irregular shape of prostate cancer areas on H&E slides. To simplify the calculations, we used JavaScript program to achieve that practical easiness.
By using this mathematical method, we were able to easily obtain the accurate tumor volume percentage, which has never been so objective, accurate, and practical before. The method can be easily applied using scanned H&E pathological slides - including surgical slides, fine needle aspirate (FNA) slides, and even digitally scanned pictures, particularly when there are separate areas of interest on one slide.
To our knowledge, this is the first reported practical solution of this methodological problem. In this project, with a mathematical method as the principle, we developed a JavaScript program to simplify the calculation so the pathologists can easily apply it to obtain an objective and accurate information for the tumor volume of prostate cancer.
Prostate cancer, Tumor volume, Mathematical method, Gauss's area calculation formula
Prostate cancer is the second leading cause of cancer death in American men, behind lung cancer. The American Cancer Society's estimates about 174,650 new diagnoses and about 31,620 deaths from prostate cancer in the United States for 2019 [1]. There are two most significant factors which affect patients' prognosis: "quantity" and "quality". The "quantity" means the tumor volume. Tumor volume shares something in common with staging but with some differences. By the current College of American Pathologists (CAP) prostate cancer protocol, stage 2 prostate cancer is defined as organ confined. This is a very broad category, with tumor volume that may range from 0.1% through 99.9%, as long as the tumor is still confined within the prostate gland. Under this criteria, patients at the same stage but with different tumor volume may have different prognosis [2]. This is particularly true if the tumor volume is large enough to extend to other tissue or organs. On the other hand, even with the same Gleason score, grade group, histological type, and staging, the management of patient with only 1% of tumor volume should not be the same as the one with 99% of tumor volume. Secondly, the "quality", meaning the tumor Gleason score, grade group, and even histology type. All these factors are important information for patient management [3,4] and prognosis [5,6]. This is why the pathologists are required to report the Gleason score, grade group, and percentage of higher pattern (4 or 5) in detail [2] (see Table 1) in the pathological report.
Table 1: The Current CAP protocol for prostate cancer grading and Gleason score standard. View Table 1
The most recent CAP explanatory notes (posted in August 2019) mentioned that studies have shown prostate cancer volume is a prognostic factor, although the current data are conflicting as to its independent prognostic significance. There are many methods of estimating the amount of tumor in pathology prostrate specimens [7-9]. Some reports even mentioned tumor volume can be "eyeballed" by simple visual inspection [10] or it "may be possible" to measure with at least 2 dimensions [11]. Obviously all these methods are highly inaccurate. Perera, et al. [12] compared the contemporary methods and concluded that a reliable good method is still needed.
According to the CAP statement, our basic question is if we were lack of an objective standard method showing accurate tumor volume, how could we compare the data with each other to reach the conclusion that data are conflicting or not? Based on common sense, it is almost absolutely true that prostate cancer volume is a prognostic factor if we simply go to the extremes by comparing 99% with 1% of tumor volume, even though by current CAP staging criteria, both volumes are stage 2, no matter what the Gleason score, grade group, or histology type is.
In order to find out if the differences are significant, for example between 1% versus 5% of tumor volume, we definitely need an accurate tumor volume measurement. We present here a method which allows to easily and accurately measure the tumor volume percentage from the microscopic slides, using a mathematical principle and computerization of the complicated calculations into a JavaScript program. To our knowledge, this is the first reported method which can objectively and directly measure the real tumor volume. We believe this long-term methodological problem can now be marked with a "The end". The aspects for the potential clinical significance are also discussed.
The Gauss area formula, a mathematical method to calculate the area of an n-sided, non-self-intersecting polygon given the coordinates of its vertices, was employed to calculate the tumor area and tissue area separately and then to determine the percentage of tumor area(s) over tissue area.
To approximate areas of tumor and tissue, ordered points were plotted (counterclockwise or clockwise) along the perimeter of the tissue and tumor on an uploaded computer image (JPG, PNG, etc), and the area of resulting irregular polygons found by connecting them was calculated with Gauss' formula in a JavaScript program: For ordered points (x1,y1), (x2,y2), (x3,y3),…, (xn,yn). The mathematical formula is:
Image size and changing dimensions by stretching will not affect tumor area to tissue ratio. JavaScript program steps are as follows: see the Supplemental Data attached.
Based on the basic mathematical Gauss's area calculation formula as principle, we performed the underlying complicated calculation in a JavaScript program. We than built a simple software incorporating the whole process, to obtain the final tumor percentage. The software is available at the following website:
JavaScript program html:
https://area-of-shape-calculation.johnchen7.repl.co
To use it, first open the linkage in a window or mac page. And then follow the steps below:

1. Upload a histological H&E picture or any scanned slide;
. 2. Click the "Tissue" button and start dotting along the perimeter of the tissue; at the last dotting, click the "EndPath" button to close the area which you choose as tissue area;
3. Click the "Tumor" button and then dot around the perimeter of the tumor area; at the last dotting, click the "EndPath" button to close the area which choose as tumor area;
4. Click the "Result" button and then the percentage of tumor over tissue will be automatically reported out!
Now let's use a few examples to better understand how to easily use it:
Example 1:
1. Load the slide by clicking the "Choose File" button.
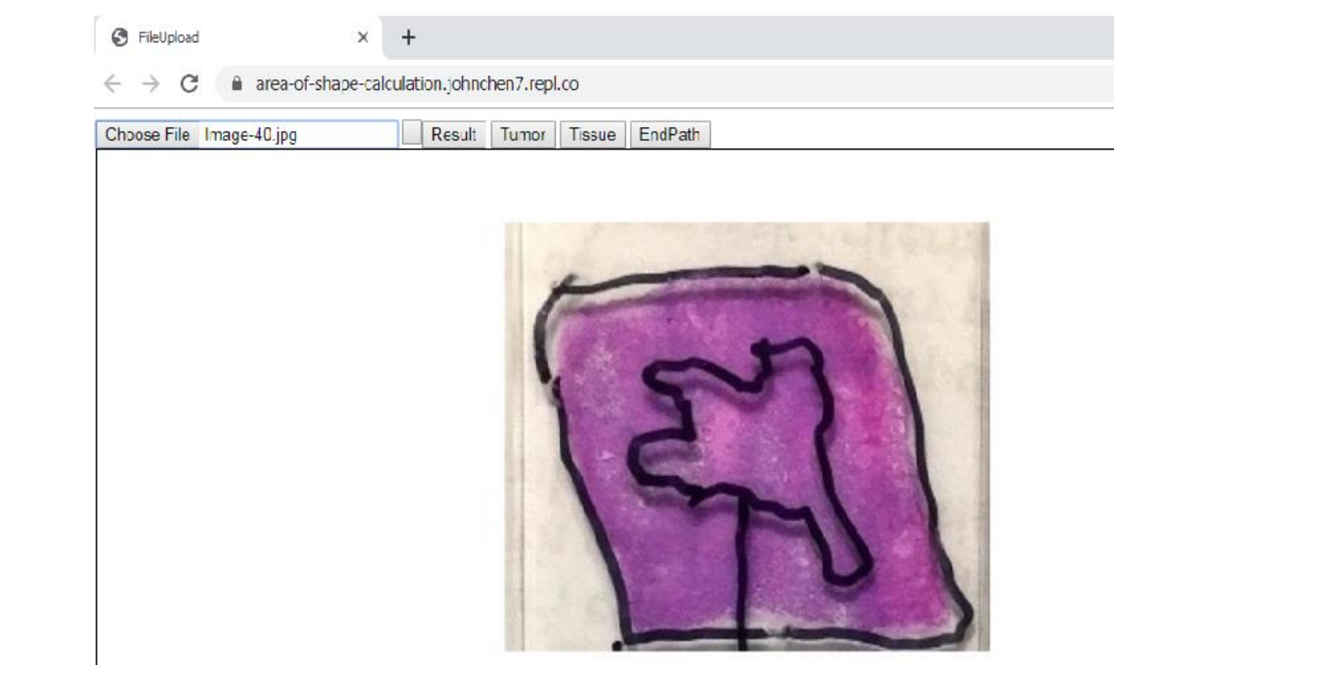
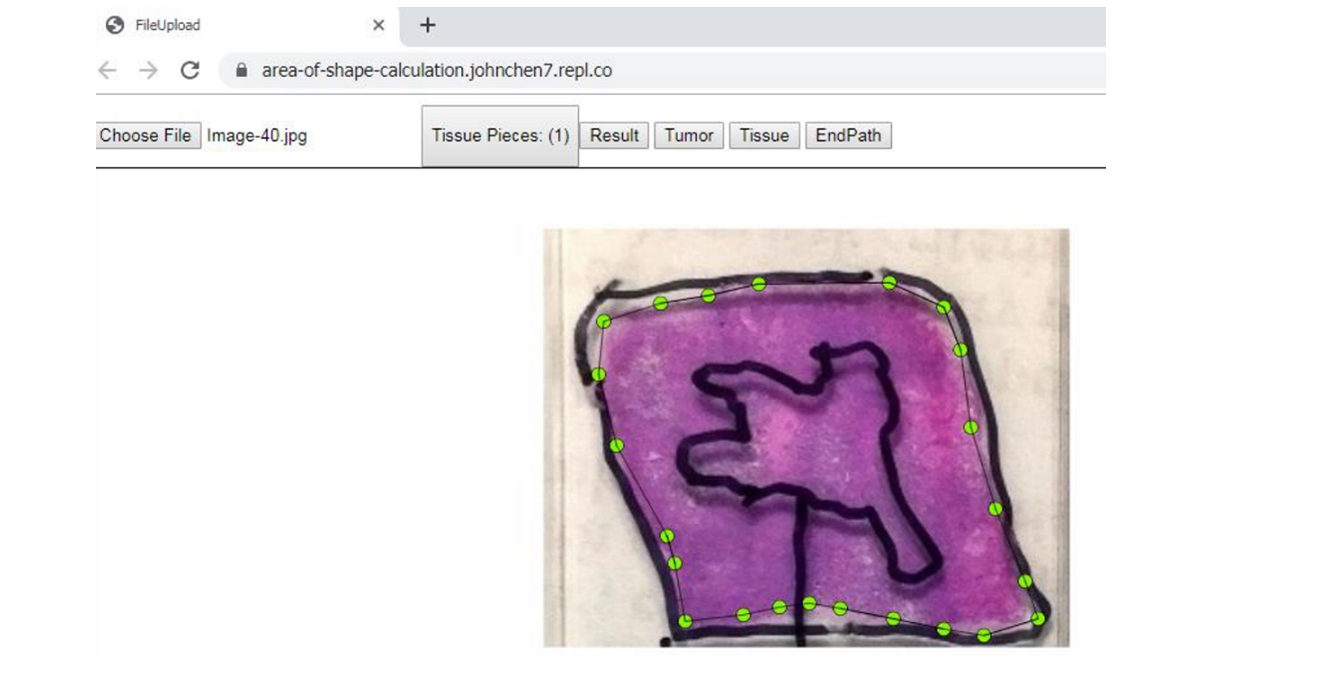
2. Click the "Tissue" button and then dot the tissue area along the perimeter of the tissue on slide; it does not matter wherever you start. Click the "EndPath" button to end the circling of the tissue area.
3. Click the "Tumor" button and then dot the tumor area along the perimeter of tumor area; click the "EndPath" button to end the circling of the tumor area.
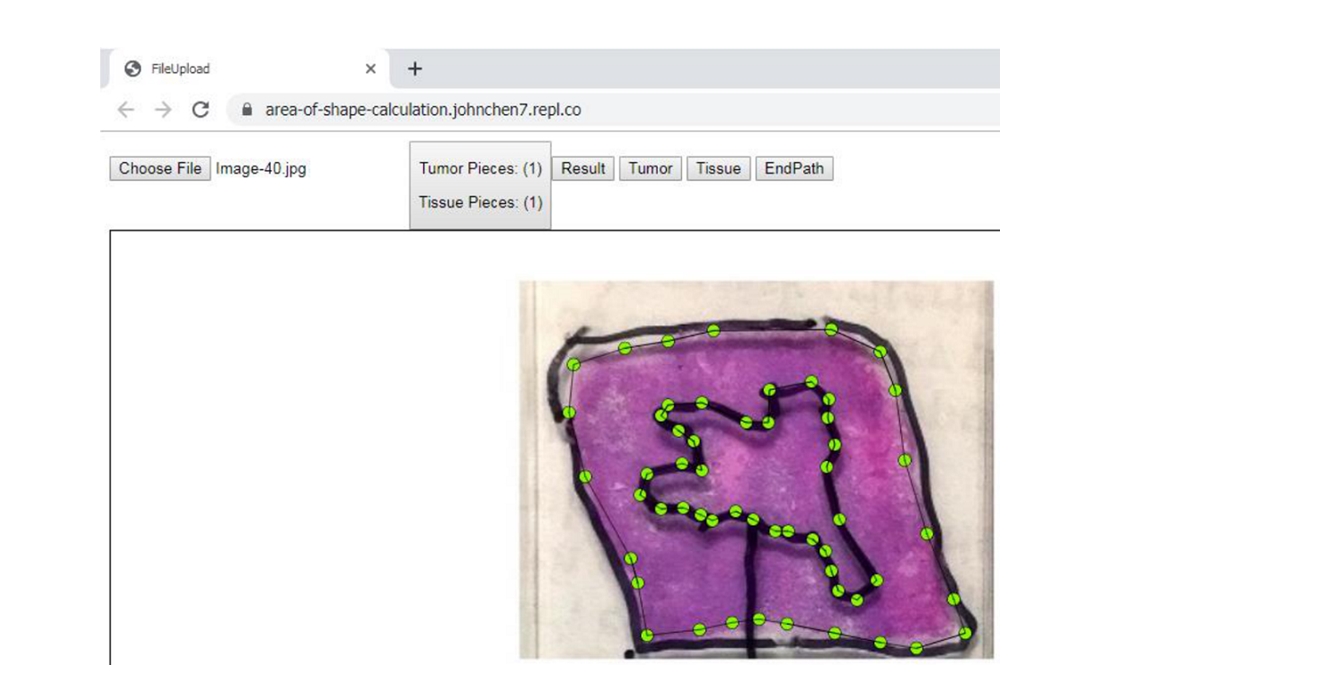
4. Click the "Result" button to get the accurate percentage of tumor area: 23.49%!

Example 2: Fine needle aspirate (FNA) slide: 12.99%!
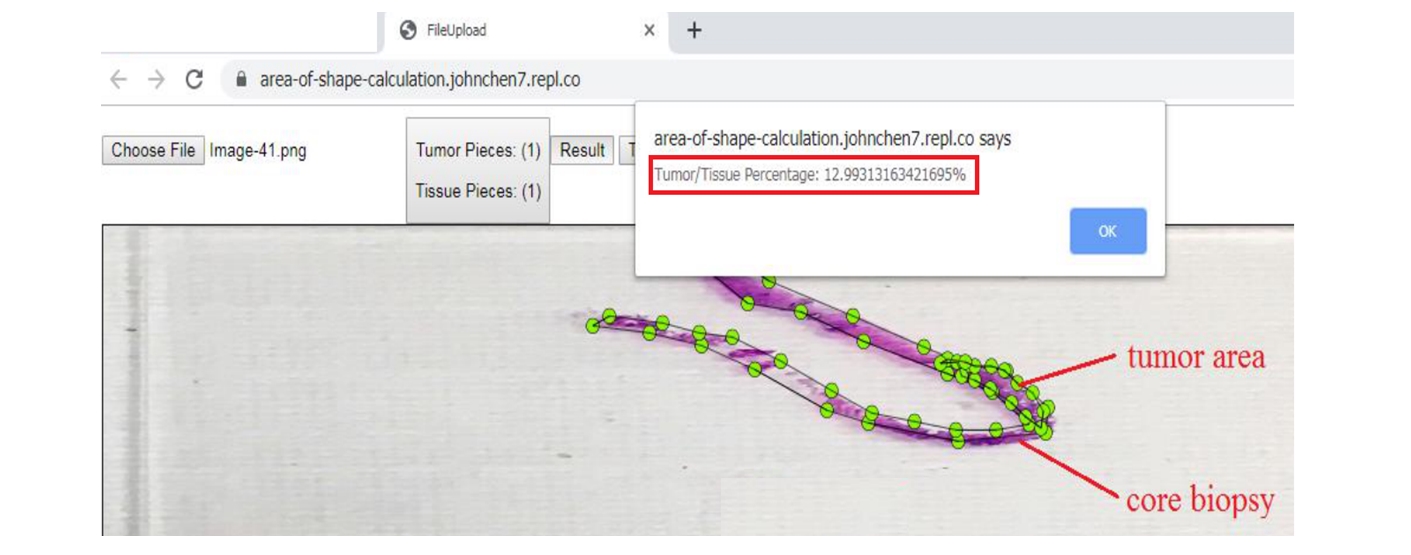
For this FNA slide, our result is 12.99%, which reflects not only the length of the tumor area, but also the actual width. In our daily practice, we usually only measure the length, by which strictly speaking it is not accurate since the tumor may be only partial width of the length. Hence our method is more accurate and the result objectively stands for the real tumor area.
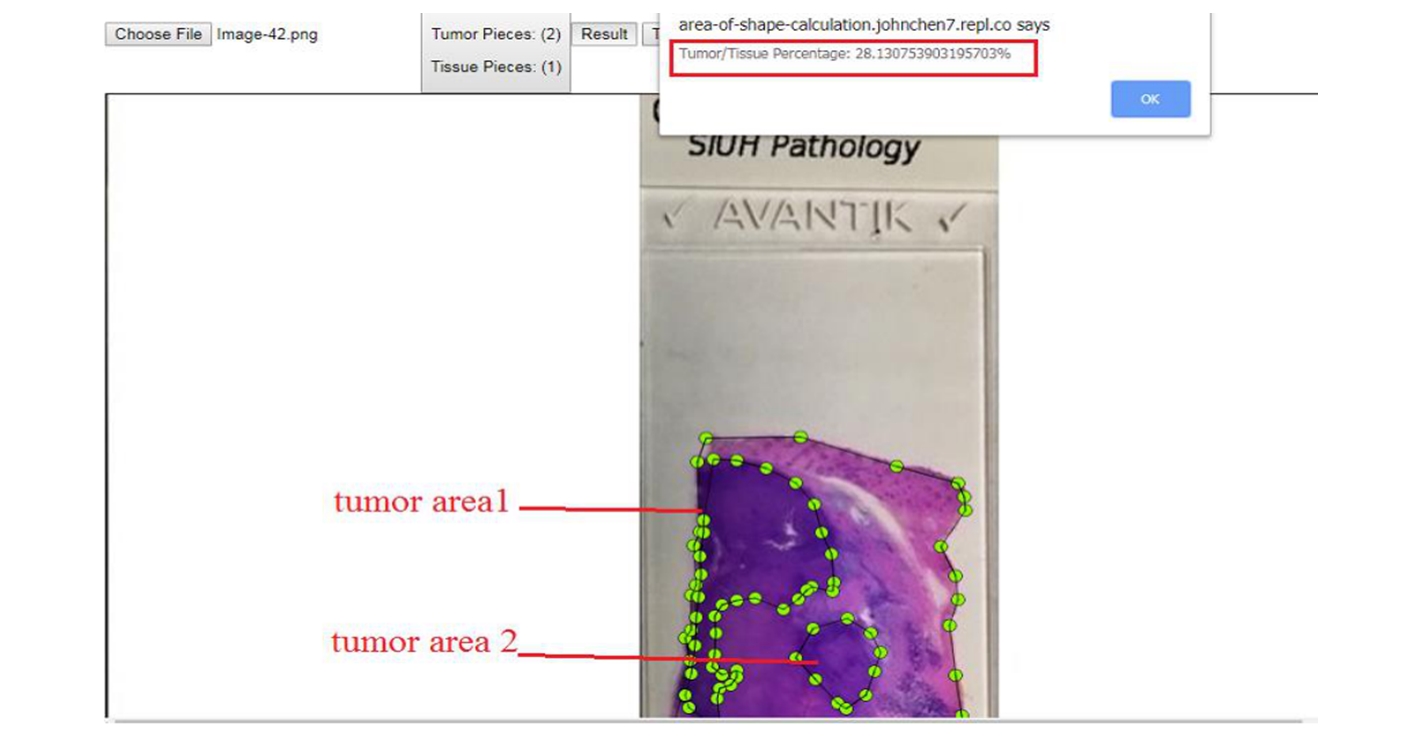
Example 3: If on one slide or picture there are more than one tumor areas, do not worry. This method still works well. Just click "Tumor" button again after finishing the first tumor area. This example includes two irregular tumor areas, with the total percentage 28.13%!
The determination of the tumor percentage based on distribution of the irregularly shaped prostate cancer area(s) in the microscopic slides has a potential clinical significance, with impact on management and prognosis. However, an accurate and practical method of tumor volume measurement has always been challenging, in particular in the prostate cancer which may often be multifocal, with irregularly shaped cancer foci. In the presented project, with a mathematical method as the principle, we developed a simple computerized JavaScript program to simplify the calculation to obtain an objective and accurate percentage of the tumor volume. To our knowledge this is the first paper to reach this practical level and solve this methodological problem. The more accurate results of tumor volume measurement may hopefully allow for reproducible stratification and sub-staging of prostate cancer patients, who are currently staged as pathologic stage 2.
With this method, for the first time, we can directly measure one or more irregularly shaped tumor area(s) on one microscopic slide. Due to limited research conditions, we did not directly incorporate our program into an automatic digital imaging system of the digitally scanned slides. We believe the accuracy will be further improved by directly dotting around the border of cancer areas on digital images. However, based on the same principle, with just a few simple steps, our method can be easily used to acquire objective and accurate tumor volume on a scanned slide or an H&E picture. Furthermore, this method can be also applied to any other solid tumor, whenever an accurate tumor volume/percentage are needed, in particular if multiple separate small tumor foci exist in the same area. Because of its simplicity and ease of application, this mathematical method is an ideal tool to deal with this challenging situation.
Another potential application of our method is for the reconstruction of a histological 3-D tumor image. The current 3-D radiology imaging technique can nicely show the 3-D picture of a prostate mass. However, imaging cannot replace histology. The 3-D mass on radiology imaging does not necessarily represent the size of an actual tumor that we are concerned about. Some parts of radiologically defined mass may contain benign prostatic hyperplasia (BPH) or be entirely benign. In other words, any suspected imaging has to be confirmed by histology examination, to evaluate the real volume or size of the tumor. Using the currently presented method, we can histologically confirm the cancer borders on serial sections of a prostate gland, with the accurate percentage information on all sections. This allows us to construct a whole 3-D picture of the distribution of the pathologically confirmed tumor in the prostate gland. In addition to Gleason score, grading group, histological type, and molecular information, the accurate data regarding the real size of cancer, its location, distances from margins and adjacent structures should provide clinically significant information for optimal management of individual prostate cancer patients. Future studies comparing the radiologic and pathologic 3-D images of the prostate cancers, may lead to development of management strategies without traumatic surgery.
The work was not supported by any commercial fund.
The corresponding author (jchen3@northwell.edu) on reasonable request can provide raw data of results and JavaScript Program.
John C. conceived the mathematical methods and made the JavaScript program; Jianli C. proposed the clinical question, John, Jianli, MW, and LO wrote the manuscript. All authors read and approved the final manuscript.
Not applicable.
None.