The progression of fibrosis in liver disease is the single most important pathologic process guiding patient prognosis and treatment decisions. Unfortunately, its histologic assessment is subjective, descriptive and non-quantitative. A more objective and uniform method is needed to assess fibrosis in order to optimize patient care. To that end, we employed two new quantitative imaging technologies to evaluate fibrosis.
49 non-fragmented liver core needle biopsies from patients with a variety of etiologies inciting injury, focusing on hepatitis C and steatohepatitis patients were evaluated histologically by three hepatopathologists generating a Fleiss kappa value of 0.59. Histologic scores were compared with two different quantitative technologies: 1) Aperio Technologies 2 scanner (Leica, Vista, CA) using a color deconvolution algorithm (ScanScope V9), and 2) Genesis®100 (Histoindex Pte Ltd, Singapore/Singapore) using two photon excitation microscopies with second harmonic generation.
Positive correlation was demonstrated between the average histologic scores and fibrosis percentages obtained by Aperio Technologies 2 digital scanner (r = 0.75), along with the two photon microscopy measures of total fibrosis percent (r = 0.59), aggregated fiber percentage (r = 0.58), total number of fibers (r = 0.62), and number of fiber cross-links (r = 0.52).
Only moderate interobserver agreement was demonstrated for histologic scoring, highlighting the need for a more objective fibrosis scoring system. Both quantitative imaging technologies examined reveal strong correlation to histologic scoring and therefore show great promise as a means to quantify fibrosis more objectively.
Two photon microscopy, Second harmonic generation, Liver fibrosis quantification
Viral infection, metabolic disorders, toxins, biliary and autoimmune disorders may result in liver fibrosis and progression to cirrhosis [1-4]. Hepatic stellate cells differentiate into activated myofibroblast-like cells in response to hepatic injury, which in turn secrete primary extracellular matrix to generate scar tissue [5]. Other cells involved in collagen deposition are portal myofibroblasts and vascular myofibroblasts [5]. Temporary scar or granulation tissue consists predominantly of collagen type III, which then is converted to type I collagen as the predominant form in well-established cirrhosis [6-8]. However, both collagens types I and III are increased in cirrhosis and both are evaluated histologically to assess the extent of fibrosis [7-9].
Clinically, core needle biopsies of the liver are assessed on H and E stain, but additional special stains are typically pursued to highlight the extracellular matrix, including Masson's trichrome, reticulin and Picrosirius red stain, which variably stain types I, III and IV collagens [10,11]. These special stains are utilized in clinical practice to assess the pattern and extent of fibrosis [12,13].
The histologic assessment of fibrosis is subjective and varies greatly depending on the experience of the pathologist and the quality of tissue sampling. Staging systems have been developed to decrease subjectivity in fibrosis stage, but they are inconsistently used in clinical practice. The Batts-Ludwig, Ishak, METAVIR, Knodell, and Scheuer scoring systems can be used to assess chronic hepatitis including viral hepatitis [13]. However, the progression of steatohepatitis exhibits differing fibrosis patterns relative to chronic hepatitis, and includes pericellular centrilobular fibrosis, which is part of Brunt's criteria [14]. Thus, for accurate staging, the etiology of the hepatic disease is required and only one etiology should be present, which is frequently not the case in liver disease [13,14]. Overall, no single universally accepted system for staging fibrosis exists, much less one to objectively quantify it. Pathologists have mostly decided to use descriptive terms such as portal, periportal, bridging and cirrhosis.
Despite these limitations, the gold standard for hepatic fibrosis remains histologic assessment. Emerging technologies such as 1) Whole slide digital imaging, and 2) Two photon excitation microscopy combined with second harmonic generation, may improve the assessment of fibrosis on glass slides [15-18]. We evaluated the ability of both technologies to provide objective and quantitative fibrosis measurements, regardless of etiology and in comparison, to histologic scoring systems. Digital whole slide imaging, available in many laboratories, uses a glass slide scanner to provide high quality images, followed by application of a deconvolution algorithm to assess the amount of fibrosis [19]. Two photon excitation microscopies combined with second harmonic generation is an innovative non-linear microscopy that highlights complex helical proteins such as collagen fibers in unstained tissue sections on glass slides [20]. It enables more precise imaging of collagen than light microscopy, hence providing more information regarding the pattern of collagen deposition. Additionally, computerized analysis of images obtained from two photon excitation microscopy has been developed to quantify individual collagen fibers and study their location and spatial orientation within the hepatic lobules [18,21]. This algorithm allows for quantifying total fibrosis percent, aggregated fiber percentage, total number of fibers, and number of fiber cross-links.
This study was approved by the University of Utah Institutional Review Board. Forty-nine non-fragmented liver core needle biopsies fixed in 10% buffered formalin and paraffin embedded were evaluated. Biopsies were obtained between 2012 and 2014 and were retrospectively selected from the University of Utah archives. Exclusion criteria included fragmentation of core needle biopsies, minute and inadequate core needle biopsies with less than 4 portal tracts, and unavailable special stains. Only the largest core biopsy on a given slide per patient was included for study. The H&E sections and the corresponding Masson's trichrome stains were assessed histologically by three hepatopathologists. At the time of review, the pathologists were blinded to disease etiology and the previously reported fibrosis stage. Descriptive fibrosis scores based on Batts-Ludwig and Brunt's staging systems were assigned [3,22]. A fibrosis score of 0 was assigned for a normal amount of collagen. A fibrosis score of 1 was assigned for minimal amounts of fibrosis, limited to still rounded portal triads (fibrous portal expansion) in chronic hepatitis cases or only zone 3 perisinusoidal/pericellular fibrosis in steatohepatitis cases. A fibrosis score of 2 was assigned when non-bridging fibrotic spikes (periportal fibrosis) emerged from portal tracts in chronic hepatitis cases or hepatic zone 3 centrilobular perisinusoidal/pericellular fibrosis was seen along with periportal fibrosis in steatohepatitis cases. A fibrosis score of 3 was assigned when bridging fibrosis between portal or central areas was observed. A fibrosis score of 4 was assigned to established cirrhosis with well-formed regenerative nodules of hepatocytes surrounded by fibrosis. Care was taken not to assign pathologic bridging fibrosis in subcapsular areas or in normal, longitudinally sectioned portal tracts with correspondingly elongated triad structures. Grading of the inflammatory process was not performed as it was not the objective of this study. Interobserver agreement between the hepatopathologists was assessed using Fleiss kappa statistics. Three sets of assigned scores were also evaluated using the chi-square test. The rounded average histologic score per case among all three pathologists were compared to percent fibrosis obtained by Aperio Technologies 2 scanner and the multiple quantitative values obtained by two photon excitation microscopies combined with second harmonic analysis.
The Masson's trichrome stains for all 49 cases were digitally scanned with an Aperio Technologies 2 scanner (Leica, Vista, CA) and assessed via software for a color deconvolution algorithm (ScanScope V9). This software separates the image into multiple channels, corresponding to the blue and red colors of the trichrome stain. The total stained area was also calculated by this method into square mm's, from which the actual area of collagen (blue stain) was calculated. The determined percent of fibrosis was assigned a numerical output by the algorithm as described previously by Teman, et al. [19]. In all cases, large or longitudinally sectioned portal triads with normally increased collagen and liver capsule areas were circled and manually excluded from this calculation (Figure 1).
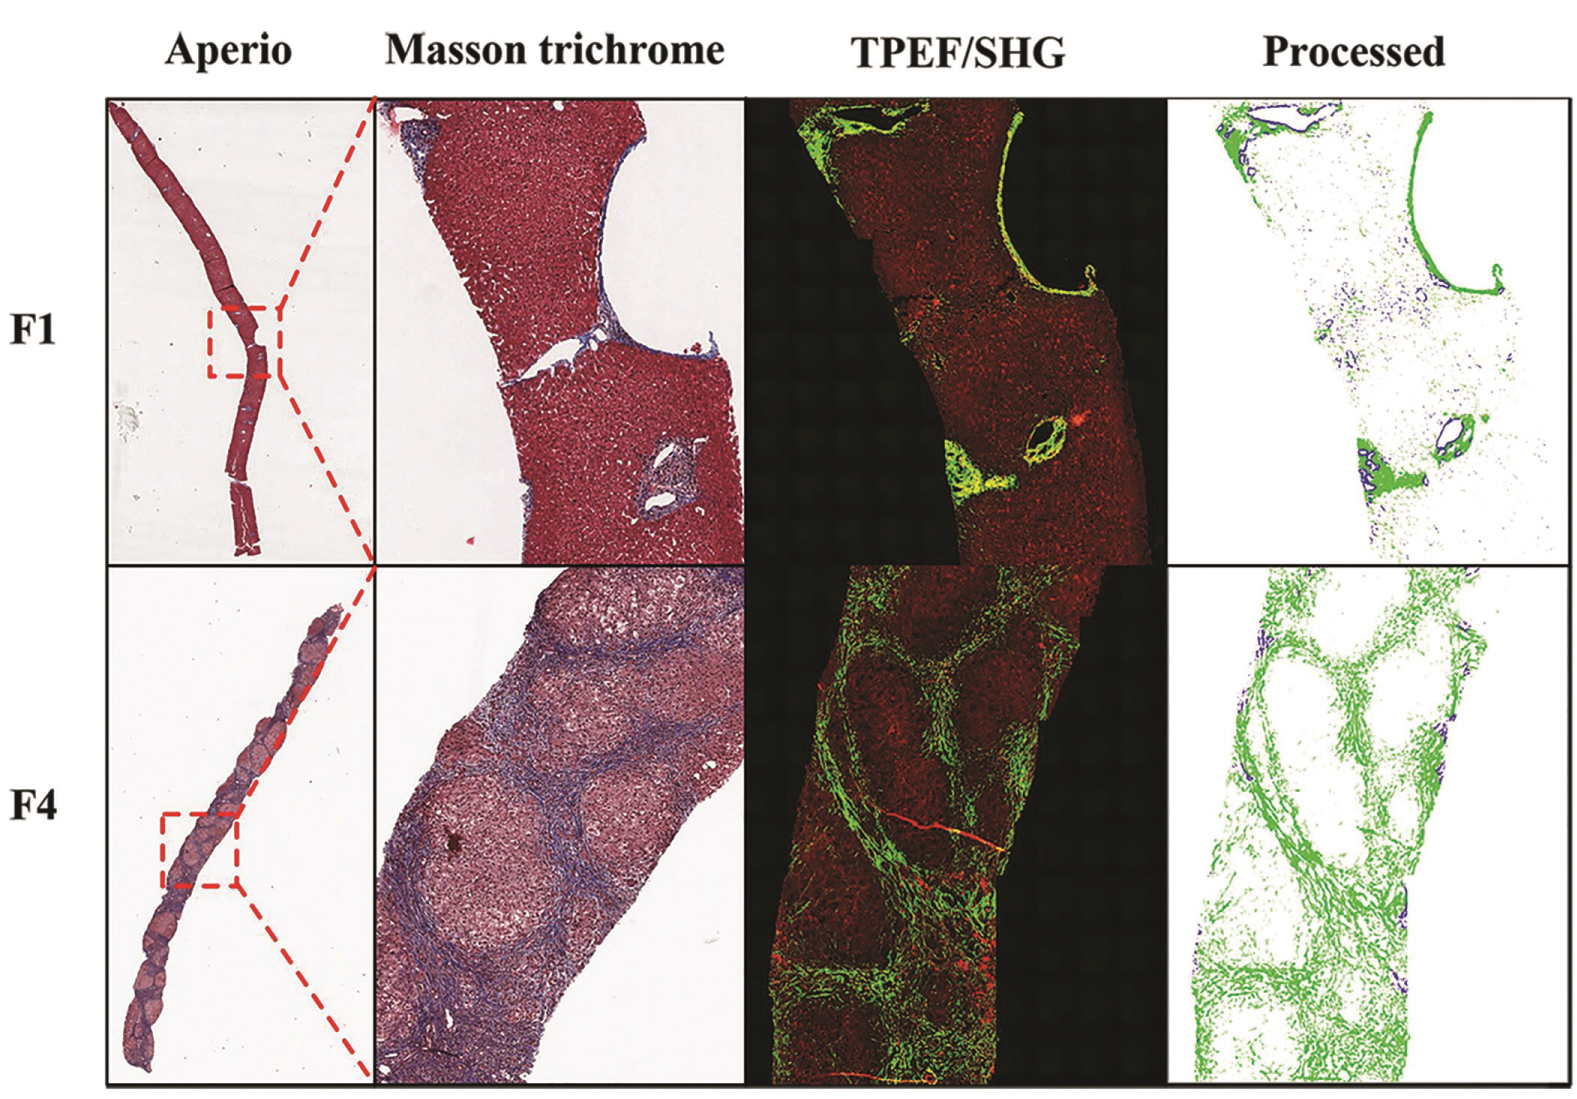 Figure 1: Scanned image using Aperio Technologies 2 scanner (Leica, Vista, CA) of a Masson's trichrome stained core needle biopsy of liver including low power and high-power images for histologic score 1 (F1) and score 4 fibrosis (F4) with corresponding two photon excitation fluorescence microscopy using Genesis®100 (Histoindex Pte Ltd, Singapore/Singapore), before and after processing (on the right). View Figure 1
Two photon excitation microscopies combined with second harmonic generation analysis is a form of nonlinear microscopy that uses unstained deparaffinized sections and allows morphologic visualization based on the auto-fluorescence of collagen fibers and light absorbance of the remaining tissue [20,21]. In this method, the collagen fibers are green, and the remaining tissue is accounted for by a red color (Figure 1).
Four microns thick deparaffinized unstained tissue slides were obtained from all 49 cases and analyzed using two photon excitation microscopies combined with second harmonic generation imaging (Genesis®100, Histoindex Pte Ltd) at ARUP laboratories. Up to 10 three-by-three multi-tile images for each biopsy were obtained with a final image size approximating 1.8 mm2 (1.35 × 1.35 mm) as previously described by Xu, et al. and Tai, et al. (Figure 1) [18,21]. The images were subjected to proprietary computerized image analysis algorithm developed by Histoindex Pte, Ltd. (Singapore) for quantification of total fibrosis percent, aggregated fiber percent, total number of fibers, and total fiber crosslinks [21]. Total fibrosis percent and aggregated fiber percent were calculated as the numerical values of collagen fibers divided by total tissue area and reported as a percentage. Total number of fiber and total fiber crosslinks were numbers obtained by the computerized image analysis software. Similar to the whole slide digital image analysis and histologic assessment, the large portal triads and liver capsule were excluded from analysis.
The data were grouped based on histologic fibrosis score from 0-4 and displayed on correlation plots comparing the average histologic score per case with corresponding percentage of fibrosis obtained by whole slide digital imaging, and the separate data obtained by two photon excitation microscopies. The correlation was assessed with Spearman correlation coefficient (r). ANOVA test was used to compare differences between means. Receiver operator curves were constructed for detection of cirrhosis or score 4 fibrosis. Statistical analysis was carried out using IBM SPSS Statistics 20 and excel.
A total of 49 cases were evaluated with the following diagnoses: viral hepatitis C (n = 34), steatohepatitis (n = 5), autoimmune hepatitis (n = 2), primary sclerosing cholangitis (n = 1), overlap syndrome of autoimmune hepatitis and primary biliary cirrhosis (n = 1), hepatitis C with superimposed alpha one-antitrypsin deficiency (n = 1) and an autoimmune hepatitis with superimposed steatohepatitis (n = 1), along with biopsies composed of normal hepatic parenchyma (n = 4). The mean age of patients was 54 years and ranged between 28 to 75 years with female to male ratio of 1 to 2.
Although no absolute definitions have been accepted for the interpretation of kappa values, the literature does provide some guidelines, and those of Landis and Koch are widely cited [23]. Following their cutoffs, moderate agreement was found on Fleiss kappa statistics between three hepatopathologists with a kappa value of 0.59. The data was further evaluated to study the influence of interobserver variability and the correlation between the imaging modalities. The data obtained by the imaging modalities was plotted against the scores from each participating pathologist (Supplemental Figure 1). The plots were similar for each of the three pathologists. Additionally, there was no statistically significant difference between the three scores when analyzed by Chi square test (p values of 0.269, 0.925 and 0.124), with significance level set at p less than 0.05.
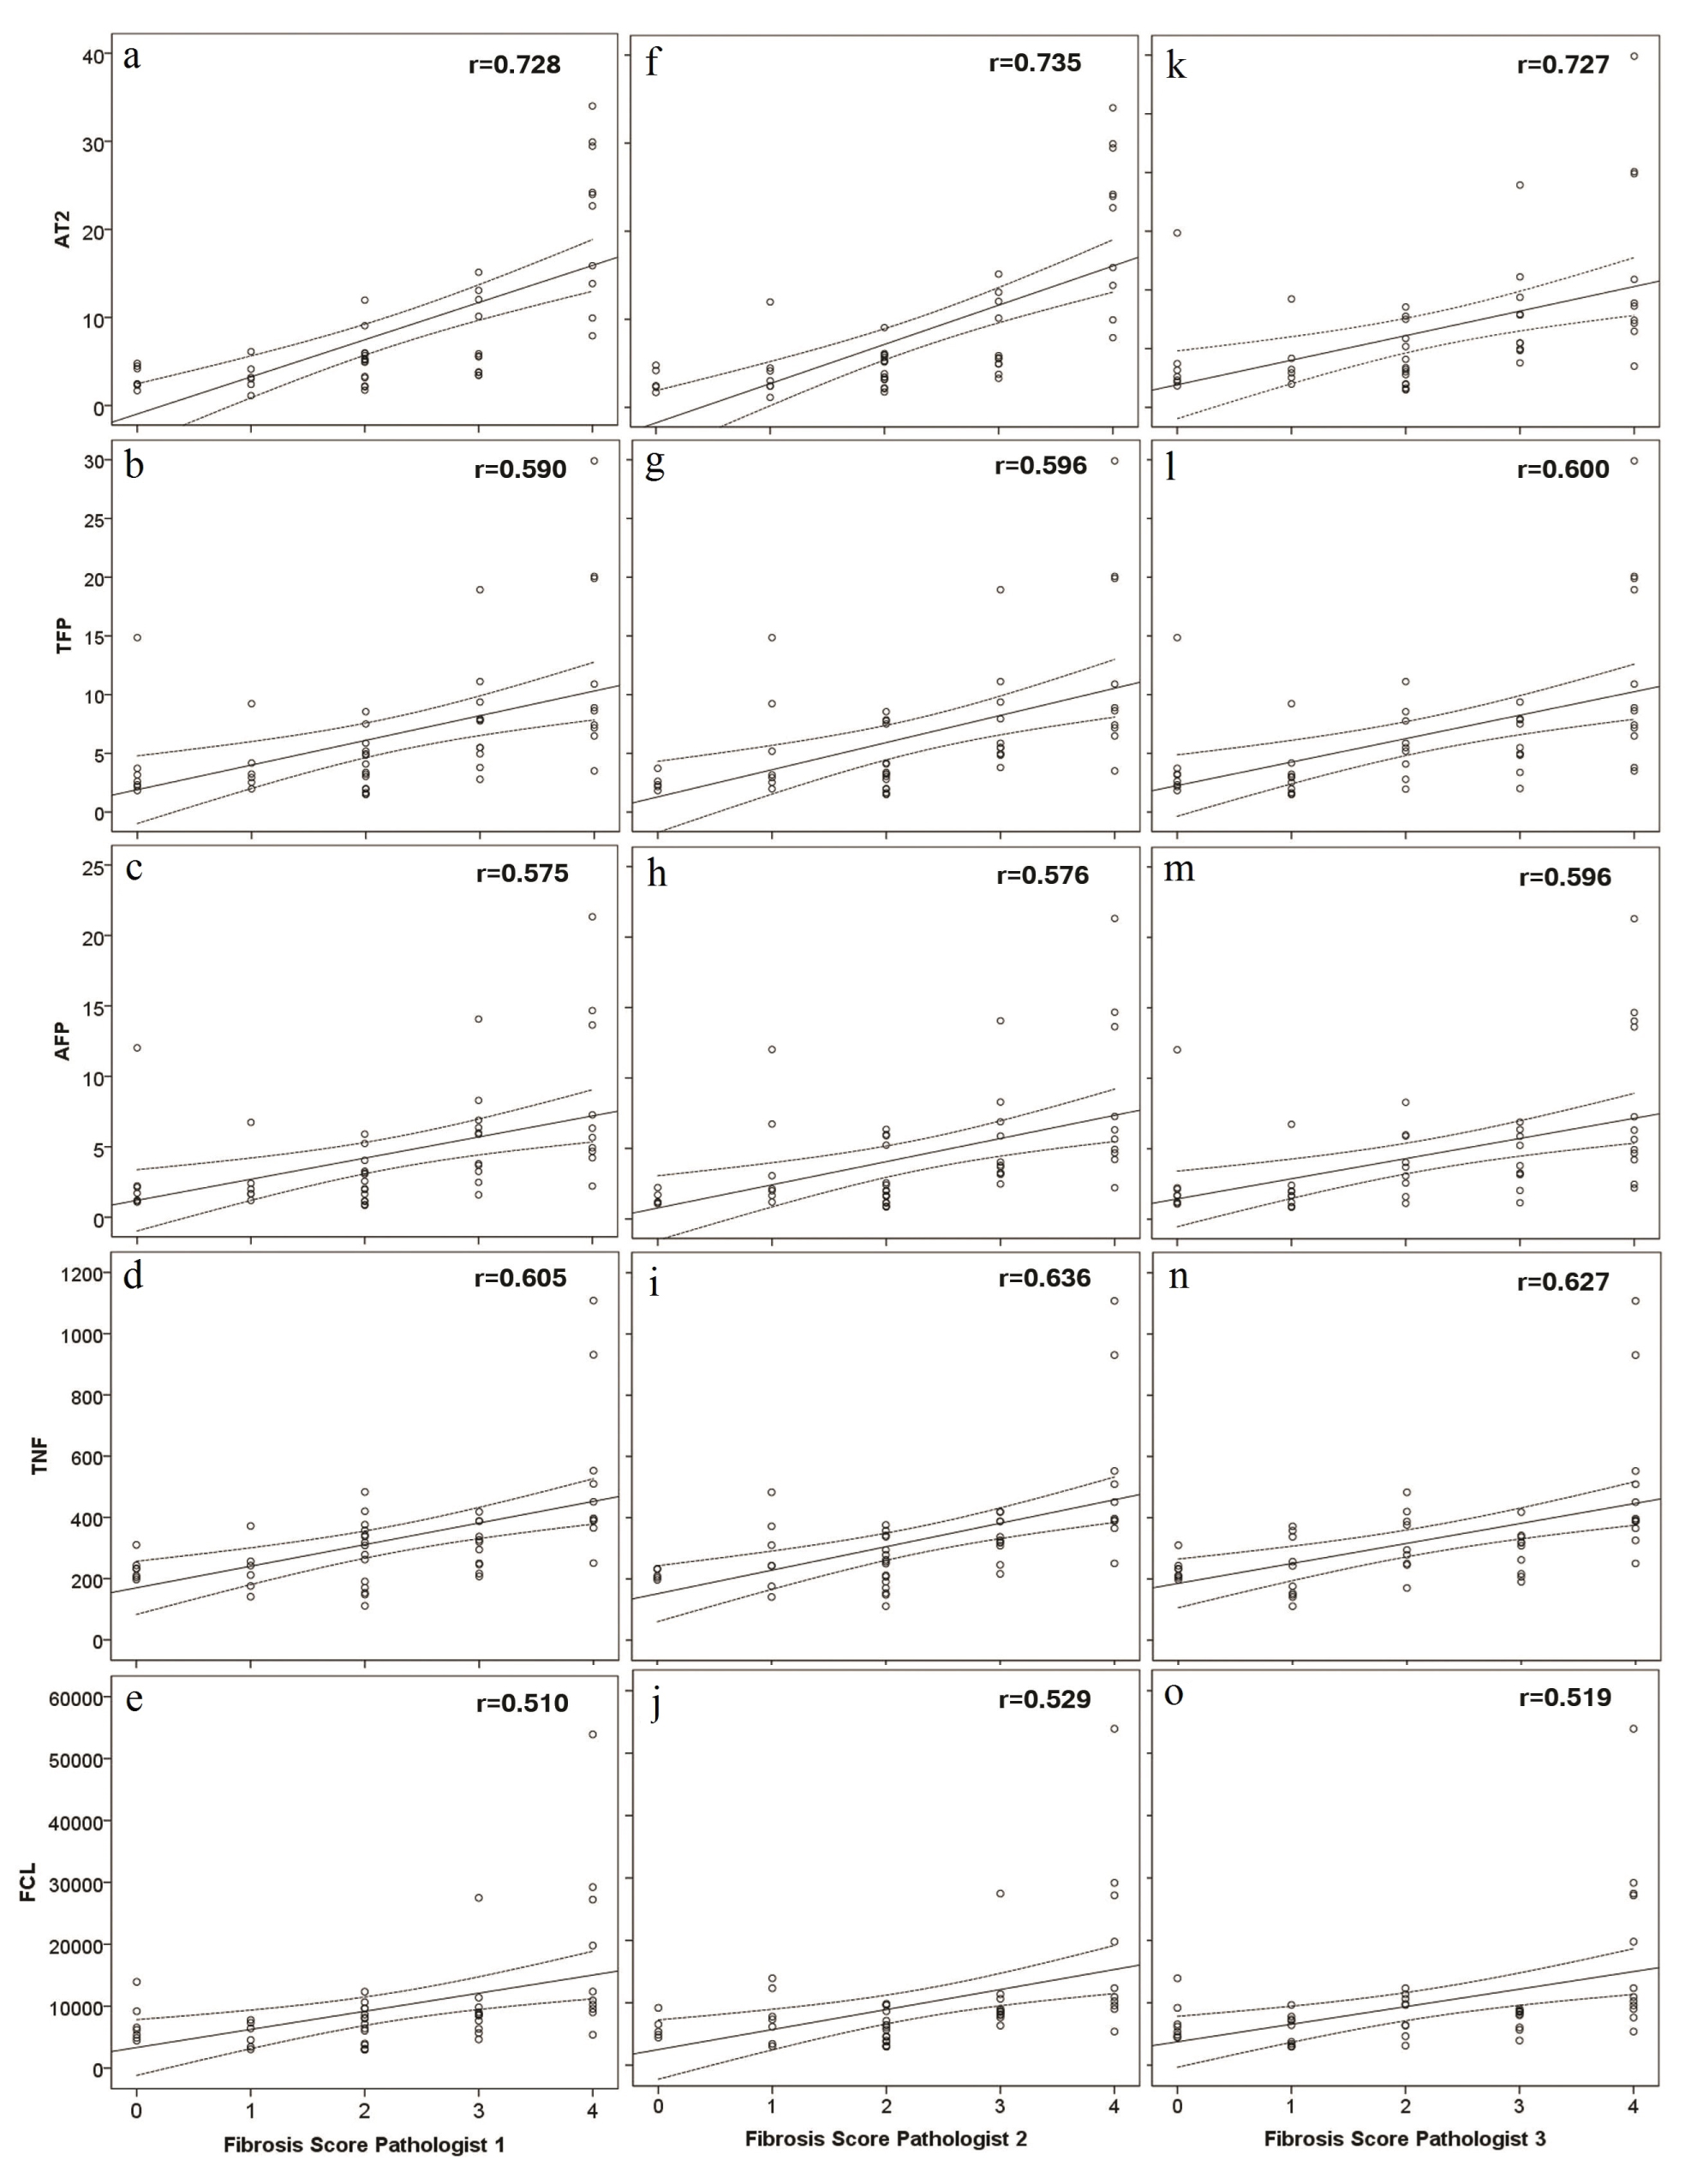 Supplemental Figure 1: Scatter plots for percentage of fibrosis obtained by Aperio Technologies 2 (AT2) and data obtained by two photon excitation microscopy measures of total fibrosis percent (TFP), aggregated fiber percentage (AFP), total number of fibers (TNF) and number of fiber cross-links (FCL), in relation to fibrosis score for pathologist 1 (a-e), pathologist 2 (f-j) and pathologist 3 (k-o). View Supplemental Figure 1
The histologic scores were averaged and rounded per case among the three pathologists with the following results: score 0 (n = 7), score 1 (n = 6), score 2 (n = 15), score 3 (n = 11) and score 4 (n = 10) and mean values for each tested parameter were compared (Table 1). Although scores 0 to 2 showed very similar mean values, the difference between groups was statistically significant for all tested parameters: fibrosis percentage obtained by Aperio Technologies 2 analysis and data obtained by two photon excitation microscopy measures of total fibrosis percent, aggregated fiber percentage, total number of fibers and number of fiber cross-links (p < 0.05). The correlation plots demonstrate positive correlation between the average histologic score and percentage of fibrosis obtained by whole slide digital imaging (r = 0.75), and data obtained on two photon excitation microscopy analysis of total fibrosis percent (r = 0.59), aggregated fiber percentage (r = 0.58), total number of fibers (r = 0.62), number of fiber cross-links (r = 0.52) (Figure 2).
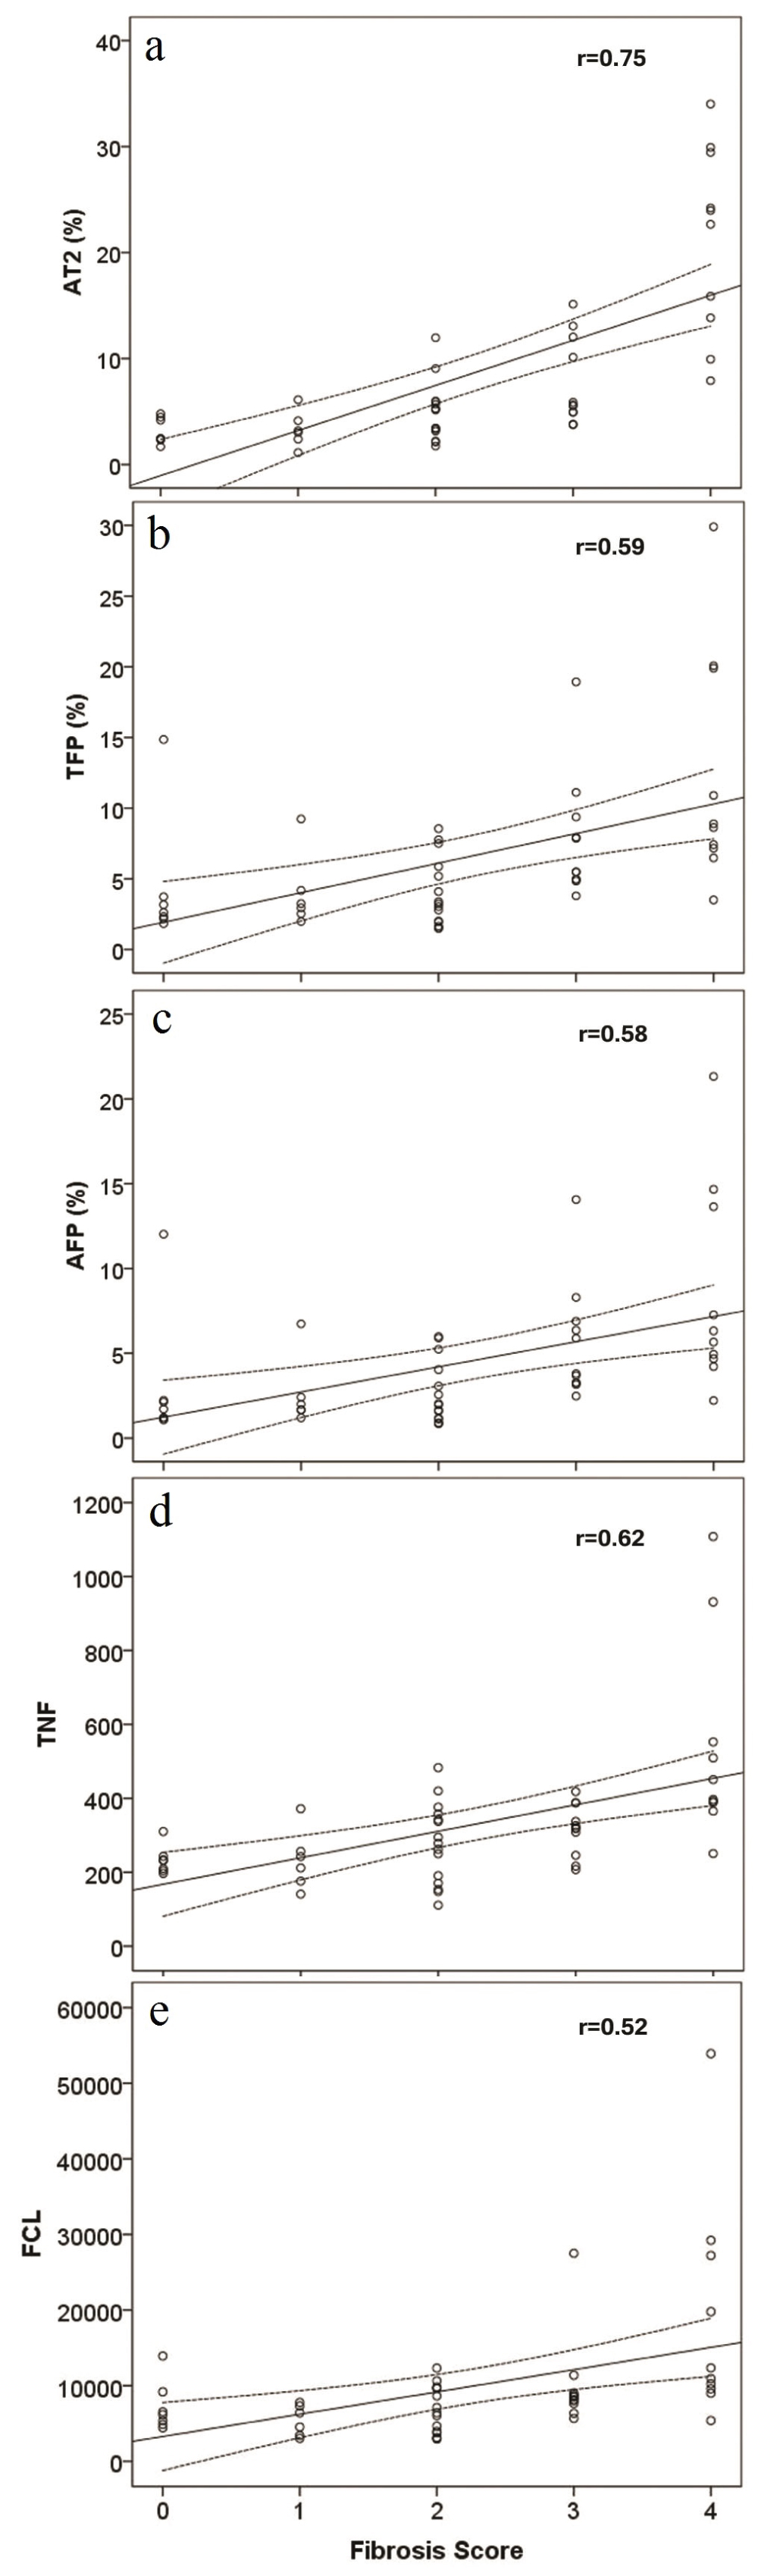 Figure 2: Scatter plots for percentage of fibrosis obtained by Aperio Technologies 2 (AT2) and data obtained by two photon excitation microscopy measures of total fibrosis percent (TFP), aggregated fiber percentage (AFP), total number of fibers (TNF) and number of fiber cross-links (FCL), in relation to averaged and rounded histologic scores. View Figure 2
Table 1: Mean values with standard (Std) error obtained by Aperio Technologies 2 (AT2) and data obtained by two photon excitation microscopy measures of total fibrosis percent (TFP), aggregated fiber percentage (AFP), total number of fibers (TNF) and number of fiber cross-links (FCL) with associated standard error for means, in relation to averaged and rounded histologic scores. View Table 1
Receiver operator curve was performed to assess the ability of the imaging techniques to detect cirrhosis or score 4 fibrosis as well as lower stages of fibrosis. The AT2 fibrosis scanner showed largest area under the curve as compared to data obtained by two photon microscopies (Figure 3). Detection of lower scores of fibrosis (score 1-3) showed successively smaller areas under the curve for all tested parameters. Therefore, sensitivity and specificity with it cut off values was only calculated for detection of cirrhosis (stage 4 fibrosis) (Table 2).
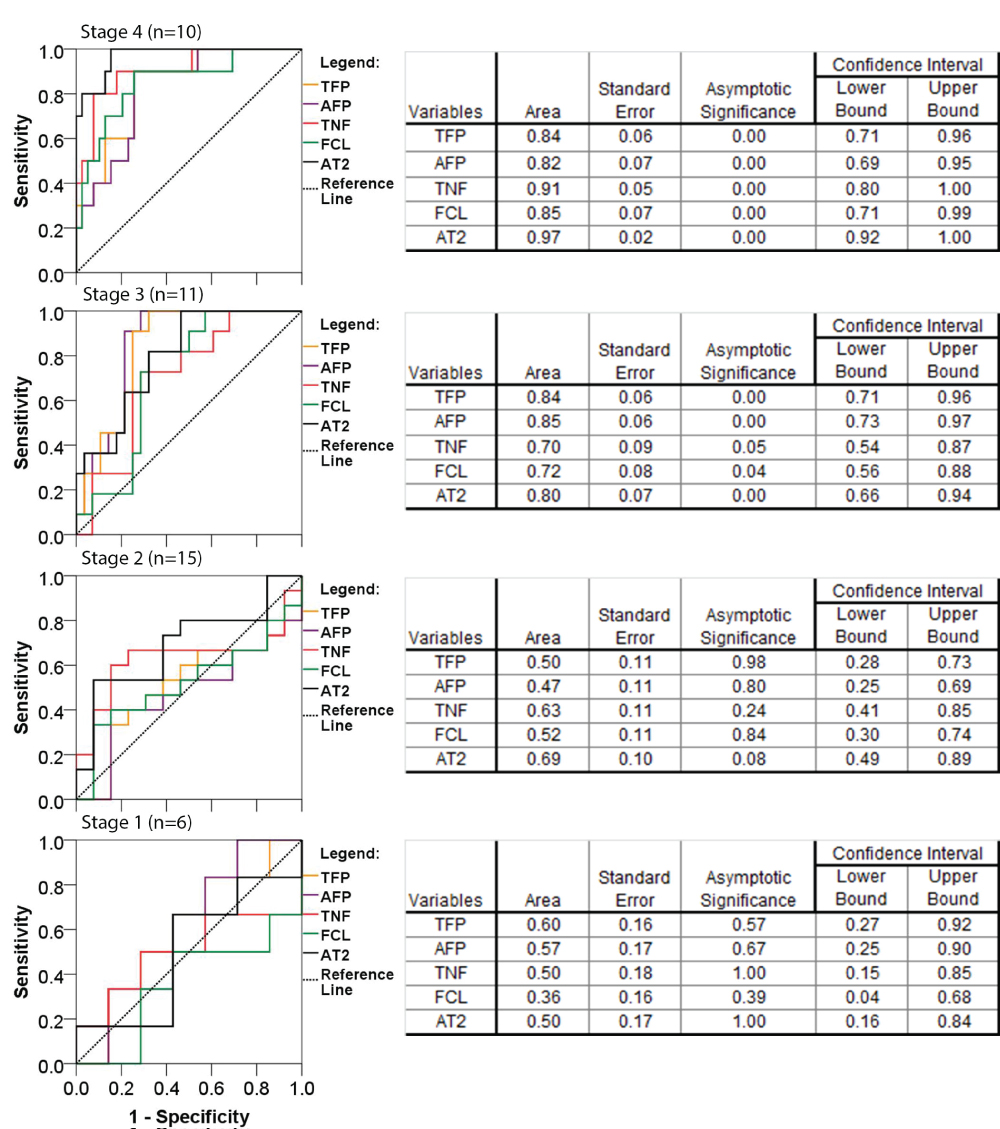 Figure 3: Receiver operator curves for the accuracy of Aperio Technologies 2 (AT2) analysis and data obtained by two photon excitation microscopy measures of total fibrosis percent (TFP), aggregated fiber percentage (AFP), total number of fibers (TNF) and number of fiber cross-links (FCL), for detection of cirrhosis (fibrosis scores 4) and lower stages of fibrosis (score 3, 2 and 1). Nonparametric assumption with null hypothesis: true area of 0.5 and asymptomatic significance less than 0.05. View Figure 3
Table 2: Assigned cut off value with corresponding sensitivity and specificity for detection of cirrhosis (fibrosis scores 4), calculated from the receiver operator curves for the Aperio Technologies 2 (AT2) analysis and data obtained by two photon excitation microscopy measures of total fibrosis percent (TFP), aggregated fiber percentage (AFP), total number of fibers (TNF) and number of fiber cross-links (FCL). View Table 2
The histologic assessment of hepatic fibrosis is subjective, as we have further documented by the only moderate interobserver agreement achieved by the three study hepatopathologists (kappa = 0.59), similar to the kappa statistics for hepatic fibrosis previously published by Rousselet, et al. [24]. In an attempt to improve the objectivity and quantification of hepatic fibrosis, this comparative study evaluated two additional technologies: 1) Whole slide digital imaging, and 2) Two photon excitation microscopies combined with second harmonic generation.
Detection of fibrosis via whole slide digital imaging is now available in many laboratories, and its utility in quantifying fibrosis has been examined. O'Brien, et al. concluded that although digital imaging has potential to detect cirrhosis, discrimination between lower scores of fibrosis is more challenging [25]. Our study yields similar findings. In the lower scores of fibrosis, the pattern of the collagen deposition may matter more than total fibrosis [25]. Whole slide digital imaging calculates the percent fibrosis without regard to the pattern of collagen deposition. An additional factor that may contribute to analytical imprecision by whole slide digital imaging is the staining variability of the Masson's trichrome stain, a well-known histologic issue for this difficult to perform histochemical stain.
Two photon excitation microscopies combined with second harmonic generation is now under investigation for clinical utility [21]. It is a high-resolution image-based technique that allows enumeration of individual collagen fibers, thus providing more information about collagen deposition than the conventionally used techniques [15,18]. In our dataset, two photon excitation microscopies with second harmonic generation evaluation was able to quantitate percentage of fibrosis (total fiber percent) similarly to whole slide digital imaging followed by deconvoluation algorithm. In addition, we were able to obtain more detailed information about the scar tissue that included total fiber percent, aggregated fiber percent and fiber cross-links. Data showed increased total number of collagen fibers, aggregated collagen and crosslinked fibers with the development of cirrhosis (Figure 3). In our experience, any of the four tested parameters can be used to detect cirrhosis and all four tested parameters had positive correlation with histologically assigned fibrosis score, regardless of etiology (0-4) (Figure 2). However, we were not able to reliably discriminate between the lower scores of fibrosis using this technology.
The distribution of collagen fibers within lobules is an integral part of histologic scoring systems but was not accounted for in the whole slide digital imaging analysis nor in the two photon excitation microscopies combined with second harmonic generation analysis, performed in the current study [3,13,22]. Computerized analysis of images obtained from two photon excitation microscopies has been developed to not only quantify collagen fibers but also detect their location and spatial orientation in the hepatic lobules [18,21,26-28]. Hence, two photon excitation microscopies combined with second harmonic generation analysis is promising technology that may provide means to detect early scores of fibrosis more objectively than currently utilized methods in the medical field.
In summary, whole slide digital imaging and two photon excitation microscopies combined with second harmonic generation analysis can provide objective means of fibrosis measurement but are not currently superior to conventional histologic assessment. Herein we verified its utility as an adjunct test in clinical laboratory testing and compared its performance to digital imaging. There are limited clinical studies currently available assessing the utility of two photon excitation microscopy combined with second harmonic generation analysis and comparing it to conventionally used methods to assess liver fibrosis. We believe that this study provides additional insight on the performance of this test in a variety of clinical samples. In our experience, two photon microscopy analysis has the capability and resolution to detect distribution of collagen fibers in addition to quantifying fibrosis. This technology is currently available mostly for the research use, but it may prove helpful clinically.
Dean Tai is an employee of Histoindex Pte. The remaining authors have no relevant conflicts of interest.