Visual diagnosis of skin tumors is one of the most important steps in dealing with them. Nowadays, artificial intelligence has been booming and technology of automated cognition by computer has been improved. One of the bottlenecks in building an efficient cognition system is providing adequate amount of data to base on. The internet may be a mine of the data. Feasibility of using macroscopic skin tumor images on the internet for automated cognition was studied by a personal computer. Skin tumor images were collected with scraping software. The quality of images varied. The most time-consumed process was to select images visually. After the selection, 600 macroscopic images consisting of 5 categories were qualified. The images were plotted with cluster analysis algorithms. Unsupervised data clustering: k-means clustering, principal component analysis and t-distributed stochastic neighbor embedding could not cluster them in human comprehensible fashion. Three-dimensional plotting of a supervised data clustering: Linear discrimination analysis, showed relatively clear clustering. Convolution neural networks were trained and tested for categorical accuracy. Time, consumed for training networks on a personal computer, was satisfactory. Categorical accuracy depended on what network it employed. Fine-tuning of a pre-trained network scored best categorical accuracy. Augmenting training data statistically increased categorical accuracy. Despite variation of image quality, using skin tumor images on the internet is a feasible approach for automated cognition.
Deep learning, Convolution neural network, Linear discrimination analysis, Internet, Skin tumors
To deal with skin tumors, visual diagnosis is the first to do and essential. Reports of automated analysis of skin lesions have been increasing [1-4]. Some of them were programmed to do heuristic analysis: e.g. works to classify malignant melanoma based on ABCD (asymmetry, border irregularity, color patterns, and diameter) rules [5,6].
Nowadays, automated cognition by computer is booming, powered by increasing machine power, including GPU (Graphic Processing Unit)-accelerated computing. In computer science field, there is an approach to mimic neural connection in living organism [7], and it is called artificial neural networks [8]. Biological neural cells outputs signal to next connected cells via synapses, depending on what inputs it received. Frontline neurons of artificial neural networks receive input, which was translated into a series of numbers, from outside and transfer signals to neurons of the next layer. The second layered neurons output their signals calculated from what they received. Final output will be obtained from the last layered neurons. Deep learning approach, which refers to artificial neural networks that are composed of many layers [9], is one of the representative methodologies in recent Artificial Intelligence (AI). It has been used in computer visions such as image classification, object detection and object tracking. It has also been used for language processing and speech recognition. Convolution Neural Network (CNN) [10] is a type of deep learning method. There are one or more convolutional layers in the multi-layered artificial neural network.
To build a CNN, numbers of images to train the CNN are required. Images of skin lesions can be found on internet in these days. They can be gathered by so-called scraping software's. The aim of this study was to evaluate the feasibility of these images.
Using Google search on the internet, macroscopic skin tumor images were collected. A personal computer was used to handle the images. They were analyzed by data clustering. Also, CNN's were trained to classify skin tumors.
All procedures were done on a desk-top personal computer: CPU (Central Processing Unit): AMD A10-7850 K 3.70 GHz (Advanced Micro Systems, Sunnyvale, CA, USA), memory: 24.0 GB, GPU: GeForce GTX1080 8 GB ((nVIDIA, Santa Clara, CA, USA), Windows 10 home (Microsoft Corporations, Redmond, WA, USA).
Python 3.5 (Python Software Foundation, DE USA), a programing language, was used under Anaconda [11] as a installing system, and Spyder 3.0 [12] as an integrated development environment. Keras [13]: The deep learning library, written in Python was run on TensorFlow (Google, Mountain View, CA, USA). GPU computation was employed through CUDA (nVIDIA).
Images on the interest were gathered with so-called scraping software: Image Spider [14]. When keywords were given, this freeware will look them up through Google search. It will access the listed websites and download images. Six categories for skin tumors were named; "BCC", "MM", "NCN", "SEK", "SCC" and "VV". Given keywords were; "basal cell carcinoma", "basal cell epithelioma" for "BCC", "malignant melanoma" for "MM", "pigmented nevus", "nevus cell nevus" for "NCN", "seborrheic keratosis" for "SEK", "squamous cell carcinoma" for "SCC", "verruca vulgaris" for "VV".

Downloaded images were checked with eyes by S.N. and excluded images other than lesions of interested categories: e.g. banners or advertisement logos. Macroscopic images were selected. Lesions on animals other than human were also excluded. Mucosal lesions were omitted as well. Lesions of interest were cropped into square images with JTrim [15]. Files with .gif, .jpeg, .png extensions were converted to .jpg files with Ralpha Image Resizer [16]. Unclear images and files smaller than 80 × 80 pixels were excluded. Category of "SCC" could not gather sufficient number of images, thus was omitted from further study.
From 5 rest categories each, 120 files were chosen at random, summing up 600 files. Illumination correction for the images was done with Constant Limited Adaptive Histogram Equalization (CLAHE) in OpenCV3.1.0 libraries [17,18].
Six hundred files with .jpg extension were processed with a python based program; modified version of gyudon-makedata2.py [19]. The image files were converted to 64 × 64 pixels × 3 RGB data with each category labels.
Unsupervised data clustering: k-means clustering [20,21], Principal Component Analysis (PCA) [22,23] and t-Distributed Stochastic Neighbor Embedding (t-SNE) [24] were done with a Python machine learning library: Scikit-learn [25]. Visualization of latter two results was done with Plotly [26]. Supervised data clustering: Linear Discriminant Analysis (LDA) [27] was also performed.
The images in each category (120 images) were divided into 84 images for training and 36 images for testing at random. Adding up 420 training images and 180 testing images for 5 categories. Data augmentation of training data was done by flipping and rotating images by 30 degrees, obtaining 5460 images (13-folded: Ex13). Furtherly, width-shift, height-shift and zooming were done to obtain 20580 images (49-fold: Ex49) (Figure 1).
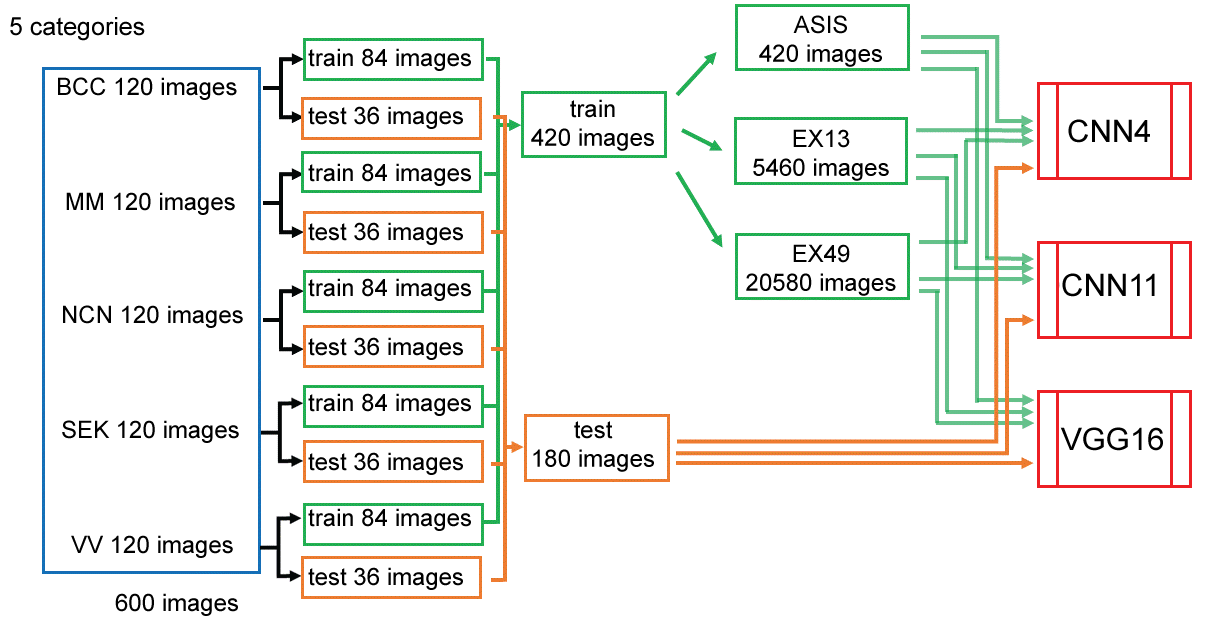 Figure 1: Data preparation and augmentation.
The images in each 5 categories (120 images) were randomly divided into 84 images for training and 36 images for testing. Images for training was fed as is (ASIS), after augmented 13 folds (Ex13), or 49 folds (Ex49) to CNN's. View Figure 1
Neural network with 4 convolution layers (CNN4): Modified version of gyudon_keras2.py [19] was constructed. Another neural network with 11 convolution layers (CNN11) was constructed. Keras based fine-tuning of pretrained VGG-16 model [28-30] was also employed (Supplemental Figure 1). For former two models, 30 epochs were executed and for the latter, 10 epochs were done. The epoch number was determined by drawing accuracy-epoch chart in executing 60 epochs (not shown).
 Supplemental Figure 1: Diagrams of convolution neural networks used for this study. View Supplemental Figure 1
The neural networks were trained with the training data and evaluated categorical accuracy (correctly categorized images/180) for testing data. In every session, training and testing data were shuffled at random. Time for training was counted. Ten sessions each was done.
The "wrong images": Not correctly categorized by a session of fine-tuned VGG16 were plotted on three dimensional LDA with all 600 images. Square norms of three dimensional LDA were compared respectively in each five categories.
Tukey-Kramer's test was employed for analyzing testing accuracy. To compare LDA square norm, Student's t-test was used when the variances were equal, and Welch's t-test when not.
Numbers of images downloaded and images after selection are shown in Figure 2. Time for downloading did not exceed ten minutes for each category. No more than 26 images were left for category: "SCC", after selection. This category was omitted from further experiments. For other category each, 120 images were randomly chosen.
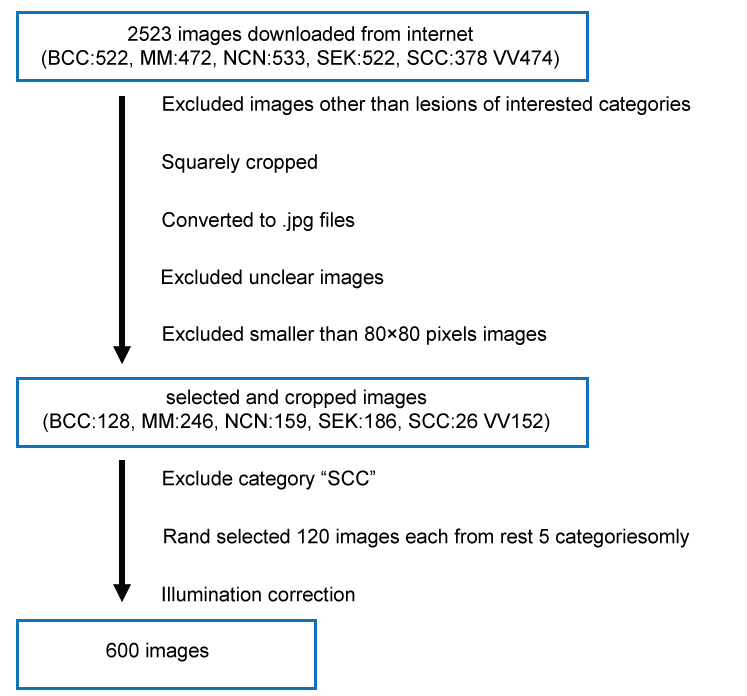 Figure 2: Diagram of processing skin tumor images collected from the internet. View Figure 2
Unsupervised data clustering: k-means clustering, PCA and t-SNE with 600-image data could not cluster them clearly (Figure 3). With supervised data clustering: LDA, visual clustering was relatively clearly done. Three-dimensional plotting with centers showed more comprehensive image than two-dimensional plotting (see interactive 3d image: Supplemental Figure 2).
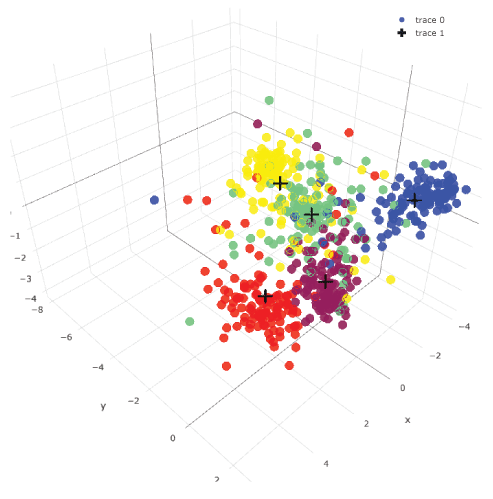 Supplemental Figure 2: Three-dimensional LDA plotting of 600 images.
This is an interactive figure. You can rotate it and see from different angles. Images in the same category were plotted with the same color. Centers of each category were plotted with black crosses. View Supplemental Figure 2
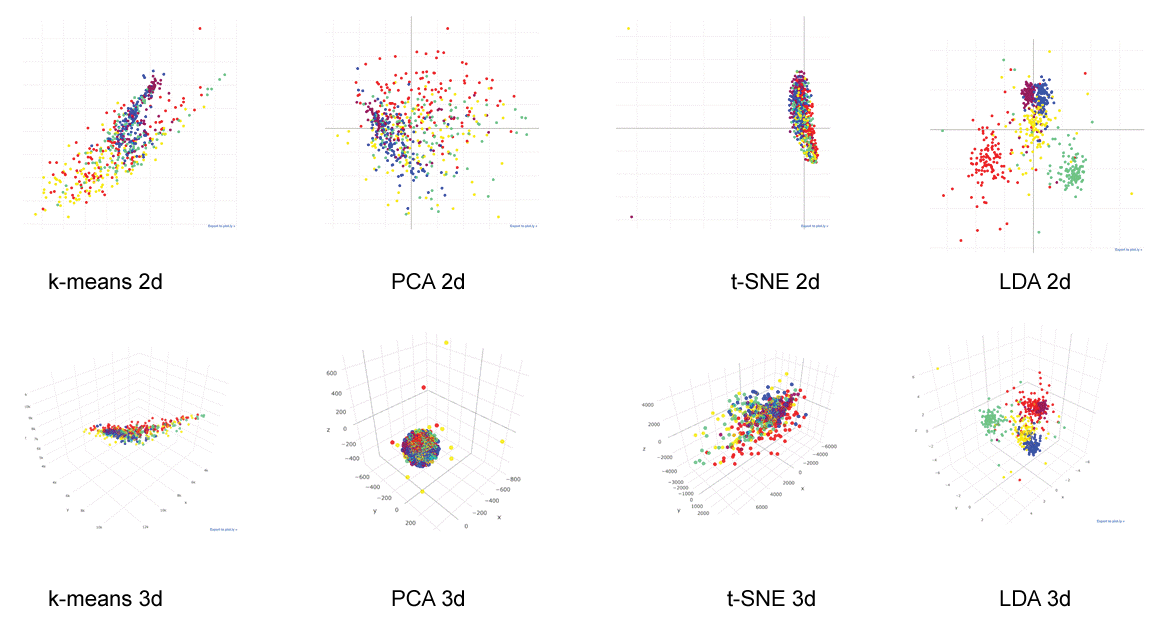 Figure 3: Data clustering.
600 images were plotted 2 or 3 dimensionally with cluster analysis algorithms. Images belonging to the same category were plotted with the same color. Unsupervised data clustering: k-means clustering, Principal Component Analysis (PCA) and t-distributed Stochastic Neighbor Embedding (t-SNE) could not cluster them in human comprehensible fashion. Three-dimensional plotting of a supervised data clustering: Linear Discriminant Analysis (LDA) showed relatively clear clustering (see also interactive 3d image: Supplemental Figure 2). View Figure 3
Categorical examples of skin tumors are shown in Figure 4. Time consumed in training is presented in Figure 5 and Table 1. Expanded data sets consumed more time than original data set. Deeper convolution network spent more time. Fine-tuned VGG16 spent less time.
Table 1A: Time consumed for training CNN average (seconds) ± standard deviation. View Table 1A
Table 1B: Matrix for Tukey Kramer analysis p-value in time consumed for training CNN. View Table 1B
 Figure 4: Examples of categorization by Ex49-VGG16. The CNN evaluated images as probabilities for each 5 categories shown in right column. Red characters indicate most probable answer. BCC: Basal Cell Carcinoma; MM: Malignant Melanoma; NCN: Nevus Cell Nevus; SEK: Seborrheic Keratosis; VV: Verruca Vulgaris. View Figure 4
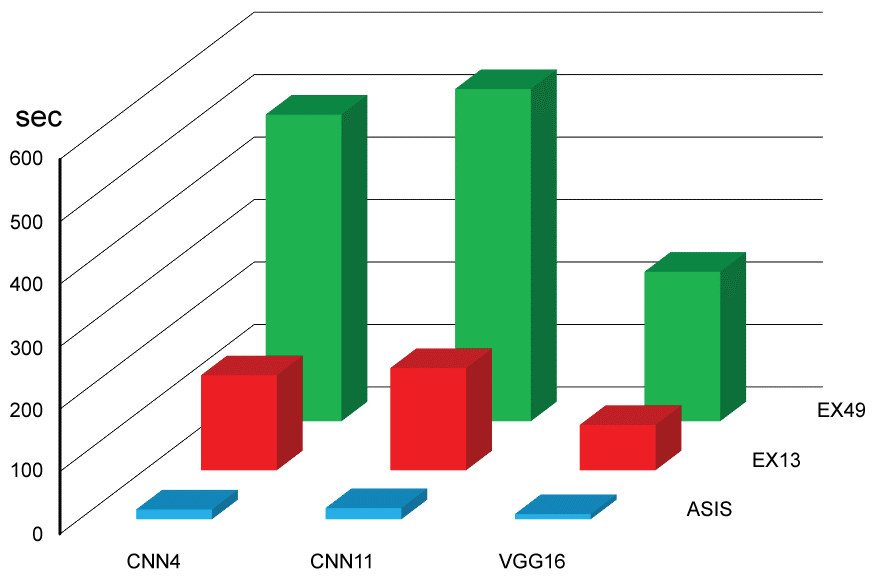 Figure 5: Time consumed for CNN training (see also Table 1A and Table 1B). View Figure 5
Each testing session for 180 images was done within 0.5 second. Testing categorical accuracy for each setting is presented in Figure 6 and Table 2. Augmenting data significantly contributed in increasing testing categorical accuracy. Expanding data for 49 folds could not enhance the accuracy comparing with 13 folds. Our CNN11 had negative influence on the accuracy comparing with CNN4. Fine-tuned VGG16 significantly increased testing categorical accuracy (top score: 0.794). Confusion matrix of testing for a session of EX13-VGG16 was made as an example (Figure 7).
Table 2A: Categorical accuracy for testing average ± standard deviation. View Table 2A
Table 2B: Matrix for Tukey Kramer analysis p-value in testing categorical accuracy. View Table 2B
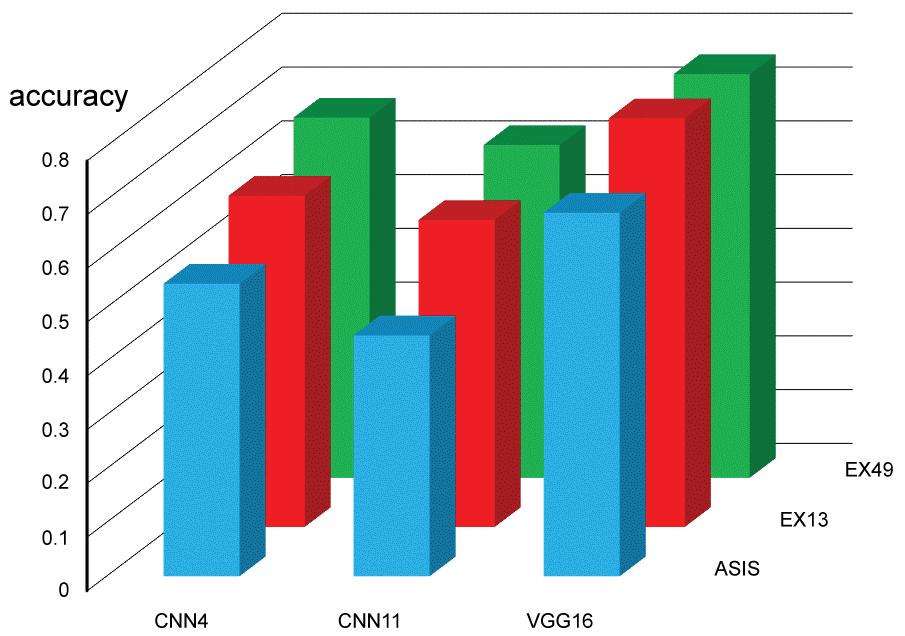 Figure 6: Categorical accuracy for testing images (see also Table 2A and Table 2B). View Figure 6
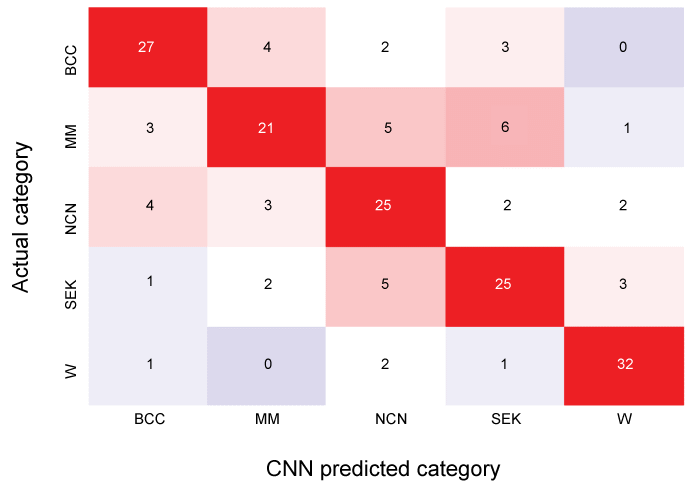 Figure 7: Confusion matrix of testing for a session of EX13-VGG16.
After training the CNN, 180 (36 for each category) images were tested. High numbered areas are colored red, and low are blue. Overall categorical accuracy (true positive) for this session was 0.722. BCC: Basal Cell Carcinoma; MM: Malignant Melanoma; NCN: Nevus Cell Nevus; SEK: Seborrheic Keratosis; VV: Verruca Vulgaris. For MM, true positive rate was 0.583 (21/36), precision was 0.700 (21/(4+21+3+2+0)), false positive rate was 0.063 ((4+3+2+0)/(180-36)), and accuracy was 0.867 (156/180). View Figure 7
Visually, the images wrongly categorized by EX-49-VGG16 were not necessarily plotted outside of the clusters (Supplemental Figure 3). Statistically, square LDA norm of the wrong images were not different from those of the belonging categories (Table 3).
Table 3: Square norms of three dimensional LDA. View Table 3
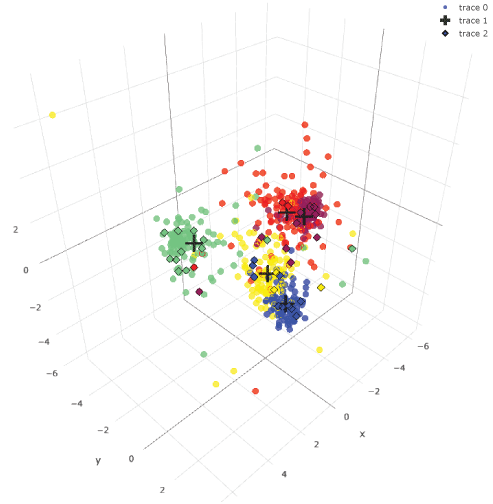 Supplemental Figure 3: Three-dimensional LDA plotting of images.
This is an interactive figure. Correctly categorized images by a session of Ex49-VGG16 were plotted with dots. Wrongly categorized images were plotted with diamonds. Most of the diamonds are plotted within aggregation of clusters. View Supplemental Figure 3
Visual diagnosis is primary and one of the most important steps in dealing with skin tumors to decide therapeutic strategies and surgical margins. This step has been demanding expertness, learned with repetitive training, and limiting the practice to experienced dermatologists.
Automated cognition by computer may release this limitation. To conduct machine learning, numbers of training data is indispensable. Though, gathering and accessing to the data with adequate volume has been very difficult.
As the people connected with the internet, the amount of information available through the internet is accumulating. Number of images of skin lesions, open to public, on the internet is multiplying. The aim of this study was to evaluate feasibility of using images, obtained through the internet for automated cognition.
Gathering skin tumor images through the internet was not difficult to conduct with free scraping software. It automatically gathered images related to the input key words. Over 3,000 files were obtained. Among them, approximately 2,500 were image files. Files related to squamous cell carcinoma were relatively less than the other categories.
The most time consumed, and expertness demanded step in this study was to check images by eyes. Categorizing quality of data exclusively depends on this step. There were many files inappropriately gathered: e.g. basal cell carcinoma images found in malignant melanoma category and vice versa. At this moment, this is the key step to prepare data, which cannot be done automatically. After selection, approximately 900 images were left. We were reluctant to omit squamous cell carcinoma category from the study, because of the shortage in number. It is well-known that large difference of available data number profoundly influences neural network results.
Unsupervised data clustering: k-means clustering, PCA and t-SNE could not cluster them in human comprehensible fashion. Interactive three-dimensional plotting of a supervised data clustering: LDA (Supplemental Figure 2) showed relatively clear clustering.
Time consumed by training the CNN's on our personal computer was acceptable. Utilizing GPU computing accelerated approximately 9 times (data not shown). Fine-tuned VGG16 consumed less time because of less epochs. Number of epochs for each CNN was determined by accuracy-epoch chart (not shown). Too much epochs will ruin the accuracy because of overfitting.
The categorical accuracy depended on what neural network it was employed. Among the networks we employed in this study, fine-tuned VGG16 categorized with the best accuracy. It is a convolution network with 16 convolution layers. It was one of the competitors for ImageNet Large Scale Visual Recognition Challenge (ILSVRC) [29]. The model and trained weights for 1000 classes challenge are open to public and able to use in Keras application [31]. This technique is called "transfer learning" [32]. The skin tumor images are not included in the pre-trained images. Though, usage of the pre-trained weights improved accuracy for classification of our data and shortened training time.
The wrongly categorized images by a CNN were plotted within the aggregations, clustered by LDA. No statistical difference in square norms of LDA was seen between "wrong images" and their parent populations. There seemed to be some difference of decision between CNN and LDA.
Augmenting training data statistically increased categorical accuracy. It is a good process when the training data volume is small [33]. Though, the boosting effect of 49-fold expansion could not be seen in comparison with 13-fold expansion.
The quality of skin tumor images, obtained from internet, was not consistent. The cameras taking images, lenses, lighting, focus, resolutions, all differ one by one. Despite of the quality variety of the images, categorizing worked reasonably well. Illumination correction process slightly increased the categorical accuracy (data not shown). To deal the images with our personal computer setting, the images were trimmed and compressed into 64 × 64 × 3 RGB images. Tuning data preparation process may increase categorical accuracy.
Even though squamous cell carcinoma of skin is not a rare disease, the number of images for the category, collected from the internet was short. There seems to be unevenness of presence on the internet, depending on the diseases.
Currently, copyright issue of the images on the internet is ambiguous. Some images do not reserve copyright, and some do. Images on public domain can be used without permission. The scraping software we used gathers images without discrimination, whether copyright is reserved or not. It has to be considered when releasing what images used in the study.
Previously, Nasr-Esfahani, et al. [34] reported deep-learning system distinguishing melanoma from non-melanotic lesions. The overall accuracy for two category classifications was 0.81. Esteva, et al. trained deep convolution network with 129,450 dermatological clinical images with 2,032 diseases. To classify in three categories, (benign, malignant, non-neoplastic), accuracy was 0.72 and in nine categories was 0.55. It may not be appropriate to make an easy comparison, but our result for five categories with a personal computer seems comparable to their results. Using images, obtained through internet, may be a feasible approach.
Computer cognition is a new kind of technology. Estimation of the accuracy rate by automated image analysis may vary from person to person. This study was done in limited kinds of skin tumor diseases and what was done was to sort out in those limited categories. It is obvious that this computer cognition cannot diagnose skin tumors. Routine history listening, visual evaluation, biopsy cannot be replaced by mere image analysis. Though, it cannot be denied that AI and machine learning is developing rapidly. It is important to use it well.
Skin tumor images were gathered on the internet. After visual validation process, the images were fed to convolution neural networks on a personal computer. Images on the internet may be feasible for automated cognition. It is undeniable that AI and machine learning is developing. Personal computer level automated cognition became realistic.
We would like to thank Asaka Nishio for her support.