The continuous glucose monitoring technique is recommended for follow-up of individuals with diabetes type 1. For those with diabetes type 2, glucose variability measures, either performed automatically or by visit-to-visit method, can be used to complement glycosylated haemoglobin (HbA1c) in predicting long-term outcomes.
A-proof-of-concept study, conducted in primary care. A total of 63 variables were used from electronic health records to describe clinical characteristics of 110 individuals with diabetes type 2 of both gender, 40-86 years old (average 62.69), and on treatment with oral hypoglycaemic drugs. The artificial neural networks (ANN) of machine learning techniques was used to model inter-day glucose variability based on the estimation of variances (the square of the standard deviation) of sporadically recorded fasting and postprandial (2h after breakfast) glucose measurements as the outcome measures. Model of increased HbA1c (≥ 7%) was used as the benchmark. The number of variables for modelling was reduced by using the pre-processing method. Multiple linear regression (MLR) models were performed on the prepared subsets to compare to the predictive accuracy of ANN models.
A higher glucose variability, for both fasting and postprandial glucose variances, was associated with higher HbA1c values (Q1-Q4 differences, p = 0.002 and 0.006, respectively). The two top-ranked variables in ANN models of glucose variability were the same, indicating HbA1c and glomerular filtration rate, a measure of chronic renal impairment. MLR models of glucose variability did not give the significant predictors.
For created models of glucose variability, to become practically useful, their outcome measures should be dichotomised and standardised according to the thresholds of HbA1c or some standardised measures of glucose variability, such as the coefficient of variation.
Diabetes mellitus type 2, Glucose variability, Primary care, Routine data, Machine learning, Pilot study
Diabetes mellitus type 2 (DM2) is a global public health issue due to its close associations with obesity, hypertension and other comorbidities, and a progression towards serious complications, such as heart attacks, heart failure, kidney failure, dementia, blindness and lower limb amputations [1]. Besides the obligation to provide individuals with DM2 with counselling for healthy lifestyle, a responsibility of health care providers is also in making decisions for personalised pharmacological treatments. The guidelines recommend maintaining the blood glucose levels within the ranges of target values, the aim of which is a twofold: to avoid the medication-induced low blood glucose (hypoglycaemia) while reducing the deleterious effects of chronic hyperglycaemia on target organs and the vasculature [2].
The main constraint in making the choices of medication therapy is the lack of relevant information on diabetes control. For example, a tight diabetes control in older individuals with DM2 and comorbidities and target organs involvement is difficult to achieve, as the precise knowledge on factors influencing glycaemic control in these individuals is scarce [2]. Some of the mechanisms may include increased inflammation and oxidative stress, by which inflamed target organs tissues may worsen insulin resistance [3]. The recent reports suggest an inflammatory marker, neutrophil/lymphocyte ratio, as a new measure of diabetes control [4]. Some non-diabetic drugs, acting alone, or in the concert with other drugs, can interfere with the blood glucose levels [5].
Glycosylated haemoglobin (HbA1c), a measure of average blood glucose in the past three months, has been historically used as a measure of the overall glycaemic control, and as a surrogate marker for the development of long-term diabetes complications [6]. According to the current guidelines, HbA1c values below 7% indicate optimal glycaemic control [2]. A limitation of this measure is a lack of information on acute glycaemic variations, and an inability to predict acute hypoglycaemic events [7]. In addition, individuals with the same HbA1c value may have different mean glucose concentrations [8]. In the era of personalised medicine, HbA1c, if taken alone, is not sufficient to guide decisions on treatment [9].
Based on the recent technology advances, continuous glucose monitoring (CGM) has increasingly been used in clinical practice [10]. This method was proved as to be preferable over the self-monitoring of blood glucose (SMBG) method in guiding decisions on treatment in individuals with type 1 diabetes [11]. In particular, CGM can provide information on current glucose levels and excursions, allowing individuals with type 1 diabetes to optimise insulin therapy and dietary intake, to prevent acute hypoglycaemic events. In individuals with DM2, in whom the hypoglycaemic events are less prominent, CGM has not yet been routinely used [12]. Preliminary evidence suggests that a use of CGM in these individuals, by quantifying time below, within, and above the established glycaemic targets, can promote adherence to lifestyle behaviour, and better glycaemic and weight control, when compared with traditional SMBG method [13]. Recently, the International Consensus Group has established target percentages of "time in range" categories for specific diabetes populations to enable effective therapeutic decision making within the parameters of the established glycaemic goals [12]. Standardisation of this key CGM measure is expected to facilitate CGM use as a tool to guide personalised treatment of many individuals with diabetes, thus reducing the risk of long-term diabetes complications [14].
This is a proof-of-concept study. In a primary care (PC) setting, CGM technology is not widely available. The most of the diabetic population in PC are individuals with DM2, which are heterogeneous due to variations in the number and structure of comorbidities and prescribed medications. For this part of the diabetic population, to whom continuous monitoring of blood glucose is not necessary to perform, we suggest the use of simple measures of glucose variability, which can be estimated from fasting and postprandial (2 h after breakfast) blood glucose data, sporadically recorded in electronic health records (eHRs), as it is usually the case in PC. Although simple-to-estimate, these measures are able to capture the highest glucose excursions (both increments and decrements) over daytime [10]. We have also used a number of data from eHRs to model clinical profiles of individuals with increased glucose variability. We believe these models would help the PC providers in recognising individuals who are candidates for assessing the risk for negative outcomes.
This was a retrospective observational and analytical pilot study conducted from October 1, 2016, to January 31, 2017, in two PC practices, in eastern Croatia. Participants were individuals diagnosed with DM2. The number of participants included in the study exceeded 100 (N = 110), which is the minimal number of subjects recommended for data modelling [15]. They were of both gender, and 40-86 years old (average 62.69). Data was collected during encounters, in a four-month lasting recruitment process. This was a sufficiently long period that all individuals who adhere to treatment with oral hypoglycaemic drugs (OHDs) rotate. During this period, participants were invited several times for blood glucose measurements. They were informed about the purpose of the study and all signed their informed consent for participation in the study and for the possible publication of the study results.
Overall, 63 variables were used to describe characteristics of participants (Part I of Appendix Table 1) and regimen treatments (Part II of Appendix Table 1). A major part of the data was used from eHRs, including general data, information on diabetes duration and age of onset, diagnoses of other chronic diseases (indicating diabetes comorbidities), and information on medications prescription. The laboratory data was used from PC laboratory templates. Laboratory tests were performed as a part of periodic chronic disease surveillance or preventive check-ups.
Information on non-pharmacological regimens and some conditions for which evidence indicated their associations with impaired glucose metabolism, such as sleep and cognitive disorders, was collected by participant self-reports [16,17]. Anthropometric measurements, if not updated in eHRs, were taken from participants during encounters.
Blood glucose values, which are necessary for estimating glucose variability, were obtained from participants by using a glucometer device and in 6-8 routes of random measurements (Appendix Table 1). A value of HbA1c for each participant was taken from eHRs, as measured in the period under study as a part of the periodic surveillance of individuals with DM2 (Appendix Table 1).
The variance, a statistical measure defined as the square of the standard deviation (SD2), was used as a measure of inter-day glucose variability, for both fasting and postprandial (2 h after breakfast) glucose variations [10]. This statistical measure demonstrates the extent of variability by taking into account the mean of glucose values.
The box-plot diagrams of HbA1c according to Q1-Q4 of variances of fasting and postprandial glucose values were used to show how HbA1c values depend on degrees of glucose variability (Figure 1). The Kolmogorov-Smirnov test was used to calculate Q1-Q4 differences.
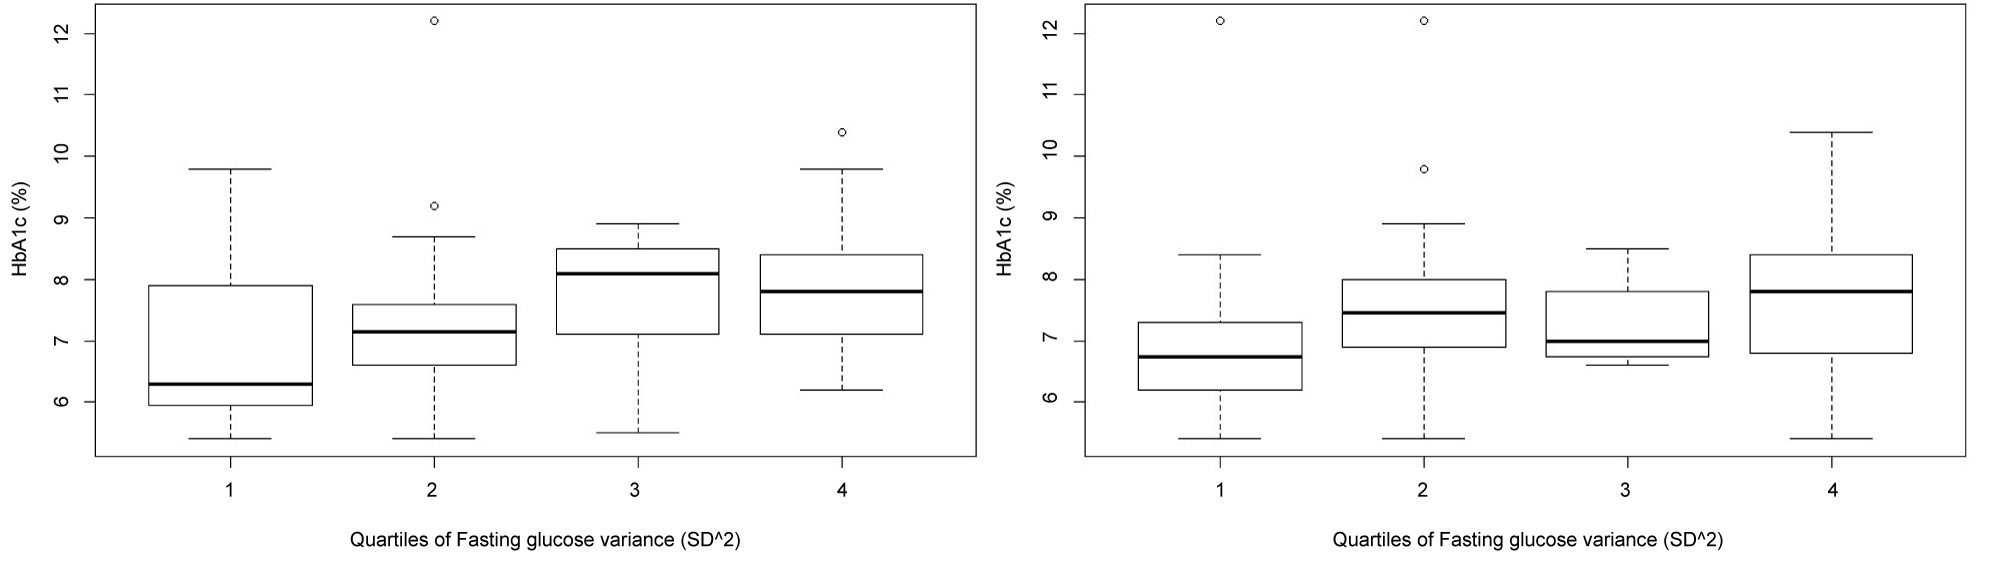 Figure 1: Associations between fasting glucose variance (SD^2) and HbA1c (left) and between postprandial (2 hr after breakfast) glucose variance (SD^2) and HbA1c (right). Q1-Q4 differences (two-sample Kolmogorov-Smirnov test) (p = 0.002, and p = 0.006).
View Figure 1
Figure 1: Associations between fasting glucose variance (SD^2) and HbA1c (left) and between postprandial (2 hr after breakfast) glucose variance (SD^2) and HbA1c (right). Q1-Q4 differences (two-sample Kolmogorov-Smirnov test) (p = 0.002, and p = 0.006).
View Figure 1
Managing older individuals with multiple medical conditions, such as those with DM2, is as dealing with the complex system [18]. In statistical terms, this means non-linear associations, interdependence, collinearity, and networking between the variables. By contrast, classical multiple linear regression (MLR) models are based on the assumptions of independence of the input variables, linearity between dependent and independent variables, normality of the residuals, and the absence of endogenous variables [15].
As there was a need to use more robust regression models, for which there are no theoretical constraints for data modelling, we have performed the artificial neural networks (ANN) algorithm of machine learning (ML) methods [19]. The variances of fasting and postprandial blood glucose measurements were used as the output measures.
The artificial neural networks (ANN) method is known to be robust and to not require strong assumptions on the distributions and interdependence of the predictors. It uses a multi-layered structure to imitate the multiprocessing of biological networks [19]. The ANN model for predicting increased HbA1c (≥ 7.0%) was performed to serve as the benchmark. A specific type of ANN method used in this study was the multilayer perceptron (MLP).
In searching for the most accurate model, different numbers of hidden units, varying from 1 to 20, were used in ANN architectures with one hidden layer or two and three hidden layers.
Due to the large number of variables used for participants' description, the variable reduction procedure was conducted using the Spearman's rank correlation coefficient and the best-first search algorithm [20]. This algorithm selects the subsets of input variables and cross-validates the model by training and testing. Based on this procedure, the number of input variables was significantly reduced: to 12 predictors for fasting glucose variability as an output; to 10 predictors for postprandial glucose variability as an output; and to 16 predictors for HbA1c as an output (Figure 2 and Figure 3).
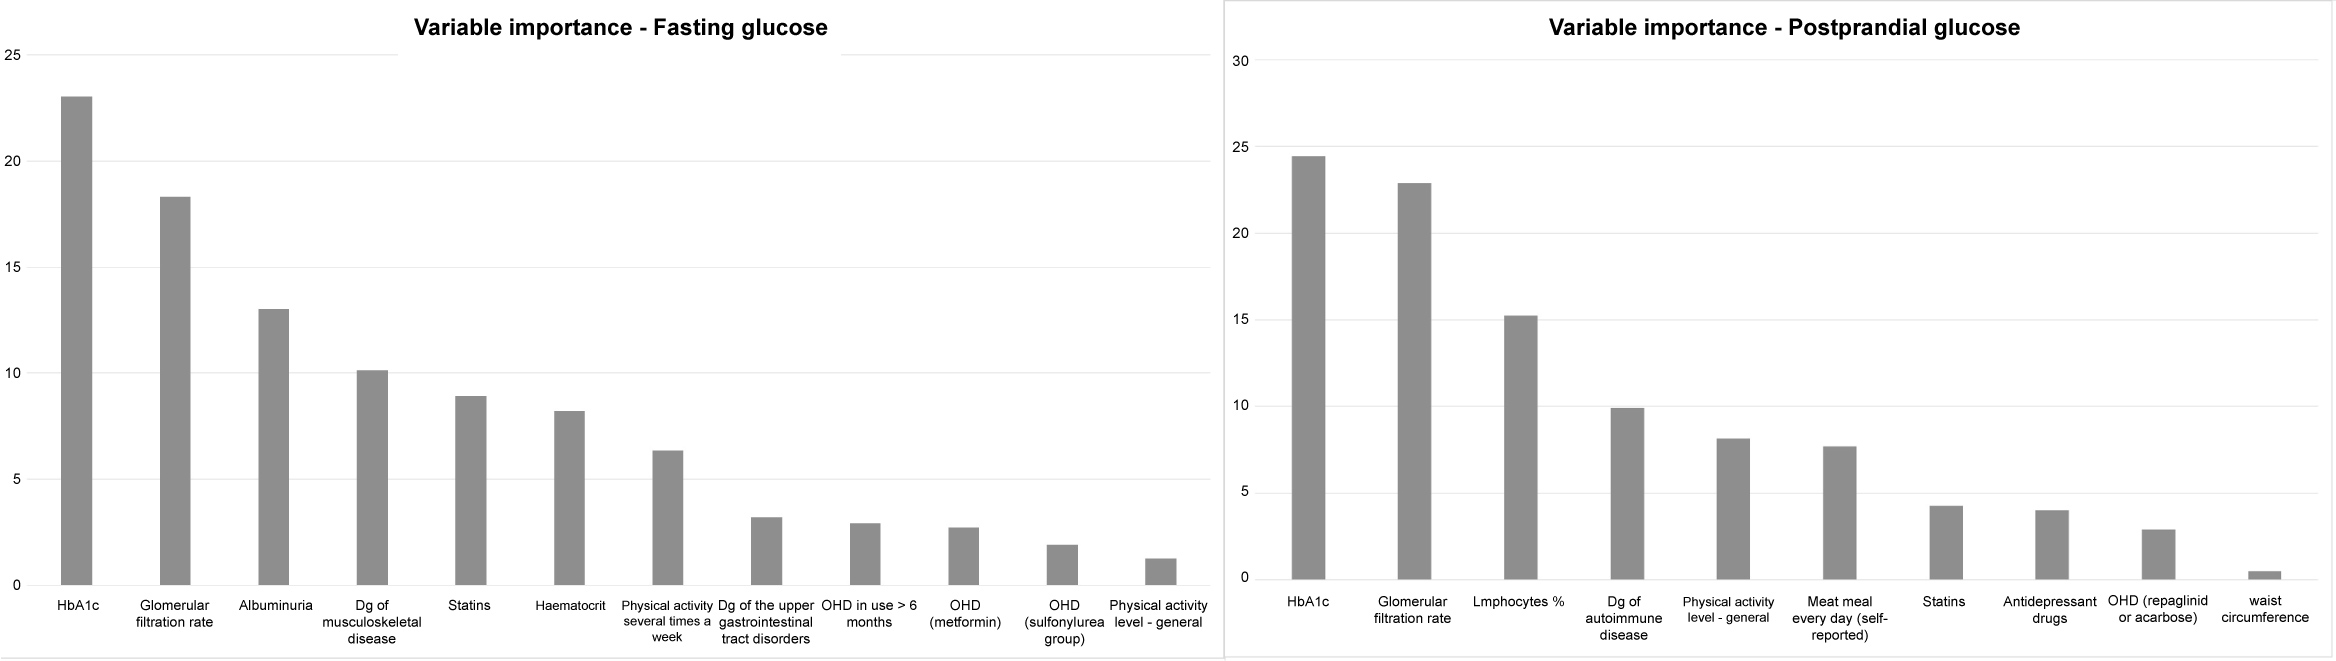 Figure 2: Variable importance of ANN model of fasting glucose variability (left) and postprandial (2 hr after breakfast) glucose variability (right).
View Figure 2
Figure 2: Variable importance of ANN model of fasting glucose variability (left) and postprandial (2 hr after breakfast) glucose variability (right).
View Figure 2
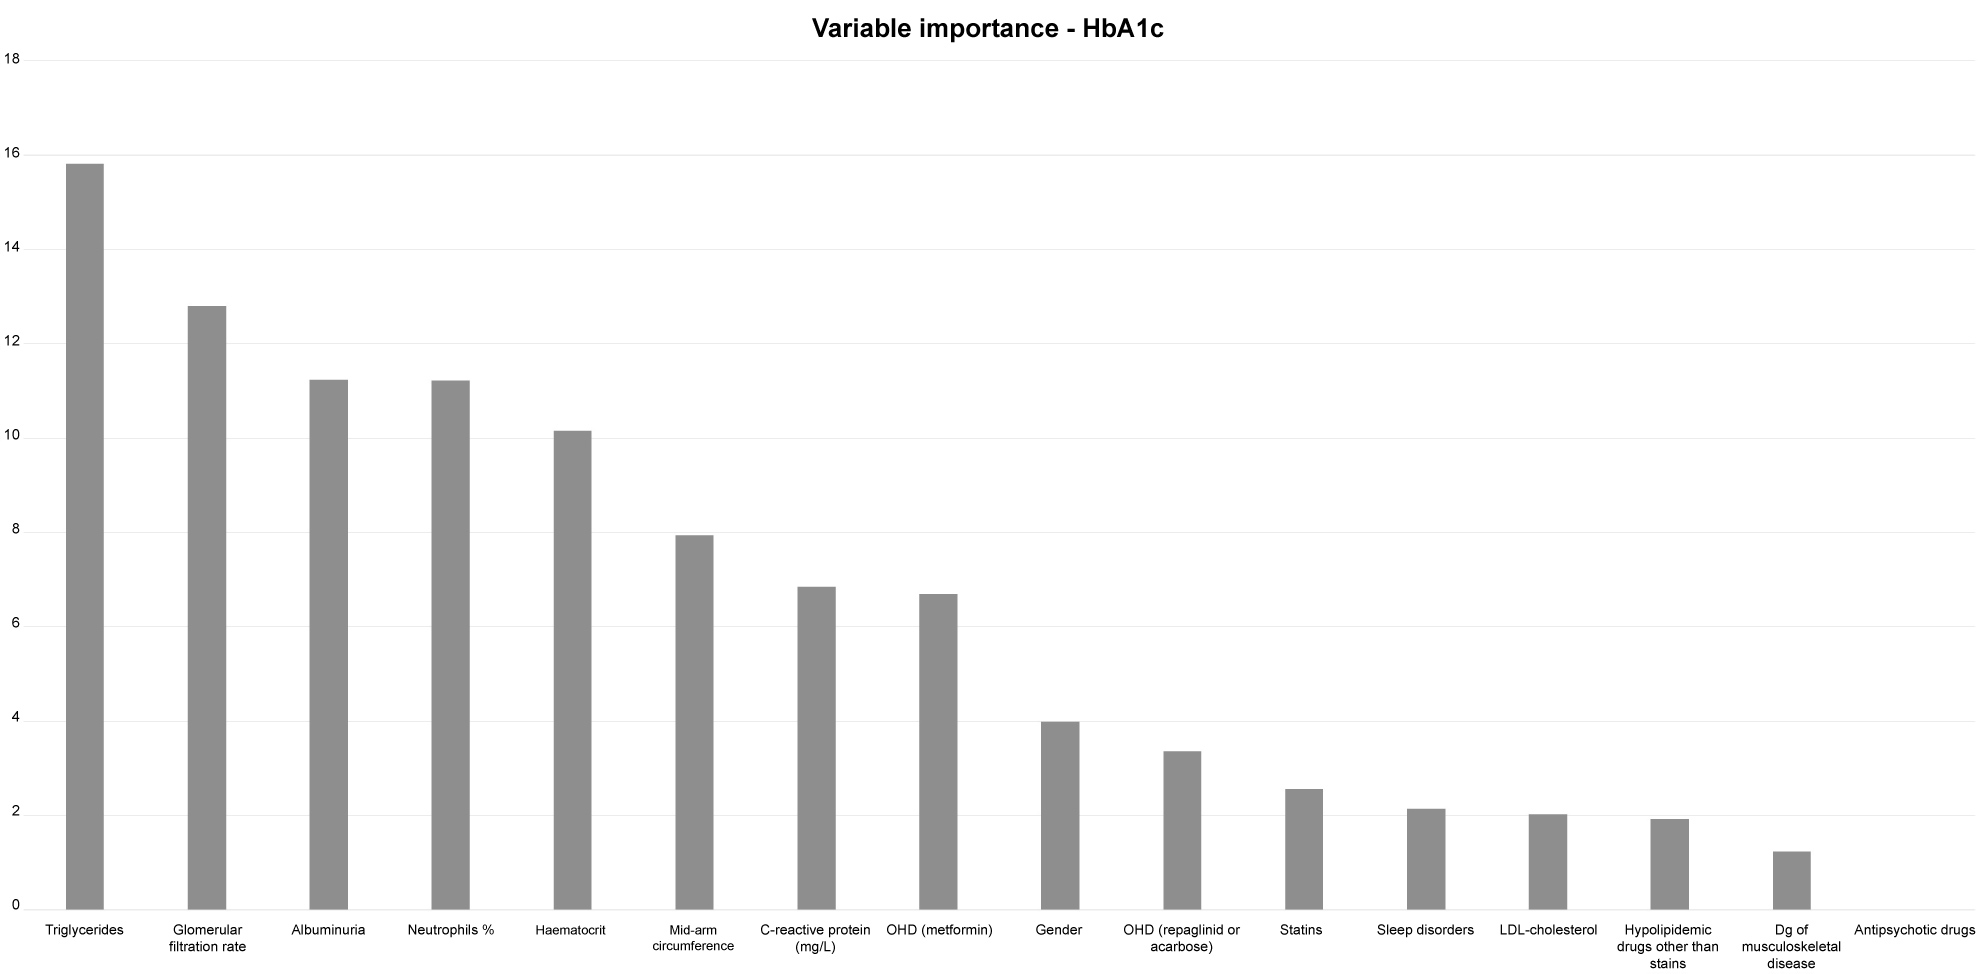 Figure 3: Variable importance of ANN model of increased HbA1c.
View Figure 3
Figure 3: Variable importance of ANN model of increased HbA1c.
View Figure 3
The cross-validation procedure is a re-sampling method, used to evaluate the performance of ML models when the amount of data is limited [19]. It provides a model with the opportunity to train on multiple train-test splits, i.e. to predict how well the model will perform on unseen data. The data is separated into two sets, called the training set and the testing set. The predictive model built on the training set is validated on the test set. In our study, we used the 70:30 partition ratio. The variable importance procedure was conducted on all three ANN models (Figure 2 and Figure 3). In both models of glucose variability, the two top-ranked variables were the same, indicating HbA1c and glomerular filtration rate, a marker of reduced renal function (Figure 2).
The MLR models were performed on the selected variables, to compare to the predictive accuracies of ANN models (Table 1).
For testing differences between the models, the minimum mean squared error (MSE), and a more explanatory symmetric mean average percentage error (SMAPE), were used (Table 2) [21]. The SMAPE is an average of the absolute percentage errors, although these errors are computed using a denominator representing the average of the predicted and observed values. The SMAPE has an upper limit of 200%, offers a well-designed range to judge the level of accuracy, and is less strongly influenced by extreme values. The lowest value shows the best model.
The Q4 of fasting or postprandial glucose variance, compared to Q1, is considered as a higher level of glucose variability.
A considerable part of subjects in Q1 of fasting glucose variance had HbA1c values which are within the range of normal HbA1c values, while a majority of subjects in Q4 had increased HbA1c values (≥ 7%). The Q1-Q4 difference was statistically significant (p = 0.002) (Figure 1, left).
An association between Q1-Q4 of postprandial glucose variance and HbA1c, also showed statistically significant difference (p = 0.006) (Figure 2, right). Compared to Q4 of fasting glucose variance, in Q4 of postprandial glucose variance, more subjects had HbA1c values which are within the range of normal HbA1c values.
Based on the variable reduction procedure, for fasting glucose variability, the number of variables for modelling by the ANN method, was reduced to twelve. Those were variables indicating:
HbA1c, glomerular filtration rate, albuminuria, dg of musculoskeletal disease, use of statins, haematocrit, physical activity every day, dg of upper gastrointestinal tract disorders, more than 6 months use of OHD, use of metformin, use of sulfonilurea group drugs, and physical activity level in general good.
The number of selected predictors in ANN model of postprandial glucose variability was ten, indicating: HbA1c, glomerular filtration rate, lymphocyte %, dg of autoimmune disease, activity level in general good, eating meat every day, statins use, use of antidepressant drugs, use of repaglinid or acarbose, and waist circumference.
For ANN model of increased HbA1c, there were sixteen predictors, indicating:
triglycerides, glomerular filtration rate, albuminuria, neutrophil %, haematocrit, mid-arm circumference, C-reactive protein, use of metformin, F gender, use of repaglinid or acarbose, use of statins, sleep disorders, LDL-cholesterol, hypolipidemic drugs other than statins, dg of musculoskeletal disease, and antipsychotic drugs.
Figure 2 and Figure 3 show the importance order of input variables of three ANN models.
It can be seen that the first two-ranked variables are the same in both ANN models of glucose variability, indicating HbA1c and glomerular filtration rate (Figure 2, left).
The third-ranked variable in ANN model of fasting glucose variability indicate albuminuria, while in ANN model of postprandial glucose variability, on the third position is a variable indicating lymphocyte % (Figure 2, right).
In ANN model of increased HbA1c, the top-ranked variables indicate triglycerides, glomerular filtration rate, albuminuria, and neutrophil % (Figure 3).
Results of assessing predictive accuracies of ANN models have shown that the accuracy is better when predicting increased HbA1c than when predicting glucose variability, with MSE = 0.17, and SMAPE = 1.47% (Table 2).
No one of variables in either of the two MLR models of glucose variability showed significance as an independent predictor of glucose variability (Table 1).
Table 1: Multiple linear regression models predicting fasting and postprandial glucose variability and HbA1c. View Table 1
The predictive power of MLR model of fasting glucose variability was MSE = 2.47, and SMAPE = 69.50%. For MLR model of postprandial glucose variability, the predictive power was MSE = 6.79, and SMAPE = 9.64% (Table 2).
Table 2: Results of testing differences in prediction accuracies between the created ANN, and MLR models. View Table 2
The MRL model of increased HbA1c showed better predictive accuracy than the previous two, with MSE = 1.66, and SMAPE = 13.44% (Table 2). Some variables, like those indicating neutrophil %, F gender, and therapy with metformin, were significant at the level of 0.05 (Table 1).
This preliminary research showed that it is possible, in individuals with DM2 and receiving OHDs, by using routinelly collected data from PC eHRs, to identify predictors of a higher risk for long-term negative outcomes. A ML-based approach (ANN models) was used to model data describing many clinical characteristics of participants. The classical MLR method was used to check the predictive accuracy of variables selected in ANN models.
Both type of methods were more successful in predicting increased HbA1c than in predicting glucose variability. The reason may be the fact that the outcome measure, used to indicate glucose variability, lacks standardisation regarding cut-off values that would be complementary to the threshold of increased HbA1c. The only statistical measure for which it was done, is a coefficient of variation (CV%), with the cut-off of 36% [12]. To create the adequate model, a large sample would be necessary.
Although both type of models (MLR and ANN) were based on the same set of selected variables, ANN models, especially that indicating increased HbA1c, showed as to be preferable over MLR models (Table 2). In addition, the variable importance procedure, performed on ANN models, has enabled better insights into clinical contexts (Figure 2 and Figure 3). That ML methods are suitable for issues for which there is a need to cope with the biological complexity, we know from our previous research [22,23].
The study results indicate that two type of measures of glycaemic control, HbA1c, and variances of fasting and postprandial glucose measurements, are partially complementary to each other. One implication is that both measures should be used for risk prediction, The recent longitudinal study demonstrated that individuals with higher visit-to-visit variability of glycaemia (based on measuring CV) have an increased risk of developing micro- and macrovascular complications and mortality [24]. Another implication of the complementarity between the outcome measures is that HbA1c-based model and glucose variability-based models share common sets of variables.
In this terms, results of QQ analysis showed that the principle, the higher variances of fasting and postprandial glucose, the higher HbA1c, is only partly true, as there are participants with a higher glucose variability (Q4) who do not have increased HbA1c, and vice versa, a considerable part of those with increased HbA1c are at a lower level of glucose variability (Q1) (Figure 1). In addition, from models indicating increased HbA1c, it can be seen that HbA1c might be influenced by other factors than the level of glucose exposure (Table 1 and Figure 3). And oppositely, glucose variability measures are likely to be influenced by a wide range of factors, each having a small contribution but neither reaching a power as an independent predictor, thus demonstrating a behaviour as a complex system (Table 1 and Figure 2). Among these factors, HbA1c plays an important role (ANN models of glucose variability) (Figure 2) but still not as a dominating, independent predictor (MLR models of glucose variability) (Table 1).
Evidence suggests chronic renal impairment as a comorbid condition which attenuates HbA1c as a measure of glycaemic control by weakening its association with mean glucose values [25]. This is also associated with higher dispersion of mean glucose value patterns and thus with increased glucose variability [26].
Chronic renal impairment in older adults is a consequence of comorbidities of diabetes and related metabolic and cardiovascular (CV) disorders, which, in turn, has an effect on changes in body shape and whole-body homeostasis, by mechanisms such as chronic inflammation, protein catabolism and malnutrition [27]. The hallmark of diabetes related renal impairment is albuminuria, which is also known as an independent CV risk factor [28]. By mechanisms such as chronic inflammation and disturbed rheology, chronic renal impairment may futher worsen insulin resistance and glucose related metabolism [29].
All these pieces of evidence, indicating a pathophysiology scenario which can be described as chronic renal impairment - chronic inflammation - disturbed blood rheology, are likely to be suggested by the top ranked variables in ANN models. These variables include: triglycerides, glomerular filtration rate, albuminuria, neutrophil %, haematocrit, mid-arm circumference, and C-reactive protein (in ANN-HbA1c model) (Figure 3); glomerular filtration rate and albuminuria (in ANN-fasting glucose variability model) (Figure 2); and glomerular filtration rate and lymphocyte % (in ANN-postprandial glucose variability model) (Figure 2). The neutrophil-to-lymphocyte ratio has recently been recognised as a marker of chronic renal impairment, and as a good measure of glycaemic control, being comparable to HbA1c [4,30]. The importance of this derived parameter is likely to be highlighted by these results, and especially with the result of MLR-HbA1c model, which indicates the variable "neutrophil %" as an independent predictor (Table 1).
The small predictive power of variables selected in the created models is in contrast to the models' satisfactory performances. This is especially case in ANN-HbA1c model, which is characterised with very good predictive performances (small errors). It is therefore reliable to use sets of complementary variables to describe particular contexts, than to realise the meaning of the single variables. Considered this way, several sets of variables other than those indicating chronic renal impairment, although with a minor predictive power, can be also recognised in the ANN models. These sets of variables can be labelled as: drugs, comorbidities, and lifestyles.
The variables indicating drugs include old-fashioned OHDs, such as metformin, repaglinid/acarbose and sulfonilurea-group OHDs, as well as statins, hypolipidemic drugs (all three ANN models) (Figure 2 and Figure 3). The choice of pharmacological treatment may be of the special importance for its effect on fasting glucose variability, and specifically in individuals with a long-term diabetes duration (the variable "OHDs in use of more than 6 months") (ANN model of fasting glucose variability) (Figure 2). Although there are no clear recommendations for pharmacological treatment of older individuals with DM2 and chronic renal impairment, an awareness is rising on the exceptional complexity of these individuals, and the need for their individualised treatment and careful monitoring [31]. A special attention is also needed to those who in addition use antidepressants and antipsychotic drugs, due to the side effects of these drugs on glucose related metabolism (Figure 2 and Figure 3) [32].
The comorbidities suggested by ANN models are musculoskeletal diseases, including also rheumatoid arthritis, a commonly found inflammatory joint disease in older population (the variable "autoimmune disease", in ANN model of postprandial glucose variability), together with the upper gastro-intestinal tract disorders and sleep disorders (Figure 2 and Figure 3). Musculoskeletal diseases are less frequent than CV and metabolic disorders but still make a prominent part of the comorbidity patterns of patients with DM2 [33]. The association with frailty and sleep disorders, due to chronic pain, are factors which may relate musculoskeletal diseases to higher risk of DM2 complications [34].
Of lifestyle behaviours, our results suggest the importance of physical activities for glucose variability, in particular for fasting glucose variability, as more sensitive to hypoglycaemic events (the variables "physical activities - general" and "physical activities - every day") (ANN models of fasting and postprandial glucose variability) (Figure 2) [6].
Models of glucose variability can be created using data from PC eHRs, to help PC providers recognising clinical profiles of individuals with DM2, and on treatment with OHDs, who might be at higher risk for negative outcomes. As model outcome measures, sporadically recorded visit-to-visit fasting and postprandial (2h after breakfast) glucose measurements, widely available in PC, can be used. All predictive variables showed small contribution to the overall model's predictive power, reflecting the complexity of individuals in the sample. For models, to become useful in a practice, it is necessary that outcome measures are dichotomised and standardised according to the thresholds of HbA1c or some standardised measures of glucose variability, such as the coefficient of variation.
No competing financial interests exist.
The study was partially supported by the University of Osijek and the Faculty of Medicine, Osijek, Croatia, under the grant No. VIF2106-MEFOS-31, The Slovak Grant Agency of the Ministry of Education and Academy of Science of the Slovak Republic under Grant No. 1/0493/16 and The Slovak Research and Development Agency under Grants no. APVV-16-0213 and no. APVV-17-0550.