Background: HamoglobinE (HbE) is the second commonest structural haemoglobin variant and results from mutation in the β globin gene causing substitution of glutamic acid for lysine at position 26 of the β globin chain. When coinherited with β Thalassemia it becomes a major health burden.
Objective: To assess the effectiveness of red cell parameters as a screening tool to identify haemoglobin E traits and to develop a score using red cell parameters which help to identify Haemoglobin E traits in population screening.
Materials and methods: The study was carried out on 25 Haemoglobin E trait and 25 controls between 20 to 64 years of age. In all the participants' full blood count analysis and Haemoglobin variant analysis were done. Participants were selected after excluding all factors which affect red cell indices such as iron deficiency, vitamin B12 and folate deficiency, pregnancy, liver disease, hypothyroidism, chronic alcohol consumption, Diabetes mellitus, Metformin treatment and recent blood transfusion. Comparative analysis of all haematological parameters done between two groups separately for males and females.
Results: For cases of Haemoglobin E traits the overall mean Haemoglobin A was 67.9 ± 6.4%, Haemoglobin E 27.3 ± 3.7%, Haemoglobin F 0.3 ± 1.1%, Haemoglobin A2 2.6 ± 3.1%, RCC 5.03 ± 0.89 × 10¹²/L, Haemoglobin 12.6 ± 1.9 g/dl, MCV 77.4 ± 9.4 fl, MCH 25.4 ± 3.9 pg, MCHC 32.9 ± 2.1 g/dl, RDW 14.21 ± 4%. Between Haemoglobin E traits and normal controls following haematological parameters showed statistically significant difference. Haemoglobin E (p = 4.83 × 10-53), Haemoglobin A (p = 2.61 × 10-41), Haemoglobin F (p = 0.01), Haemoglobin (p = 0.042), Red cell count (p = 0.001), MCV (p = 4.890 × 10⁻¹²), MCH (p = 5.5 × 10⁻¹³), RDW (p = 0.007). Haemoglobin E percentage showed statistically significant positive correlation with following red cell parameters. Hb E and Red cell count (r = 0.445, t test 0.001), Hb E and Red cell distribution width (r = 0.345, t test 0.014). Haemoglobin E percentage showed statistically significant negative correlation with following indices. Hb E and MCV (r = (-) 0.76, t test 0.000) Hb E and MCH (r = (-)719, t test 0.000). Correlation of Haemoglobin E percentage with MCHC and Haemoglobin were not statistically significant (r = (-) 0.251, t test 0.078) and (r = (-)0.116, t test 0.424). In addition Hb E percentage negatively correlated with Hb A percentage (r = (-)0.917, t test 0.000) and positively correlated with Hb A2 percentage (r = 0.286, t test 0.044), and Hb F percentage (r = 0.366, t test 0.009). Sensitivity of a score as above to select patients for screening, using a cut off score of 2 or above for females and a score of 3 or above for males was 84%. Specificity was 100%. This is higher than if using the current criteria. If people with red cell count > 5 × 10¹²/L were also selected sensitivity would increase up to 84%, and negative predictive value to 86%.
Conclusion: Even when MCV and MCH are normal, people should be screened to exclude haemoglobin E hetrozygosity, if red cell count or RDW is higher than the reference range for the age. Furthermore, clinicians can apply a score as defined above and select patients for screening. Therefore a screening tool using red cell parameters would be cost effective in hospital settings as well as for mass screening programmes.
Hemoglobin E, Hb E, Heterozygosity for haemoglobin E, Hb E trait
Hb: Haemoglobin; RCC: Red Cell Count; MCV: Mean Corpuscular Volume; MCH: Mean Corpuscular; MCHC: Mean Corpuscular Haemoglobin Concentration; RDW: Red Cell Distribution Width
HamoglobinE (HbE) is the second commonest structural haemoglobin variant after Haemoglobin S with a mutation in the β globin gene causing substitution of glutamic acid for lysine at position 26 of the β globin chain [1]. The β chain of HbE (βE) is synthesized at a reduced rate compared with that of normal adult Haemoglobin (Hb A). This is because the mutation creates an alternate splicing site within an exon. This results in a reduced rate of synthesis of βE chain and therefore of HbE, and consequently heterozygotes, compound heteozygotes and homozygotes show some β thalassemic features. Hb E may therefore be regarded as a β+ thalassemic haemoglobinopathy with both qualititative and quantitative defects [1]. Hb E is common in South-East Asia, with a prevalence of 30-40% [2]. Sri Lanka is also recognized as a country with high prevalence of Hb E gene, and Kurunegala, Anuradhapura and Batticaloa are the areas with the highest prevalence [3]. Sri Lankan ancestors, the Veddas are also known to have a high prevalence of Hb E [4].
Hb E may be present in the heterozygous states (genotype AE or haemoglobin E trait), the homozygous state (genotype EE or haemoglobin E disease) and a variety of compound heterozygous status such as haemoglobin E β Thalassemia (E/β Thal), sickle cell/haemoglobin E disease (SE genotype). Hb E trait is defined as a heterozygous condition associated with one normal adult haemoglobin (HbA) β gene and one variant haemoglobin E β gene. Subjects who are heterozygous for Hb E have an asymptomatic condition but increased susceptibility to oxidant induced haemolysis [4]. When Hb E gene coinherits with β thalassemia gene a severe disease which need regular transfusions may be the result, causing Thalassemia intermedia or Thalassemia major phenotype. Subjects with these conditions can develop iron overload due to regular blood transfusions as well as increased iron absorption which is the main cause of morbidity and mortality. Despite treatment, quality of life remains lower in these patients with significant need for financial and medical resources.
Most individuals with Hb E trait have increased red cell count (RCC), reduced mean corpuscular volume (MCV) and mean corpuscular haemoglobin (MCH), normal or increased MCHC with or without mild anaemia. Haemoglobin usually does not fall below 12 g/dl. And some have a normal blood count including normal MCV. It is not uncommon for individuals with Hb E trait to also have a deletion of one or two ɑ genes. However, even those with a full complement of ɑ genes may be microcytic and mildly anaemic [4].
The blood film of Haemoglobin E traits usually show hypochromic microcytic red cells with target cells and irregularly contracted cells. There are different methods to detect haemoglobin E. Haemoglobin electrophoresis at alkaline pH shows that the variant haemoglobin has the same mobility as haemoglobin C and A2. On Citrate agar or agarose gel at acid pH, the mobility of haemoglobin E is as same as Hb A and A2. On High performance liquid chromatography (HPLC) it is easily separated from Hb A and C but coelutes with HbA2. On isoelectric focusing, it is well separated from Hb A and moves close to haemoglobin C and A. In haemoglobin capillary electrophoresis Hb E, HbA and HbA2 percentages are separately given as there is no coelution. However amount Hb A2 may be slightly elevated in Hb E trait when detected by haemoglobin capillary electrophoresis. This is due to the fact that haemoglobin E is a structural form of β Thalassemia. Consequently, at least a relative increase in the amount of Hb A2 in such cases would be expected [5]. Haemoglobin E can be also detected by immunoassay [6]. For this study Haemoglobin capillary electrophoresis method was used as there was no coelution in Hb A2 and HbE.
In haemoglobin E heterozygotes, the variant usually comprises 30% or less of total haemoglobin. More than 39% of haemoglobin E suggests the diagnosis of E β Thalassemia [4]. Individuals with less than 25% of haemoglobin E almost always have a coexisting ɑ thalassemia trait [7]. Coexisting Hb H disease may lower Hb E sometimes as low as 10%. The percentage of Hb E can also be lowered by coexisting iron deficiency [7].
Haemoglobin E is slightly unstable on heat and isopropanol stability tests. Red cell protoporphyrin, often used as a screening test for iron deficiency, can be elevated in haemoglobin E heterozygosity. The osmotic fragility of red cells is reduced. Pyrimidine 5'nucleotidase 1 is reduced to levels comparable with those seen in heterozygotes for inherited deficiency [4].
Although Hb E trait is an asymptomatic condition, in countries with high prevalence of β Thalassemia trait, the possibility of having Hb E/β Thalassemia offsprings is high if one parent is Hb E trait [2]. Therefore identifying Hb E trait is important.
Main aim of Thalassemia screening programmes is to identify β thalassemia traits, and not focused on detecting Hb E traits. In National Thalassemia screening programme of Sri Lanka cut off values of MCV of 80 fl and MCH of 27 pg is used as selection criteria. And samples from people with red cell indices below these values are further tested by capillary haemoglobin electrophoresis or high performance liquid chromatography (HPLC) to confirm or rule out presence of haemoglobinopathy by quantifying different types of haemoglobin present in each individual. People with red cell indices above these values are not further tested unless as a family screening or partner screening. Although these cut off values are mainly focused to detect β Thalassemia traits, their role in identifying Haemoglobin E traits are not clearly shown except in few studies. Since some Hb E traits are known to have normal red cell indices and they may be missed if these cut off values are used for selection.
Thus our study was focused on identifying red cell parameter characteristics in Haemoglobin E traits and to test whether there is a significant correlation with Hb E peak levels and to evaluate the effectiveness of these parameters as a screening tool to detect Haemoglobin E heterozygosity. In the existing Thalassemia screening programme apart from MCV and MCH other red cell indices are not considered as selection tools. This study also aim at identifying importance of other red cell parameters as screening tools to detect Haemoglobin E traits.
We expected to identify a red cell parameter or parameters that can be used in population screening to identify Hb E heterozygosity, and develop a score which can be included in the National Thalassemia Screening Programmes for detection of Hb E traits especially in areas of high prevalence.
While planning the sample selection criteria we identified other factors which could affect red cell parameters. These were iron deficiency, pregnancy, vitamin B12 or folate deficiency, other comorbidities as liver disease, hypothyroidism, chronic obstructive pulmonary disease and patients with uncontrolled diabetes mellitus or who are on Metformin, chronic alcoholism and recent red cell transfusions. Therefore, people with these factors were excluded from the study. Furthermore, it is known red cell parameters can vary slightly even in the same patient when assesses by different analyzers. Therefore, we performed all Full Blood Counts of the test and control population using same analyzer. We ensured that the internal quality control and external quality control of the analysis was maintained throughout this period.
Selection of people who were referred for thalassemia screening was done according to the mean corpuscular volume (MCV) and mean corpuscular haemoglobin (MCH) obtained from full blood count done using Beckman Coulter five part full blood count analyzer. This was a fully automated instrument which utilizes the coulter principle and the other calculation methods to derive parameters in full blood count [8]. Two milliliters of blood collected in to dipotassium ethylenediamine tetraacetic acid (K2 EDTA) was the preferred sample and samples analyzed within 2 hours in room temperature or 24 hours in temperature of 40 °C and Haemoglobin and red cell indices including red cell count (RCC), mean corpuscular volume (MCV), mean corpuscular haemoglobin (MCH), mean corpuscular haemoglobin concentrate (MCHC), red cell distribution width (RDW) were analysed for patient and control samples.
This study was carried out as a cross sectional study until 25 Hb E traits according to following inclusion criteria were met. Same number of males and females who were age and sex matched and had normal red cell indices and normal Haemoglobin capillary electrophoresis results were selected as the control group.
Both males and females between 20 to 64 years of age and whose full blood count analyzed using fully automated Beckman Coulter five part FBC analyzer and with Haemoglobin E percentage equal or more than 25% and equal or less than 39% (i.e. 25%-39%) with Hb A more than or equal to 50% on Haemoglobin capillary electrophoresis done using Sebia minicap capillary electrophoresis machine [4].
Similar number of males and females in the age range of 20-64 years whose full blood count done from same above analyzer and capillary haemoglobin electrophoresis results showing no variant haemoglobin or quantitative abnormality in haemoglobin percentage. These people were screened as family screening or partner screening.
1. People with Haemoglobin E less than 25% or more than 39% [4].
2. People with iron deficiency - defined as serum ferritin equal or less than 30 ng/ml in both males and females [9].
3. Pregnant mothers.
4. People less than 20 years or more than 64 years. (As WHO defines > 65 years as elderly age adolescent age as < 20 years).
5. People who were pure vegetarians.
6. Diagnosed patients with liver disease, hypothyroidism, chronic obstructive pulmonary disease and patients with uncontrolled diabetes mellitus or who were on Metformin which are known factors that increase Mean corpuscular volume.
7. Chronic Alcohol users.
8. People with MCV > 100 fl.
9. Patients who received red cell transfusion with in past 3 months.
10. Previous diagnosis of Hb E trait coexisting with other haemoglobin variant or variants.
11. Full blood count done by a different analyzer.
Sample size was calculated using a formula for detecting mean difference in two samples [10]. Mean values for MCV, MCH and RDW in Hb E trait subjects obtained from previous studies were 72.8, 24.8 and 14.3 respectively. Standard deviation values for these variables in this group were 12.2, 3.7 and 2.3 respectively [11]. For a control group with normal haemoglobin capillary electrophoresis mean MCV, MCH and RDW values were 77.3, 28.2 and 14.8 respectively. Standard deviation values for these variables were 10.2, 2.7 and 1.2 respectively [11]. 212 participants with Hb E heterozygosity and 212 paticipants as a control group are needed to detect a significant difference with power of 80% at 95% confidence level.
However according to the inclusion criteria this study was designed to conduct as a pilot study including 25 Haemoglobin E trait and 25 control subjects. These Hb E trait people and controls were selected according to the above inclusion and exclusion criteria and selected based on the information obtained from their full blood count, Haemoglobin capillary electrophoresis, serum ferritin reports and data obtained from their request forms, histories taken by direct questioning and other relevant records and reports available with them.
Study was carried out in Thalassemia center of National Hospital Kandy in Sri Lanka. Procedures used were safe and carried only a minimal risk to participants. Full blood count analysis, Haemoglobin capillary electrophoresis and serum ferritin were done as per the routine investigations done in the center. Additional investigations were not done. Informed written consent was taken for history taking and utilization of their investigation results for the study the participants.
Statistical analysis was carried out using statistical package for social sciences (SPSS) data analysis software. Descriptive statistics, Mean values, Standard deviations and ranges of haemoglobin, red cell count, MCV, MCH, MCHC and RDW were calculated in the Hb E trait group and the control group separately for males and females (Table 1). Mean for each red cell parameter between these two groups depending on their gender was tested to find out any statistical significance using t-test. Statistically significant p value was considered as < 0.05. Column charts for each parameter for males and females were constructed (Figure 1).
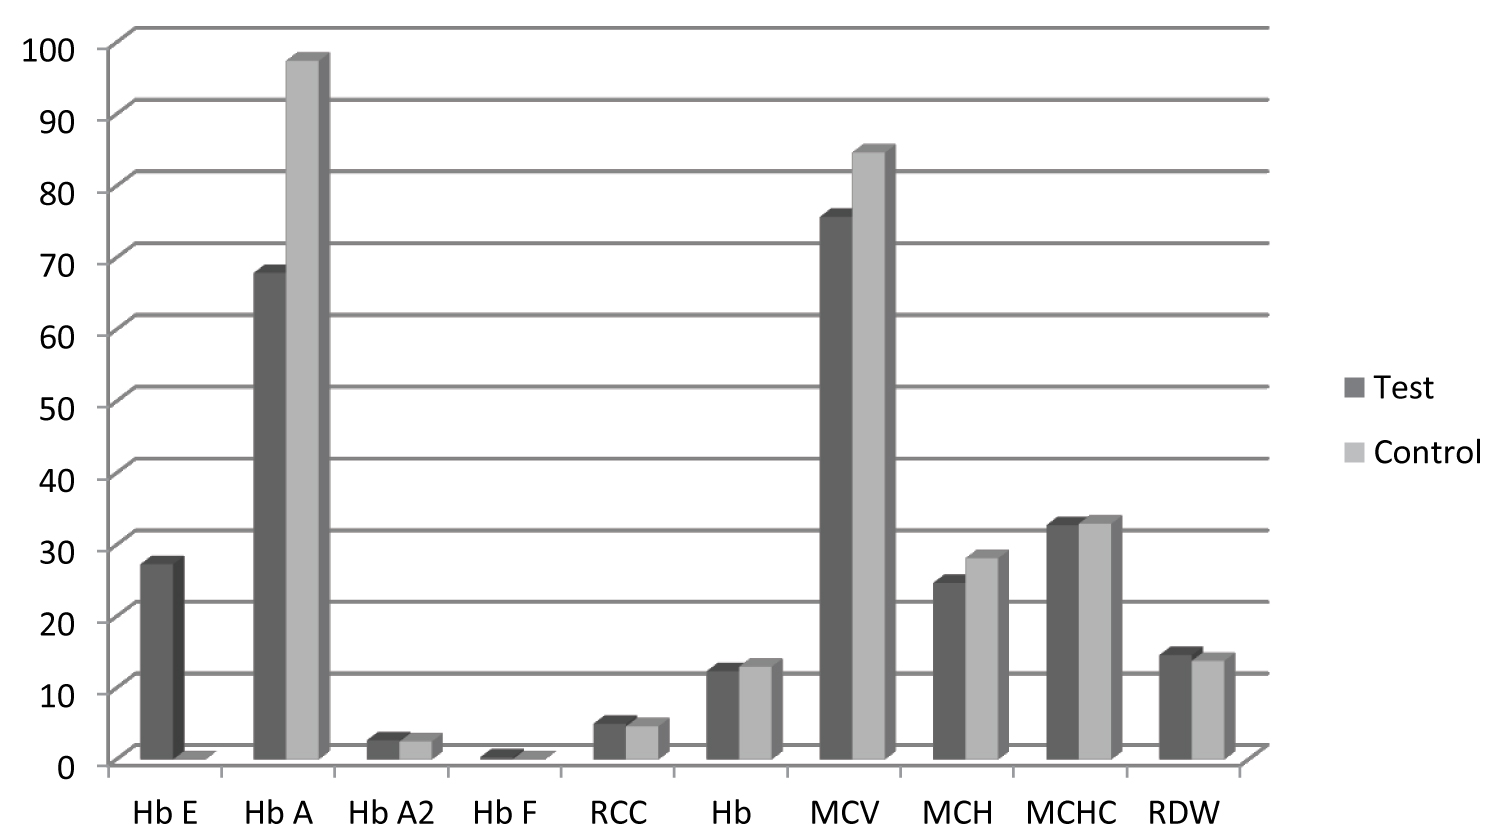 Figure 1: Mean haematological parameter values of Haemoglobin E traits (test) and controls. View Figure 1
Correlation between each red cell parameter and Haemoglobin E percentage was analyzed using Spearman Correlation coefficient. Variables that were highly correlated were identified. Correlation results were presented in scatter plots with trend lines and significance test that slope is zero was calculated using SPSS data analysis software (Figure 2).
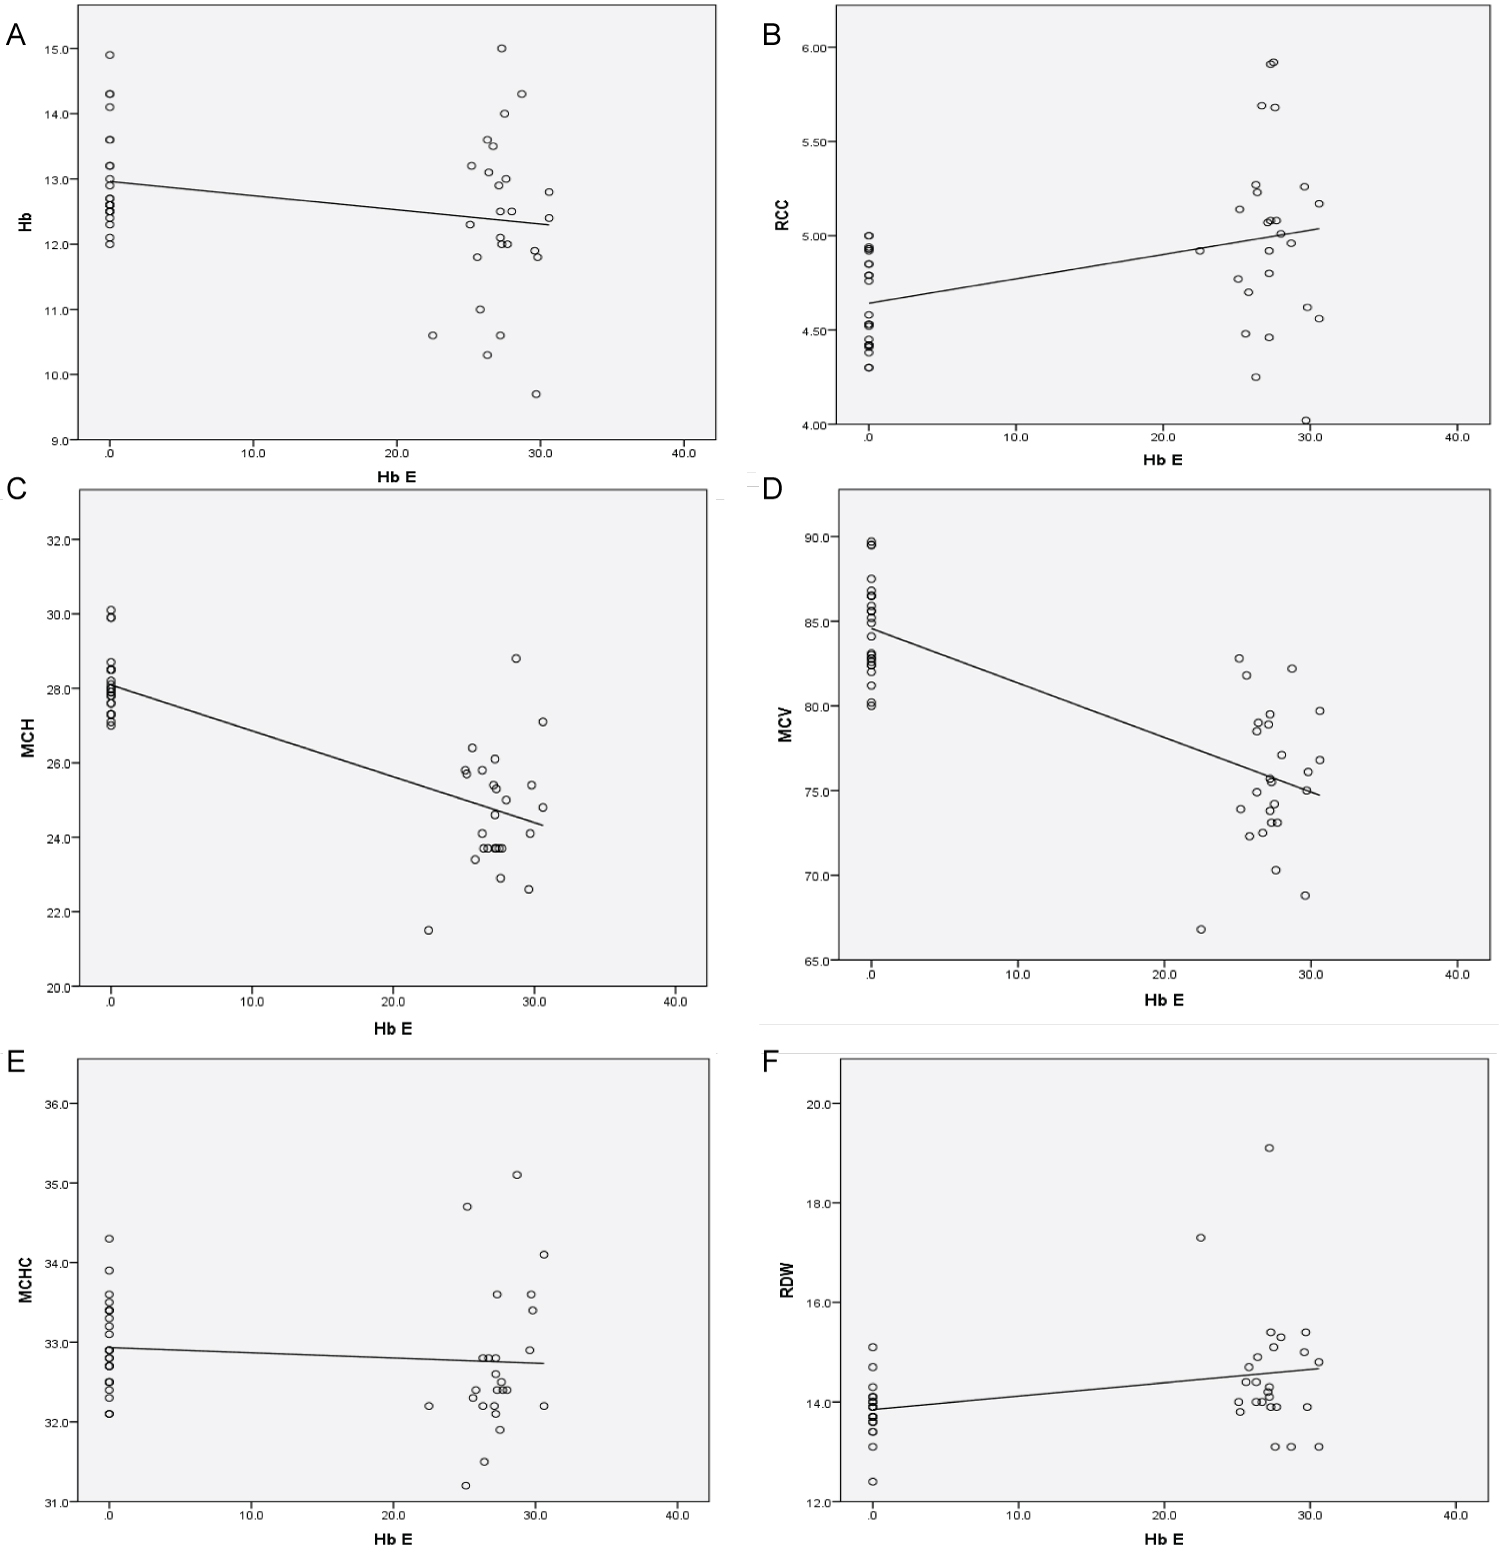 Figure 2: Correlation between Hb E percentage and different red cell indices (a) Correlation between Hb E percentage and and Haemoglobin (Hb); (b) Correlation between Hb E and Red cell count (RCC); (c) Correlation between Hb E and Mean corpuscular haemoglobin (MCH); (d) Correlation between Hb E and Mean corpuscular volume (MCV); (e) Correlation between Hb E and Mean corpuscular haemoglobin concentration (MCHC); (f) Correlation between Hb E and Red cell distribution width (RDW). View Figure 2
A score that can be used as a tool to identify Haemolobin E traits in population screening was generated using red cell parameters. A score of one or zero was given to each parameter depending of their variation from mean value of sex matched control parameters. Then by using sum of scores, an average score for Hb E traits was calculated for males and females separately (Table 2). Sensitivity, specificity, negative predictive value and positive predictive value for this average score, if it is used as a screening tool were calculated.
There were 15 females and 10 males in the age range of 20 to 64 years in both test and control groups. Test group was diagnosed Haemoglobin E carriers (traits) and control group was people with no qualititative or quantitative defects in Haemoglobin by Haemoglobin capillary electrophoresis. Haemoglobin A, Haemoglobin E, Haemoglobin A2, Haemoglobin F percentages according to haemoglobin capillary electrophoresis and red cell parameters as red cell count (RCC), haemoglobin concentration (Hb), mean corpuscular value (MCV), mean corpuscular haemoglobin (MCH), mean corpuscular haemoglobin concentration (MCHC), and red cell distribution width (RDW-CV), were noted in all participants.
For cases of Haemoglobin E traits the overall mean Haemoglobin A was 67.9 ± 6.4%, Haemoglobin E 27.3 ± 3.7%, Haemoglobin F 0.3 ± 1.1%, Haemoglobin A2 2.6 ± 3.1%, RCC 5.03 ± 0.89 × 10¹²/L, Haemoglobin 12.6 ± 1.9 g/dl, MCV 77.4 ± 9.4 fl, MCH 25.4 ± 3.9 pg, MCHC 32.9 ± 2.1 g/dl, RDW 14.2 ± 1.4%. The sex-wise haematological data of Haemoglobin E traits are illustrated in Table 1. None of the Haemoglobin variant levels showed statistically significant difference between males and females in test group (p > 0.05). Haemoglobin level showed statistically significant difference between males and females using t test (0.049). Other parameters showed no statistically significant difference (p > 0.05).
For controls, the overall mean Haemoglobin A was 97.4 ± 0.5%, Haemoglobin E 0 ± 0%, Haemoglobin F 0.02 ± 0.2%, Haemoglobin A2 2.5 ± 0.6%, RCC 4.6 ± 0.4 × 10¹²/L, Haemoglobin 12.9 ± 1.5 g/dl, MCV 84.6 ± 5.5 fl, MCH 28.1 ± 1.6 pg, MCHC 32.9 ± 1.1 g/dl, RDW 13.8 ± 1.0%. The sex-wise haematological data of controls are illustrated in Table 1. None of the Haemoglobin variant levels or red cell parameters showed statistically significant difference between males and females in control group (p > 0.05).
Table 1: Sex - wise haematological data of Haemoglobin E trait and control samples. View Table 1
Between Haemoglobin E traits and normal controls following haematological parameters showed statistically significant difference using t test. Haemoglobin E (4.83 × 10-53), Haemoglobin A (2.61 × 10-41), Haemoglobin F (0.01) and among red cell parameters Haemoglobin (0.042), Red cell count (0.001), MCV (4.890 × 10⁻¹²), MCH (5.5 × 10⁻¹³), RDW (p = 0.007). Other Haematology parameters did not show any statistically significant difference. Haemoglobin A2 (0.6) and MCHC (0.29). Statistically significant level was taken as p < 0.05. Haemoglobin E percentage showed statistically significant positive correlation with following red cell parameters. Hb E and Red cell count (r = 0.445, t test 0.001), Hb E and Red cell distribution width (r = 0.345, t test 0.014). Haemoglobin E percentage showed statistically significant negative correlation with following indices. Hb E and MCV (r = (-) 0.76, t test 0.000) Hb E and MCH (r = (-) 0.719, t test 0.000). Correlation of Haemoglobin E percentage with MCHC and Haemoglobin was not statistically significant (r = (-) 0.251, t test 0.078) and (r = (-) 0.116, t test 0.424). In addition HbE percentage negatively correlated with Hb A percentage (r = (-) 0.917, t test 0.000) and positively correlated with Hb A2 percentage (r = 0.286, t test 0.044), and Hb F percentage (r = 0.366, t test 0.009). Statistically significant level was taken as p < 0.01. Correlation patterns are represented in scatter plots in Figure 2.
Considering positive or negative deviation of mean of each red cell parameter in Haemoglobin E trait group from the mean of the control group, 1 or 0 mark was given to each red cell parameter of Hb E trait to males and females separately, and total score was calculated. The overall average score obtained was 2.68. Average score in the female Haemoglobin E traits was 2. For the male Haemoglobin E traits average score was 3. Sum of scores obtained by test and control participants were illustrated in Table 2 respectively.
Table 2: Sum of scores obtained by test (Hb E trait) and control participants. View Table 2
Sensitivity of a score as above to select patients for screening, using 2 or above for females and 3 or above for males was 84%. Specificity was 100%, Positive predictive value was 100% and negative predictive value was 86.2%. But if the selection is done using the current criteria of MCV < 80 fl and/or MCH < 27 pg, sensitivity would be 72%, specificity 100%, PPV 100% but NPV 78%. However, even in a person whose MCV is > 80 fl and MCH > 27 pg, if the RDW higher than the upper limit of reference range for the sex is taken in to screening, sensitivity of the screening test would increase up to 80% and NPV up to 83%. And if people with red cell count > 5 × 10¹²/L were also selected sensitivity would increase up to 84%, and NPV to 86%.
In this study, hematological features of Haemoglobin E traits and normal controls were analyzed. The ages of the selected population were between 20-64 year and 15 females and 10 males with Haemolobin E trait and similar number of age and sex matched normal controls were selected as test and control samples according to the pre defined incusion and exclusion criteria.
In general, screening for all forms of thalassemia and hemoglobinopathies usually depends on a FBC obtained using automated blood cell counter. According to british committee for standards in haematoloy guidelines (BCSH) [12], individuals with MCH < 27 pg are further screened to detect underlying haemoglobinopathy and according National guidelines in Sri Lanka designed for β Thalassemia trait screening, individuals with MCV < 80 fL and/or MCH < 27 pg, usually undergo a further investigation by Haeoglobin cappilary electrophoresis or HPLC analysis. Furthermore, no specific guidelines to detect Haemoglobin E traits were defined in Sri Lanka and the existing guidelines to detect β Thalassemia traits are not validated to detect Haemoglobin E traits.
In this study, Hematological parameters of Haemoglobin E traits and normal controls were compared. Individuals with Haemoglobin E trait showed normal mean Hb for both males and females according to WHO criteria [13]. This is in agreement with the study done by Vichinsky E, et al. Also mean MCHC and RDW values were comparable with Vichinskys' findings [14]. However, MCV and MCH values of this study population of Haemoglobin E traits showed slightly lesser values than above findings. But Mean MCV and MCH values were in agreement with the mean values identified by Sharma A, et al. in their study population in North India [15].
Only Haemoglobin level showed statistically significant difference between males and females with Haemoglobin E traits. Mean corpuscular volume (MCV) and mean corpuscular haemoglobin (MCH) of Haemoglobin E traits showed significant difference between Haemoglobin E traits and normal controls. Red cell distribution width (RDW) and red cell count (RCC) also showed significant difference between these two groups. However mean corpuscular haemoglobin concentration (MCHC) did not show significant difference. None of the previously done studies had compared haematology parameters between Haemoglobin E trait male and female populations.
Majority of the Haeoglobin E traits showed normal Haemoglobin levels (64%). 28% of cases had MCV > 80 fl and 20% of cases had MCV > 27 pg. Therefore even there is a significant difference between Haemoglobin, MCV and MCH between Hemoglobin E traits and controls at least 20% of individuals may be missed at screening if selection is done according to the existing guide lines. However red cell count of more than 5.0 × 10¹²/L was observed in more than 56% cases in the Haemoglobin E trait group and 64% of cases in the Haemoglobin E trait group had red cell distribution width (RDW) above > 14%.
Kishore B, et al. in his study done in North India showed positive correlation between Hb E percentage and Hb F percentage and negative correlation between Hb E percentage with both MCV and MCH [16]. These study findings were similar to this. In contrast, above study which showed no correlation between Hb E percentage and red cell count, this study showed significant positive correlation between Hb E percentage and red cell count. Furthermore, these study findings are in agreement with the study done by Sharma A, et al. in North India [15]. Similar to that study, this population also showed significant positive correlation between Hb E percentage and RDW. All these studies concluded red blood cell parameters as a clue to diagnosis of Haemoglobin E traits. Additionally Sharma A, et al. had mentioned positive correlation between Haemoglobin E percentage and RDW may help differentiation them from β Thalassemia traits whose RDW is normal [15].
Sensitivity of detecting Haemoglobin E traits by selecting individuals with MCV less than 80fl or MCH 27pg is 72%. But sensitivity of detecting Haemoglobin E traits by a score using red cell parameters is higher. If 1 or 0 is given to each red cell parameter depending on their variation from reference range as illustrated in Table 2 and females with score 2 or above or males with score 3 or above is selected for screening, sensitivity of detecting Hb E trait is 84%.
As 56% Haemoglobin E traits had increased red cell count and 64% had increased RDW by using variation of either one of these indices can detect Haemoglobin E traits with 84% sensitivity, 100% specificity, 100% positive predictive value and 86% negative predictive value.
The automated cell counter-based parameters provide an excellent hematological data and continue to play a crucial role for screening and differentiation of Haemoglobin E traits. However taking MCV < 80 fl and MCH < 27 pg alone as detection limits, some Haemoglobin E traits can be missed. Therefore, even when MCV and MCH are normal, people should be screened to exclude haemoglobin E hetrozygosity, if red cell count or RDW is higher than the reference range for the age. Furthermore, clinicians can apply a score as defined above and select patients for screening. This is important because in a country with high prevalence of β Thalassemia traits, as missing the detection of Haemoglobin E traits will increase the risk of getting E β Thalassemia off springs who exhibit either Thalassemia Major or Thalassemia Intermediate phenotypes and have increased risk of getting iron overload related morbidity and mortality, which cause major burden on the health system of the country. Therefore a screening tool using red cell parameters would be cost effective in hospital settings as well as for mass screening programmes in the communities to detect Haemoglobin E traits.
Study was conducted with self funding and no funding resource to disclose.
All the authors contributed equally.
We would like o thank the Director of National Hospital Kandy who gave permission for me to carry out the research work in this setting following the ethical committee review, and nursing staff of Thalassemia Center in National Hospital Kandy, Sri lanka and Laboratory staff in Haematology Laboratory of the hospital. Also we would like to pay our gratitude to Professor Ananda Dassanayake of Department of Epidemiology in New York University College of Dentistry, who assisted with statistical analysis of data. Finally we would pay our sincere thanks to all the participants of this study who consented to give their information willingly and spent their valuable time giving histories and participating in laboratory tests.