Blacks have a greater need for kidney transplants than other American ethnic groups. Overrepresented on kidney transplant waiting lists (13%), they account for 35% of those waiting. Recent studies show that Black live donors are at greater risk for kidney failure, (44%) after donation, compared to other ethnicities. Explanations for these live donation data are few. While diabetic, hypertensive or morbidly obese Blacks are excluded as live donors; those overweight or obese are not.
To examine relationships between BMI, waist circumference [WC] and GFR as potential risk factors for CKD in relatively healthy Blacks.
Participants included 214 Black community volunteers from the Washington, DC area. Physical exams, laboratory and anthropometric data were collected. Creatinine clearance (Cr Cl) was calculated using the Cockcroft-Gault equation method.
Sample mean age was 45 years; 48% were males. Mean BMI and waist circumference were 31 and 38 respectively. Bivariate correlation analyses showed BMI and waist circumference correlated with GFR > 130 cc/min. (r = 0.67, p < 0.01 and r = 0.66, p < 0.01, respectively). Logistic regression analyses revealed that BMI and WC classified obese males were more likely to have a GFR > 130. BMI-categorized obese women were more likely to have a GFR > 130.
Results indicate that increased BMI (> 30 kg/m2), increased waist circumference (> 40 inches) and increased GFR (> 130 ml/min) were strongly correlated in Black volunteers. Black donors with obesity risk factors, when combined with GFR > 130 may be the factors placing overweight or obese AAs at increased risk for CKD after kidney donation.
African American kidney donors, Risk factors, Obesity, Renal glomerular hyper filtration
There has been a sustained effort to encourage live kidney donation among Blacks in the past three decades, and organ donation has consistently risen within this community [1-3]. Although live kidney donation is a major surgical procedure, complications after surgery are considered minimal Racial/Ethnic differences after kidney donations have been noted with African Americans (AA) experiencing increased risks for hypertension, diabetes mellitus, and chronic kidney disease compared to White and Hispanic donors [4]. While lifetime risk of end-stage renal stage (ESRD) is not significantly higher for donors compared to the general population [5], Black donors are up to five times more likely to develop ESRD than Caucasians donors [6]; the mechanisms that account for these disparities in complications were sought in this study.
The risk for complications among morbidly obese individuals has been emphasized in the literature and may have substantial relevance for AA. AA are disproportionately living with obesity (48%) in comparison to other racial/ethnic groups (Hispanic, 42.5%; Caucasians, 32.6%; Asian, 10.8%) [7]. Being obese and morbidly obese carries increased risk, up to a four-fold increase, for developing renal disease and chronic renal failure [8,9]. This is present among donors who are overweight and severely obese, [10]. Not only is weight associated with reduced kidney functioning, but extensive evidence implicates increased body mass index (BMI) as a risk factor for hyper filtration [11-13]. Several mechanisms have been put forth in an attempt to explain the obesity-hyper filtration link. One assertion states that the obesity induces intra-capillary glomerular pressure and glomerulosclerosis, thereby expanding the glomerular capillary surface area and changing arteriolar resistance [14]. As a result, GFR and renal plasma flow rate increase. Another explanation suggests that excessive visceral adiposity physically compresses the kidneys and increases renal-pressure natriuresis [15].
While the risk of ESRD among obese individuals has been emphasized in the literature, the dangers of overweight and obesity for live kidney donors have received little attention. In particular, there is a gap in the literature that addresses the risk of ESRD among live kidney donors who are considered overweight and obese. Therefore, the classification of overweight/obesity prior to kidney donation may also be additional risk factors for AA live kidney donors and may also provide some insight into the reason AA live donors develop ESRD after donation.
The purpose of this study was to determine if being overweight and obese were associated with glomerular hyper filtration (as defined by an eGFR > 130) in a non-patient sample of African Americans. We hypothesized that greater BMI and waist circumference would be associated with glomerular hyper filtration and suggest that even overweight and moderate obesity may provide additional insight into the reason AA live kidney donors develop ESRD after donation.
Psychoneuroimmunological Risk Factors in Renal Health and Disease was a cross-sectional study conducted by the National Minority Organ Tissue and Transplant Education Program (MOTTEP), a division of Howard University Hospital. The goal of the overall study was to identify biological, psychological, and social factors that are associated with impaired renal function and renal disease. The study was conducted from 2004 to 2007 and utilized a convenience sample of 214 Black adults from the Washington, DC metropolitan area. The Howard University Institutional Review Board approved the study protocol. Subjects were recruited through flyers posted at Howard University Hospital and advertisement at local health fairs. Exclusion criteria for the community-based sample included current domestic and substance abuse, as well as, a previous diagnosis of a psychiatric disorder. Subjects were screened by phone and eligible for the study based on self-report of exclusion criteria. Informed consent was obtained from all subjects. Subjects participated in a four to five-hour protocol. Data collection took place at the General Clinical Research Center (GCRC) and included blood and urine collection by a registered nurse employed by the GCRC. Trained graduate students administered a battery of psychological, neuropsychological, and social measures. Subjects received monetary compensation for completion of the study requirements.
Non-fasting serum was drawn into four cryovials and frozen at -70 C. After clotting, blood samples were centrifuged and aliquoted into six vials and stored at the GCRC. Frozen serum samples were sent to Quest Laboratories where they were thawed and assayed to measure serum creatinine using standardized ELISA techniques. The GFR was estimated using the Cockcroft Gault equation method. This formula takes into account the age and sex of subjects and is expressed as the following: CCr = (140 - age) × Mass (in kilograms) × 0.085 (if female)/72 × Serum Creatinine. GFR was stratified into two categories: GFR less than or equal to 130 and GFR greater than 130. Previous findings have identified eGFR greater than 130 as a marker for hyper filtration [16,17].
BMI was calculated by dividing weight (kilograms) by height (square meters). BMI was categorized based on established cut-offs: 18.5 - 24.9 = normal weight; 25.0 - 29.9 = overweight; and greater than or equal to 30 = obese. Waist circumference was measured in centimeters/inches at the level of the umbilicus. Sex differences in WC cut-offs were utilized to stratify participants as non-obese or obese. Female subjects with WC > 88 cm/35 inches were categorized as obese and females at or below 88/cm/35 inches were categorized as non-obese. Male subjects with WC > 102 cm/40 inches were categorized as obese. Likewise, males with WC at or below 102 cm/40 inches were categorized as non-obese.
Information on age, sex, ethnicity, education, income, and marital status was based on self-report during the interview portion of the study. Self-reported data on hypertension and diabetes were provided by subjects based on a physician's previous diagnosis. Other physical measures were assessed with a blood draw, as described in Table 1. Three seated blood pressure measurements were taken.
Table 1: Demographic and clinical data characteristics. View Table 1
The Statistical Package for the Social Sciences (SPSS) 19.0 was used for all statistical analyses. Serum creatinine was log transformed to correct for positive skewness. Pearson correlations and multiple regressions were utilized to assess initial relations between BMI, waist circumference, eGFR, and other explanatory variables. Next, multivariate logistic regression models were used to assess the risk of hyper filtration (eGFR > 130) associated with BMI and WC. Each categorized measure of obesity was used to predict dichotomous eGFR levels with the addition of several covariates. Covariates included age, systolic blood pressure, self-reported hypertension, and self-reported diabetes. Analyses were stratified by gender.
Classification and Regression trees (CARTs) [18] were analyzed to confirm logistic regression findings without imposed cut-offs. Of particular interest were patterns of association by gender. Recursive partitioning was employed to force the data into homogeneous groups according to an entropy criterion [18]. The covariates (BMI, WC, age, systolic blood pressure, self-reported hypertension, and self-reported diabetes) and the response variable (eGFR) were defined as in logistic regression with the response representing whether an individual had an eGFR < 130 or greater than or equal to 130. The resulting regression tree consists of nodes represented by circles and boxes. The first node is the root, consisting of the entire sample and the subsequent nodes consist of subsets of the sample. The tree divides each internal node into two offspring nodes, which are determined by the values of one of the covariates and is intended to offer the "best possible" split, sending individuals to one offspring node or the other based on the imposed eGFR cut-off. This process continues recursively, and the process stops itself when the finite number of individuals in the sample is exhausted.
The mean age of the subjects was 45.60 ± 11.56 years. Mean BMI was 29.64 ± 7.55 kg/m2 and mean WC was 98.17 ± 20.26 cm. mean serum creatinine levels were 0.87 ± 0.19 mg/dl and mean eGFR was 129.67 ± 48.39 mL/min/1.73 m2. Characteristics of the sample are found in Table 1.
In the overall sample, BMI was positively associated with eGFR (r = 0.714; p < 0.01). Likewise, WC was positively associated with eGFR (r = 0.672; p < 0.01) Table 2. Among men, BMI and WC were significantly and positively associated with eGFR. Among women, BMI, WC, and eGFR were significantly and positively associated. Unadjusted associations among study variables are found in Table 3 (Appendix 1, Appendix 2 and Appendix 3).
Table 2: Grouped associations between BMI, WC, covariates, and eGFR > 130. View Table 2
Table 3: Unadjusted associations between BMI, WC, eGFR, and explanatory variables. View Table 3
Among men, BMI overweight status did not increase the odds ratio (OR) of an eGFR > 130. However, BMI-categorized obese men were nearly 6 times more likely to have an eGFR > 130 than normal weight men. Within this model, younger men were nearly five times as likely to have eGFR > 130 than older men (OR = 4.855). BMI-categorized obese women were nearly 40 times more likely to have an eGFR > 130 than their normal BMI counterparts (OR = 39.493). For women, age was an important variable as well. Younger women were eight times as likely as older women to have an eGFR > 130 (OR = 8.180).
WC-categorized obese men were nearly 16 times more likely to have an eGFR > 130 than their normal waist counterparts (OR = 15.989). Among women, WC-categorized obese women were almost six times as likely to have an eGFR > 130 (OR = 5.872). Younger women were nearly 17 times more likely to have an eGFR > 130 than older women (OR = 16.567). Logistic regression results for associations between BMI and WC categories and eGFR > 130 are found in Table 2.
In the CART analysis, the upper value in each node corresponds to the number of subjects with an eGFR greater than 130 while the lower value corresponds to the number of subjects with an eGFR less than or equal to 130. Figure 1 illustrates the CART for females. From the outset, 43 females had an eGFR value > 130 while 55 females were below this cut-off. The strongest predictor of an eGFR > 130 among females was BMI. At BMI > 34, 27 female subjects had an eGFR > 130 while 5 did not, suggesting that higher BMI was predictive of higher eGFR.
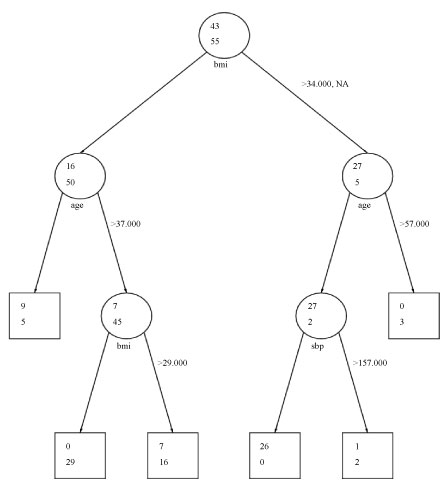 Figure 1: Classification and regression tree analysis: Females. View Figure 1
Further partitioning of this subset indicated that age was the next strongest predictor of an eGFR > 130 among female subjects with a BMI > 34, with 27 females less than or equal to age 57 having eGFR < 130. No females over the age of 57 had an eGFR > 130, indicating that younger age was predictive of higher eGFR. The final partitioning of this subset indicated that a systolic blood pressure of 157 was the cut-off where 26 females with SBP less than or equal to 157 had an eGFR > 130 and one female with SBP > 157 had an eGFR > 130. Within the subset of females with BMI less than or equal to 34, age and BMI were significant predictors. An age cut-off of 37 defined the next partition. Above age 37, 7 females had an eGFR > 130 and below 37, 9 females had an eGFR > 130. The final partition in this subset was defined by a BMI > 29. Seven females with a BMI > 29 had an eGFR > 130 while 0 fell below the eGFR cut-off. Findings for females were mainly consistent with the logistic regression findings where BMI and age were the strongest predictors of an eGFR > 130. The CART does not suggest that WC is an important predictor as the logistic regression did; however, it does suggest that SBP is predictive of eGFR, but this finding is not strong given its late appearance in the CART.
Thirty-eight males fell above the cut-off of 130 for eGFR at the initial step of the CART while 60 males fell below this cut-off. The strongest predictor of eGFR for males was WC. At a WC cut-off of 105.41, 23 males fell below this cut-off and 15 males fell above it, suggesting that lower WC was more predictive of an eGFR > 130. Within the subset of 23 men who fell below this cut-off, age was the next most important predictor. Above the age of 53, no men had an eGFR > 130; however, below this cut-off, all 23 men within this subset had an eGFR > 130, suggesting that younger age was more predictive of an eGFR > 130. The final node was defined by BMI with a cut-off of 34. Seventeen men below this cut-off had an eGFR > 130 while 6 men above this cut-off did, suggesting that lower BMI at this stage of the CART was more predictive of higher eGFR. CART findings for males were consistent with the logistic regression findings where WC, age, and BMI were significant predictors of an eGFR > 130. An illustration of the male CART is found in Figure 2.
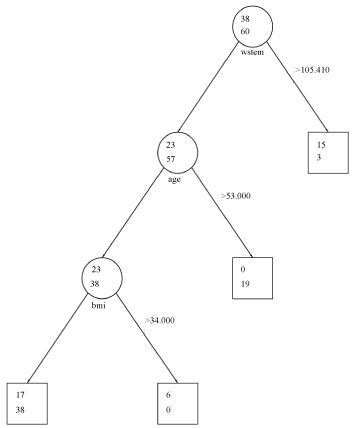 Figure 2: Classification and regression tree analysis: Males. View Figure 2
The current study investigated the relation between overweight and obesity and glomerular hyper filtration to identify possible risk factors for live kidney donation in a community-based sample of Blacks. The study aimed to better understand the disparity between Black's, who disproportionately develop ESRD after donation, and other ethnic populations. This was achieved by examining a community-based sample of potential AA. To our knowledge, there has not been another study that has examined this association in a population that can be potential live-kidney donors.
Our initial findings suggested that both BMI and WC were positively associated with glomerular hyper filtration, as indicated by GFR > 130. In addition, WC-categorized obese men and women had GFR > 130. After accounting for key health indicators, BMI overweight status did not increase the chances of an e\GFR >130 but BMI-obesity in men did. Likewise, WC-categorized obese men and women had greater than 130 GFR. The inverse relationship between BMI and renal function has been seen in retrospective studies investigating renal health in live kidney donors after donation. Research has found an association between obesity in Black live kidney before-donation and poorer renal function several years after donation [19]. Similarly, obese live kidney donors were also more likely to have a decrease in GFR [20]. The results strongly suggest that a GFR > 130, BMI > 34, and WC > 102 cm/40 inches are associated with risk factors that when found in Blacks which may place them at greater risk for the subsequent need for kidney transplantation than with other donors.
Based on our findings, age was also significantly associated with hyper filtration. Younger women and men were more likely to have GFR > 130. This finding was contrary to what has been suggested in other research. Other research identified older age at the time of donation as a potential risk factor for poorer renal function atrer donation in both Blacks and Caucasians [4].
To better understand the intricacies of our data, we utilized classification and regression trees (CART). This analysis is a useful statistical technique that may help, identify participants most at risk for hyper filtration. CART analysis identified a gender difference in these risk factors with males aged < 53 and WC > 105 having a strong association with eGFR > 130 and females aged < 57 and BMI > 34 being strongly associated with eGFR > 130. In the past, transplant surgeons have rejected donors with low creatinine clearances < 80, hypertension, and with morbid obesity but have not considered an eGFR > 130 as a risk factor. Previous research [21-25] has suggested that when glomerular hyper filtration is in excess of 130, kidney damage may occur. While this may not be a factor in other ethnic groups, in Black donors this may be a manifestation of hyper filtration, particularly when combined with the additional hyper filtration that occurs when one is left with one functional kidney.
This manuscript poses a question that the Kidney Transplant Black/White disparity has recently raised concerns for the ethicists and transplant surgeons for some time. Is there a need for a separate and specific in kind (potential) consent necessary for Black donors? When one looks at the rapidly accumulating data [26-28] that identifies how the organs received and donated by Black's are associated with statistically significant poorer survival rates; one has to answer "maybe so." This recent research [26-30] has identified the disproportionate need for kidney transplant on the part of Black donors who make up 12% of the donor pool but 44% of the donors subsequently placed on kidney transplant waiting lists. Factors that they identified as different in these Black donors have been increased creatinine clearances, increase blood pressures, and younger donor ages. These findings have caused us to look closely at our potential donor pool of Black males and females and analyze their glomerular filtration rate's (GFR), BMI, and WC along with other psychoneuroimmunology elements associated with the development of ESRD.
While the risk for developing ESRD after live kidney donation is minimal, when it does occur, Blacks, are disproportionately represented. Future prospective studies therefore are necessary to better identify if Blacks are at greater risk for ESRD after live kidney donations. We have identified potential risk factors which may lead to a better understanding of the role that overweight and obesity may play in the potential black kidney donor with the growing epidemic of obesity in the U.S., Black population.
This research is part of a larger study entitled "Stress and Psychoneuroimmunological Factors in Renal Health and Disease" that is funded by The National Center on Minority Health and Health Disparities under grant #1P20MD000512-04, "A Research Center to Reduce Ethnic Disparities in ESRD". This manuscript was made possible by Howard University's General Clinical Research Center grant #2MO1-RR010284 from the National Center for Research Resources (NCRR) a component of the National Institutes of Health (NIH) and its contents are solely the responsibility of the authors and do not necessarily represent the official view of NCRR or NIH.
Our research was approved by the Howard University institutional review board and all procedures followed were in accordance with the ethical standards of the IRB and the Helsinki Declaration of 1975, as revised in 2000. Informed consent was obtained from all patients being included in the study.