Background: Diabetes mellitus (DM) is a chronic inflammatory state that leads to potentially degenerative changes in brain metabolism. Sustained pictures of hypoinsulinemia trigger phosphorylation of the tau protein and production of amyloid plaques, forming senile plaques and neurofibrillary tangles in brain tissue. Diabetic patients have a higher incidence of cognitive impairment and a higher risk of developing Alzheimer's Disease (AD), the most common type of dementia characterized by chronic neurodegeneration involving early synaptotoxicity, suggesting critical links between DM and AD, currently characterized as Type 3 Diabetes. This work aimed to induce DM in Wistar rats and measure demographic neurological changes, through serological, histological, immunohistochemical, anthropometric and exploratory behavior analysis.
Methods: Thirty male Wistar rats were used, divided into the Control Group (CG) and the Diabetic Group (DG), all included healthy. After complete anesthesia, the DG animals had streptozotocin-induced diabetes, whereas the CG received only NaCl. The animals were kept in an experiment for 69 days. Glycemic collections, body weight measurements and behavioral assessment were performed using the Open Field Test. On the day of euthanasia, the brain, pancreas and liver were retired for further analysis.
Results: In relation to the CG, the DG rats are apathetic, with movements and not very responsive when applying the open field test. He observed that the DG had an average body weight lower than the CG until the end of the experiment (p < 0.0001). In all glycemic measurements, the DG rats showed higher values than the CG. Download absolute weights (p = 0.0007) and affect (p < 0.0001) of the brain, lower minimum values found in the DG. In immunohistochemistry, tyrosine hydroxylase shows less enzymatic expression in the brain tissue of the DG compared to the GC.
Conclusion: Noradrenergic alterations caused premature aging of the central nervous system, culminating in neurodegenerations by enzymatic reduction of tyrosine hydroxylase in brain tissue, suggesting an intimate relationship between Diabetes Mellitus (DM) and Alzheimer's disease (Type 3 Diabetes). Cell death due to oxidative stress in strong association with neuronal inflammation resulting from DM complications also contributed to accelerated cerebral atrophy, with processing speed and psychomotor slowing as the most affected cognitive spheres.
Diabetes mellitus, Alzheimer's disease, Cognitive Dysfunction, Wistar rats
DM: Diabetes Mellitus; AD: Alzheimer's Disease; CG: Control Group; DG: Diabetic Group; STZ: Streptozotocin; CEUA/FEMPAR: Committee on the Use of Animals of Faculdade Evangélica Mackenzie do Paraná; UFSC: Universidade Federal de Santa Catarina; IPEM: Instituto de Pesquisas Médicas; HE: Hematoxylin-Eosin; GLUT: Glucose Transporter
Diabetes Mellitus (DM) is a metabolic disease of multiple etiology, characterized by chronic hyperglycemia resulting from a deficient secretion or action of insulin, or both. DM is one of the most common chronic diseases in almost all countries in the world and constitutes a critical public health problem, even being considered a pandemic [1].
The metabolic disorders present in DM, which have in common an increase in the concentration of glucose in the blood, can lead the individual to different clinical conditions affecting the central and/or peripheral nervous system [2]. This chronic hyperglycemia of diabetes is associated with damage, dysfunction and failure of different organs in the long run, especially in the brain, kidneys, nerves, heart and blood vessels. Insufficient insulin action results from inadequate insulin secretion and/or decreased tissue responses to insulin at one or more points in the complex pathways of hormonal action [3].
Contrary to what occurs in the periphery, the acquisition of glucose by the brain is an insulin-independent process. This could lead to the assumption that this is an insulin insensitive organ. However, the presence of insulin and its receptors in the brain has revolutionized this concept. Although not yet perfectly defined, it is currently accepted that insulin performs several physiological and pathophysiological functions in the central nervous system, mainly in terms of food intake, body weight, cognition, learning, memory and reproduction. In addition, neuromodulatory, neurotrophic and neuroprotective functions have also been described. Associated with this, insulin and the disorders associated with its deficient secretion or action seem to contribute to the development and progression of neurodegenerative and neuropsychiatric diseases, such as Alzheimer's disease (AD), Parkinson's disease, Huntington's Korea, depression and psychosis [4].
A close association between type 2 DM and AD has been reported, with this neurodegenerative pathology being more common in the diabetic population. These two diseases share several pathophysiological aspects, such as insulin resistance, aggregation of amyloid protein, inflammatory processes and cognitive changes, suggesting the existence of a common or related pathological process. It is possible that Alzheimer's dementia is a neuroendocrine disease associated with insulin signaling, being called "type 3 diabetes" [4].
The brains of patients with DA showed evidence of reduced expression of insulin and neuronal insulin receptors, compared with the corresponding age controls. This event gradually leads to a breakdown of the entire insulin signaling pathway, which manifests insulin resistance [5]. In this sense, the study of the functions of the action of hyperglycemia in the brain is fundamental for both a better understanding of the pathophysiology of the central nervous system and the consequences caused by it.
This study aimed to induce diabetes mellitus in Wistar rats and evaluate, using biochemical and histopathological parameters, the brain, liver and pancreatic tissues; and by behavioral parameters, assess neurological changes.
This study is in accordance with the recommendations of the Ethics Committee on the Use of Animals of Faculdade Evangélica Mackenzie do Paraná - CEUA/FEMPAR, as well as with the Declarations of Helsinki (1964, 1975, 1981 and 1989) and with the International Protection Standards to the Animals.
Thirty male wistar rats were used, aged approximately 2 to 3 months, weighing an average of 250 grams. The animals were kept with free access to water and food, in a light/dark environment of 12/12 h and a constant temperature of 23 °C. The animals were obtained by the Vivarium of the Universidade Federal de Santa Catarina (UFSC) and were acclimated in the Vivarium of the Instituto de Pesquisas Médicas (IPEM) for 7 days, before the beginning of the experiment, with free ration and water. All rats were weighed prior to the start of the experiment to ensure that the body weights did not vary between themselves.
After 7 days, the animals were randomly divided into two experimental groups: Control Group (CG), formed by 10 rats and Diabetic Group (DG), formed by 20 rats that had diabetes induced pharmacologically by Streptozotocin (STZ). After induction, the animals were kept in an experiment for 69 days, according to the Zhou Y, et al. [6].
STZ was initially isolated and characterized as a broad spectrum antimicrobial from colonies of Streptomyces achromogenes. Based on preclinical studies of STZ, they revealed that its intravenous or intraperitoneal administration in high doses produces DM in rats and dogs, and that the islets of Langerhans of diabetic animals are broken and with significant decrease or absence of cell granules [7].
Simon and West, studying the administration of STZ to Wistar rats, at a dose of 30 mg/kg found diabetes in all animals, in a lasting way [7].
The STZ-induced model of DM in rats has many advantages over other models, such as low cost, ease in inducing disease and the ability to keep animals in proper conditions. Thus, it is considered an appropriate experimental model of DM, being used in many experiments as a pathology induction protocol [8].
The rats of the DG, after a 12-hour fasting period, received intraperitoneal administration of Xilasina Hydrochloride 0.1 mg/kg and Ketamine Hydrochloride 0.8 mg/kg and, after complete anesthesia and reflex checking, had diabetes induced by STZ (diluted to 2% in 10 mmol sodium citrate solution, pH 6.0) administered into the penile vein in a single dose of 30 mg/kg (Delfino, et al. [7]. The animals in the CG received similar treatment, but with administration only of NaCl in the same proportion.
After induction and complete recovery of the animals, glycosylated water (24 g dextrose in 500 ml of water) and feed were provided to prevent fatal hypoglycemia, due to the massive release of insulin that occurs after the destruction of β cells [9].
Evidence of experimental diabetes was performed 7 days after drug administration, by determining the serum glucose concentration from blood collected from the rat's tail by means of a glucometer and blood glucose strips, after a minimum fasting period of 12 h. Animals were considered diabetic if fasting blood glucose above 200 mg/dL [10]. Day 01 of the experiment is considered the day of confirmation of hyperglycemia.
Ten animals from the CG and fourteen animals from the DG remained alive after the induction stage, being part of the study analysis. Six animals in the DG died 5 days after induction and were excluded from the analysis.
The ten animals of the DG, after induction, obtained blood glucose values above 200 mg/dL, being considered as diabetic [10] and included in the study analysis.
At the end of 69 days of study, 7 days after induction and 62 days of maintenance of the experiment [6], the rats were anesthetized with intraperitoneal application of Ketamine Hydrochloride 50 mg/kg and Xilasine Hydrochloride 10 mg/kg.
For this procedure to occur, the animals were fasted for 12 h. After complete anesthesia, the animals were orthotanasized by decapitation, with the aid of a guillotine to remove the brain for further histopathological and immunohistochemical analysis. In addition, blood was collected from the animals and stored in anticoagulated tubes for biochemical analysis. Liver and pancreas were also removed for histological analysis.
After euthanasia, the removed organs were kept in 10% formalin for dehydration and embedded in paraffin. The paraffin blocks containing the tissues were sectioned (5 mm thick) and the sections transferred to slides were stained with the specific color for each analysis. The analysis of the structures was carried out using an optical microscope (Nikon® E100).
The brain tissue was cut in the longitudinal direction for histopathological analysis and the presence of deposition in the central nervous tissue of amyloid material in the tissue between the neuronal cell bodies (neurópilo) forming the senile plaques, through the staining in Hematoxylin-Eosin (HE). Anthropometrically, the presence or absence of diffuse cerebral atrophy was assessed using absolute and relative organ weights, comparing between CG and DG.
For the analysis of the liver, in a cross-section on the longest axis, the liver tissue was classified according to Guideline of American Association for the Study of Liver 2012 [11]. Through the presence of steatosis and balloon inflammation. The degree of change was classified according to Kleiner, et al. [12] in steatosis, lobular inflammation and ballooning, establishing a score that determined the degree of liver disease.
For the analysis of the pancreas, in a cross-section, each slide was photographed in a 200x magnification and the size and presence or absence of islet distortion was evaluated, in addition to the analysis of the presence or absence of amyloid corpuscles by HE staining, according to with Schossler, et al. [13].
The frozen post-fixed cerebral hemispheres were cut in a 20 μm thick longitudinal direction. Each fixed section was subjected to immunoreaction with antibodies against the specific marker of dopaminergic neurons anti-tyrosine hydroxylase. Then, the sections were incubated with a secondary polyclonal antibody and subsequently analyzed under a microscope in bright field mode.
The animals were weighed four times during the entire experiment. The first measurement was performed on day 01 of the experiment, the second on the 30th, the third on the 45th and the last on the 62nd (euthanasia day). Blood samples were collected from the animals' tails at three moments of the experiment (day 01, day 45, day 62) for glycemic profile, being analyzed instantly through a glucometer by strips.
Behavioral analysis was performed using the Open Field Test, which became popular as an exploratory behavior assessment test. In the Open Field Test, the animal's behavior is determined by the conflict between the motivation to explore and the aversion to open and unprotected places, which may reflect the animal's motor activity, emotional state and anxiety in a new environment [14].
To perform this test, a square wooden box measuring 120 cm × 120 cm was mounted, the base being a dark checkered canvas (30 squares separated by white borders) and surrounded by 40 cm high walls. Above the central region of the open field, a video camera was suspended to record footage during the test, which took place in the afternoon and received sufficient external lighting only for the shoot, without direct lighting in the field and/or in the animals [14].
The experiment was carried out only once, so that there was no recognition of previous space on the part of the animals and influenced the behavioral result if it were repeated in a second moment. On day 61, one day before euthanasia, the animals were subjected to the test. Before each test, to avoid the animals using olfactory cues from the animals previously tested, the open field was cleaned with an alcohol solution (70%) and dried with a dry cloth. All animals were tested in 5-minute sessions, counted from the moment they were placed in the center of the open field, with each animal being tested only once.
For each rat, walking patterns were recorded during the minutes of filming. Other behaviors, such as getting up, cleaning and defecating, were also recorded and taken into account in the analyzes. For each square covered by the animal, time spent in space and frequency of entries were recorded, in addition to the following behaviors:
1) Sniffing the environment (sniffing movements aimed at any part of the environment);
2) Getting up (whenever the animal rested on its hind legs, inclined or not);
3) Climbing on the side wall (it actually climbed the walls or when it stood on its hind legs or stood with its front legs on the wall);
4) Cleaning yourself (any movement made with the paws touching parts of the body or with the teeth, as if scratching areas of the body);
5) Stretching (maintaining the position of the hind legs, displacing the forelegs and increasing their length; the behavior was recorded in the square where the hind legs were).
For all data, the averages of each subject were initially calculated for the occurrences in each square of a given area, adding the values of all squares.
The results of quantitative variables were described by means, medians, minimum values, maximum values and standard deviations and qualitative variables by frequencies and percentages. For the comparison of two groups in relation to quantitative variables, the t test with Welch correction was considered in cases in which the normality test showed a parametric test. For the comparison of two groups in relation to quantitative variables, the Mann-Whitney test was used in cases where the normality test showed a non-parametric test; more than two groups were compared using the Kruskal-Wallis non-parametric test. Fisher's exact test was used to assess the association between two qualitative dichotomous variables. The correlation between two quantitative variables was assessed by estimating Spearman's correlation coefficient. Values of p < 0.05 indicate statistical significance. The data were analyzed with the computer program GraphPad Prism 6.0.
Compared with the CG, the rats in the DG were listless, with slow and unresponsive movements throughout the experiment.
It was observed that the DG presented, in all measures after induction, mean body weight lower than the CG with significant p (p < 0.0001) (Figure 1).
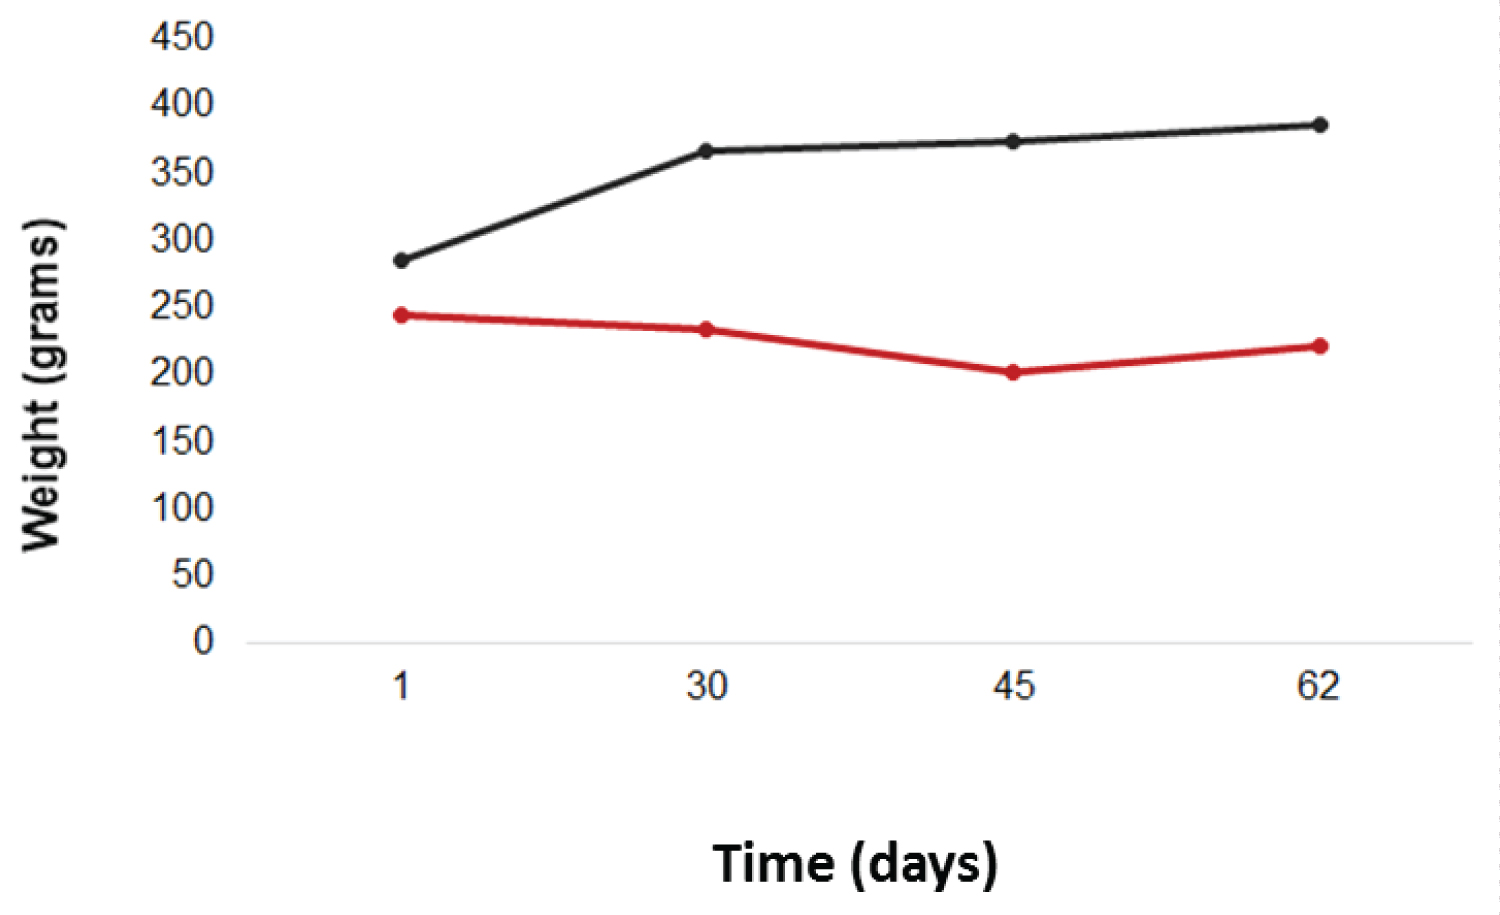 Figure 1: Body weights of the animals, in grams, during the experiment.
Red line: DG; black line: CG. View Figure 1
After seven days of STZ induction, it was observed that the CG had an average five times lower of fasting capillary glucose when compared to the DG (79.2 mg/dL vs. 398.1 mg/dL, with p < 0.0001).
Regarding the second measurement of fasting capillary glucose (day 45), the CG had an average of 84.8 mg/dL of capillary glucose, while the DG had an average of 576 mg/dL, also with significant p (p < 0.0001).
The third measurement, carried out on the day of euthanasia, also showed a significant difference between the groups, with the DG presenting mean seven times higher glycemia compared to the CG (655.7 mg/dL vs. 96 mg/dL, with p < 0.0001) (Figure 2).
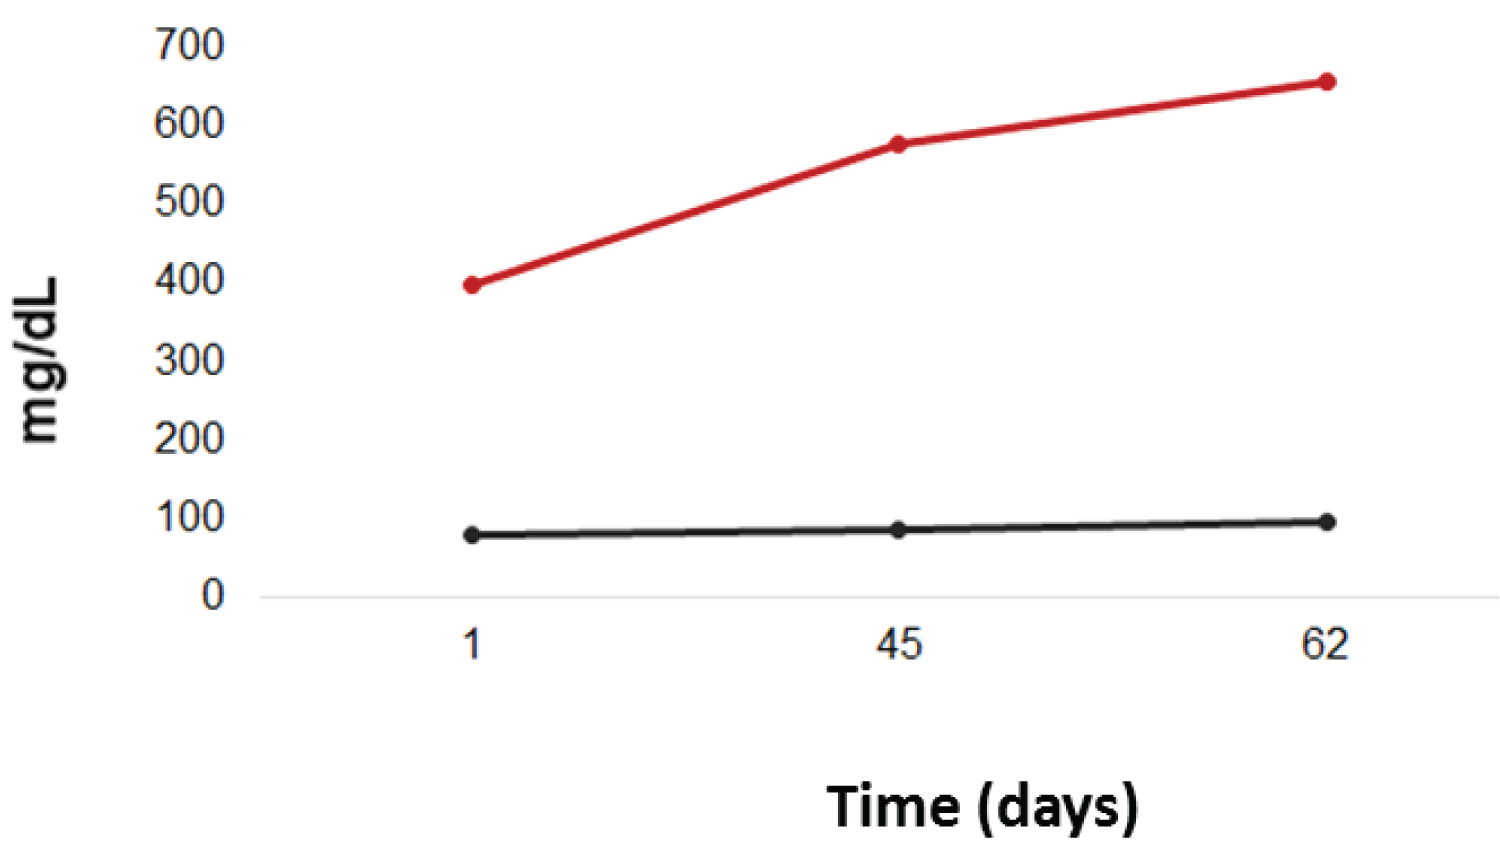 Figure 2: Glycemic profile throughout the experiment.
Red line: DG; black line: CG.
View Figure 2
Regarding the absolute weight of the liver, there was no significant difference between the CG and DG groups (10.91 g vs. 11.08 g, p > 0.05). However, in relation to the relative weight of the liver, there was a significant difference between the CG and DG (0.02818 vs. 0.05116, p < 0.0001).
With HE staining, there was no presence of steatosis or hepatic inflammation with ballooning in the analyzed groups.
Considering the absolute weight of the brain, lower values were found in the DG, with a significant difference between the Groups (average of 1.810 g in the DG vs. average of 2.053 g in the CG), with p = 0.0007. Regarding the relative brain weight (organ weight/body weight), there was also a significant difference between groups (p < 0.0001) (Figure 3).
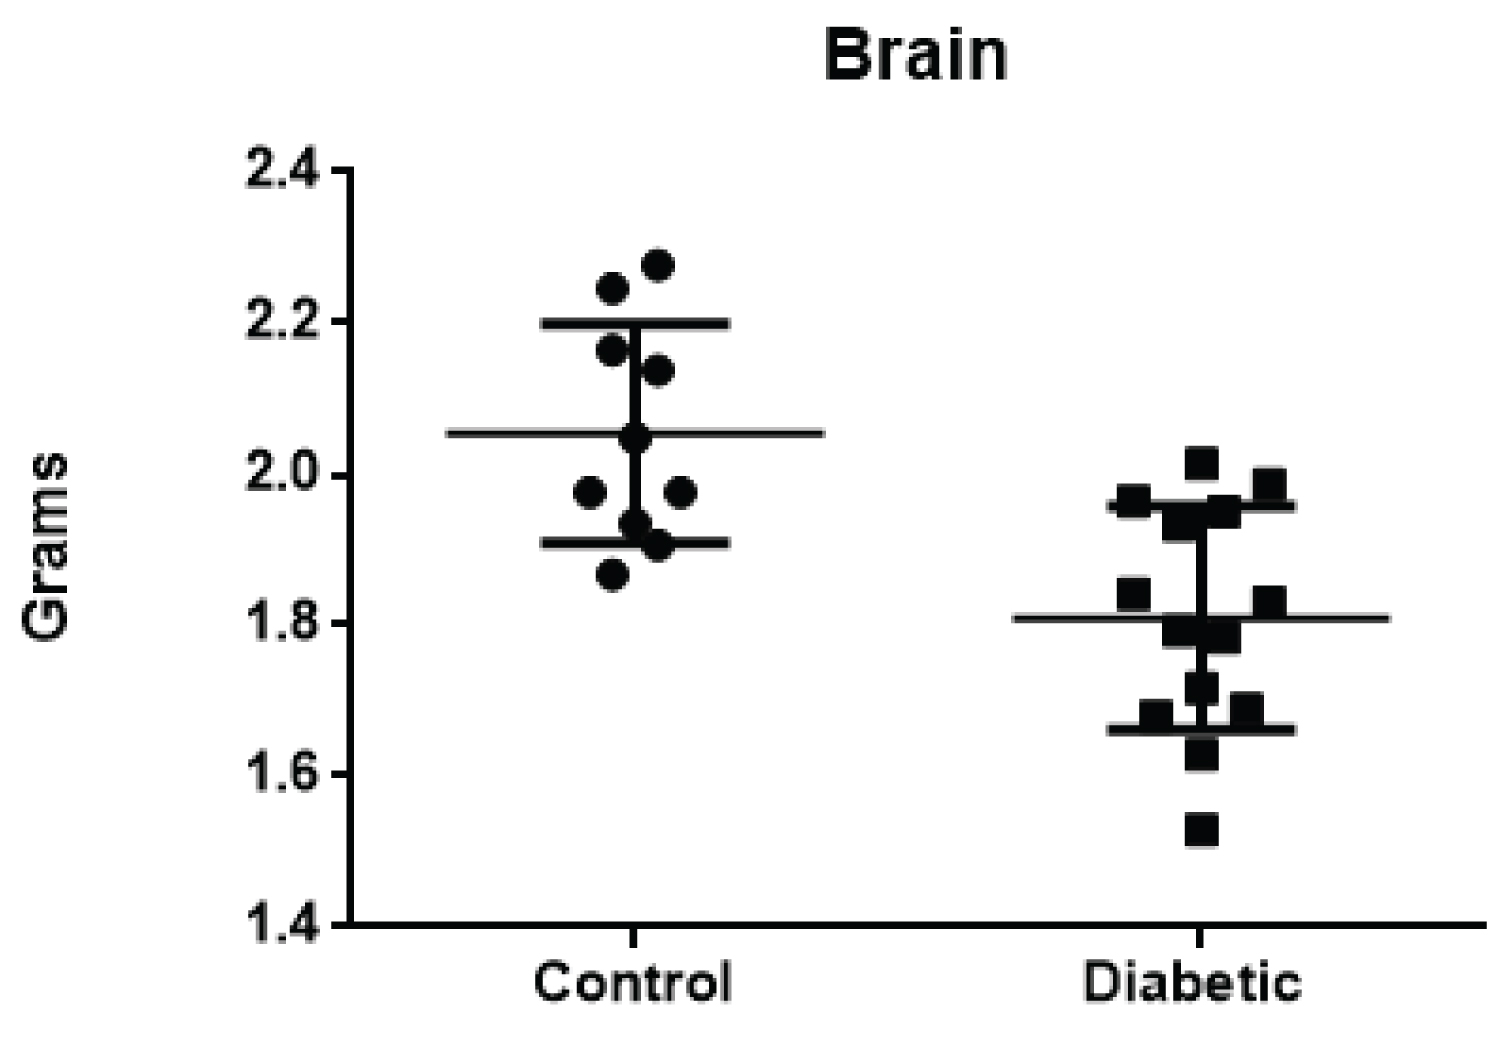 Figure 3: Brain weight, in grams, of the Control Group rats.
View Figure 3
Figure 3: Brain weight, in grams, of the Control Group rats.
View Figure 3
With HE staining, no deposits of amyloid materials were found between neuron cell bodies.
HE staining showed changes in pancreatic tissue in the DG, with 100% of the animals showing a reduction in the size of the islets and 40% showing reductions in the size and number of the pancreatic islets (Figure 4).
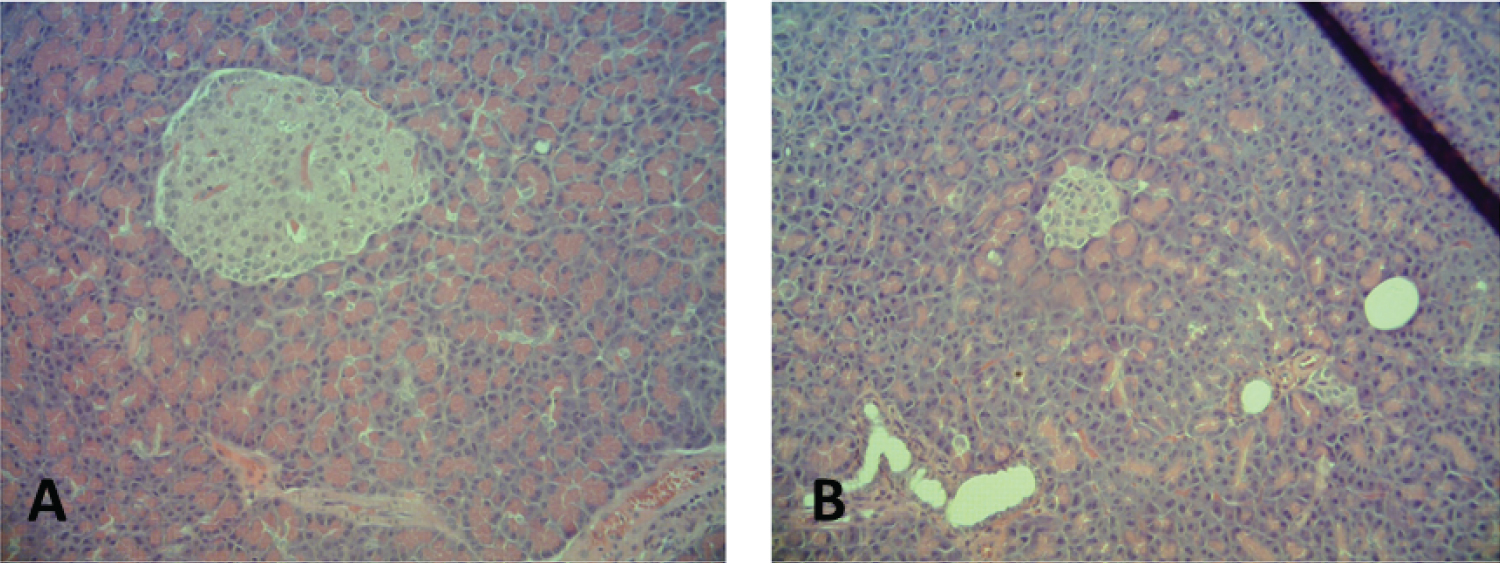 Figure 4: Pancreatic tissue histology in a 100x magnification. (On the A) pancreatic islets of the CG; (on the B) DG showing smaller islets.
View Figure 4
Figure 4: Pancreatic tissue histology in a 100x magnification. (On the A) pancreatic islets of the CG; (on the B) DG showing smaller islets.
View Figure 4
The diameters of the pancreatic beta islets in the DG showed a lower average of 217.4 vs. 433.6 in the CG, with a significant p (p = 0.0006) (Figure 5). In relation to the CG, pancreatic tissues did not present histological changes.
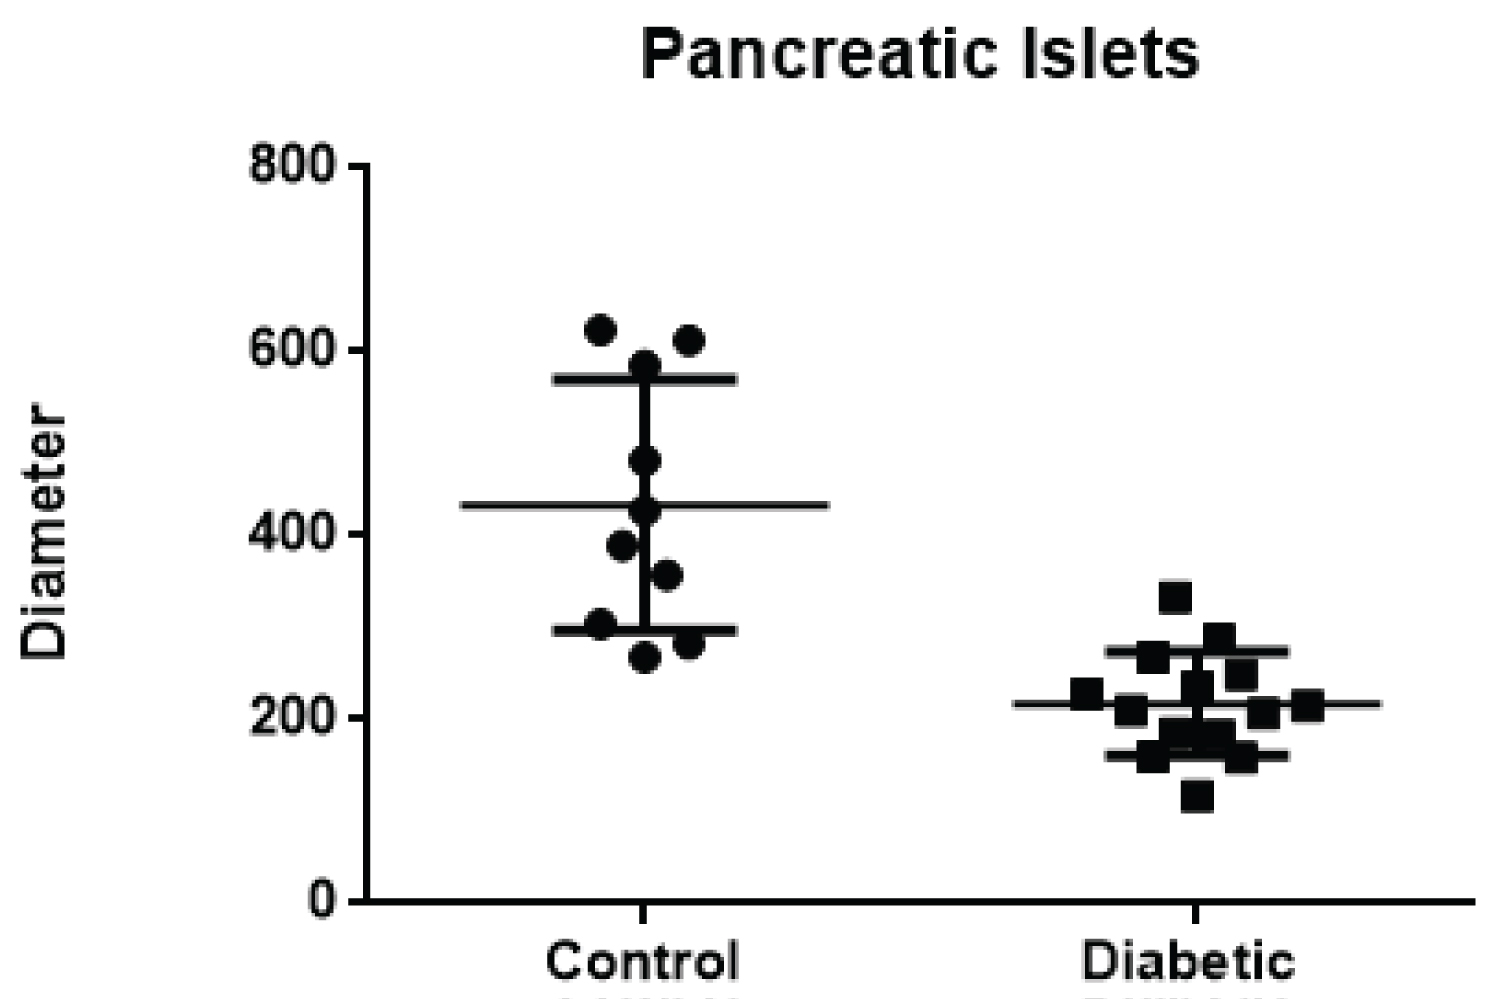 Figure 5: Comparison of the mean diameter of the pancreatic islets in the CG of the DG.
View Figure 5
Figure 5: Comparison of the mean diameter of the pancreatic islets in the CG of the DG.
View Figure 5
The animals in the DG showed an underexpression of Tyrosine Hydroxylase, with only 21.6% of the enzyme in brain tissue compared to the CG (Figure 6).
 Figure 6: Immunohistochemical analysis (40x magnification) of tyrosine hydroxylase in brain tissue of the CG (A) and DG (B), showing the underexpression of the enzyme in the brain tissue of a diabetic rat.
View Figure 6
Figure 6: Immunohistochemical analysis (40x magnification) of tyrosine hydroxylase in brain tissue of the CG (A) and DG (B), showing the underexpression of the enzyme in the brain tissue of a diabetic rat.
View Figure 6
The animals in the CG explored almost all of the squares in the Open Field, demonstrating agility and reduced time in each square covered, while the animals in the DG explored about 50% of the territory, with reduced agility (average of covered squares): 33.6 in the CG vs. 18 in the DG, with p < 0.0001).
During the 5 minutes of filming for each rat, the average stop of the animals in the CG was 5.7 stops vs. 10.14 in the DG (p < 0.0001), with an average stop time of 33, 10 s in the CG and 128.3 s in the DG (p < 0.0001).
All rats exhibited behaviors of sniffing the environment. The behavior of standing up was observed an average of 5.1 times in each rat in the CG, while in the DG this behavior was observed an average of 3.35 times (p = 0.0046). The behavior of climbing the side walls of the field was performed on average 19.8 times for each mouse in the CG; for rats in the DG, this behavior was performed on average 9.71 times, with p < 0.0001.
The cleaning behavior was performed on average 11.5 times for each rat in the CG and 1.7 times for each rat in the DG, with p < 0.0001. The behavioral movement of stretching was also performed in a smaller number by the rats of the DG in relation to the CG (average of 5.3 movements vs. 12.6 movements, with p < 0.0001).
The increasing increase in diabetes associated with cognitive impairment has attracted great attention from researchers since the 1990s. One of the first articles published on this subject, in 1993, reported the administration of intracerebroventricular STZ in rats and analyzed the effects of glucose metabolism and glycogen in cerebral cortex and hippocampus. The researchers observed in this study that there was reduced glycolytic enzyme activity after the administration of STZ resulting from abnormalities in glucose degradation [15]. Since then, much more has been researched and discovered about the effects of sustained hyperglycemia on the central nervous system.
The significant loss of body weight in diabetic rats observed from the STZ induction model occurs due to the degradation of structural proteins, responsible for the rigidity, consistency and elasticity of the tissues, and also due to the increase in lipolysis. As insulin is responsible for regulating carbohydrate metabolism, protein synthesis, RNA synthesis, lipid formation and storage, the lack of this hormone decreases the synthesis and storage of cellular proteins, muscle glycogen and triglycerides in adipocytes, increasing protein catabolism and lipolysis, which contributes to a reduction in body weight [16].
In the case of liver disorders related to the diabetogenic process, although the analyzes have not shown significant results, recent research indicates that type 1 DM is also involved in the development of non-alcoholic fatty liver disease, although obesity is not considered a role significant pathogenic. Recent studies assume that adiponectin, an anti-diabetic, anti-atherogenic and anti-inflammatory adipokine, is involved in the progression and pathogenesis of hepatic steatosis. It is suggested that the level of adiponectin is inversely related to the accumulation of liver fat, and the increase in the level of this adipokine may alleviate the pathology of non-alcoholic hepatic steatosis [17].
Experimental models of DM in rats demonstrated in studies have been widely used in the reproduction of the symptoms of DM, since these animals have clinical similarities with the disease manifested in humans. After the application of STZ, blood glucose levels undergo characteristic changes of DM, including initially hyperglycemia and hyperinsulinemia, followed by transient hypoglycemia and finally, chronic hyperglycemia [16]. The experimental model used in the study proved that the drug acted in the destruction of pancreatic beta cells, since, in addition to the significant and persistent increases in fasting glycemia of the induced rats, the islets were reduced, distorted and to a lesser extent in the analysis histological analysis of the animals in the CG.
In the central nervous system, glucose is the mandatory energy substrate of adult neurons. Due to the preponderant expression of GLUT1 in the blood-brain barrier and GLUT3 in the plasma membrane of neurons, uptake occurs predominantly independent of insulin. Thus, intraneuronal glucose concentrations depend directly on extracellular concentrations, that is, on plasma glucose. In view of this, neurons belong to the targets hardest hit by hyperglycemia [18].
In contrast, persistent hyperglycemia induces oxidative stress causing damage to the peripheral nervous system, as is the case with diabetic neuropathies. Few studies have focused their attention on hyperglycemia in the human central nervous system [18]. According to Li, et al. [19], hippocampal atrophy shown on MRI scans can differentiate patients with AD from individuals with normal cognition. Therefore, considering the weights of the brain tissues of DG, the reduced values show a probable cerebral atrophy resulting from the neurodegenerative process, compared with the values of healthy rats belonging to the CG.
Analyzing, in the light of immunohistochemistry, one of the systems involved in chronic hyperglycemia, the dopaminergic neurons of the coeruleuslocus system were subjected to oxidative insults resulting from the diabetic process, presenting few survival mechanisms in the face of sustained hyperglycemia throughout aging. Motor deficits analyzed through the Open Field Test were possibly due to neurodegeneration, showing the relationship between a weak insulin response to neuronal declines [20].
Regarding the movements presented in the test by Campo Aberto, the act of sniffing the corners, observed in all animals in the study, can have an important meaning in the ethological area. Second Guilhermitti [14] sniffing the field represents an exploratory behavior of rats in the vicinity of a hole, observing the possibilities of exploring the site or not. This can be defined, according to the authors, as an underlying analysis process of information about the environment.
Regarding the acts of getting up, climbing on the walls and stretching, the animals in the CG showed significantly greater numbers of movements in relation to those in the DG. Guilhermitti [14], affirms that such acts represent cognitive activities that aim to collect information from an unknown environment, being an exploratory behavior directed to the area in question.
The self-cleaning behavior, an important component of rodents, was more observed in the animals of the CG in relation to the animals of the DG. Guilhermitti [14] states that this behavior consists of several patterns in a cephalocaudal directional process. The self-cleaning process is sensitive to changes in the animals' anxiety levels, and can be considered a behavioral response that accompanies changes caused by anxiogenic stimuli, being evidenced, significantly, intensely in the animals of the CG. The animals in the DG remained apathetic in almost all patterns of behavior.
Due to the poor general condition of the animals, it was necessary to anticipate the date of euthanasia, therefore not having the time necessary for the formation of amyloid bodies, nor having the time necessary to perform a glycated hemoglobin test in the animals.
The results suggest an intimate relationship between DM and AD, currently characterized as Type 3 Diabetes. Cellular death from oxidative stress in strong association with neuronal inflammation resulting from DM complications contributed to accelerated cerebral atrophy, being processing speeds and psychomotor slowing the cognitive spheres most affected. The noradrenergic changes that occurred due to sustained hyperglycemia caused premature aging of the central nervous system, culminating in neurodegenerations and early synaptotoxicities due to enzymatic reduction of tyrosine hydroxylase in brain tissue.
The authors thank the Department of Histology of the Faculdade Evangélica Mackenzie do Paraná or the production of histological slides. We would also like to thank the Programa Institucional de Bolsas de Iniciaçao Científica (PIBIC) for the funding.
The authors declare that the research was conducted in the absence of any commercial or financial relationships that could be construed as a potential conflict of interest.
This work was supported by Programa Institucional de Bolsas de Iniciaçao Científica (PIBIC).
All authors have read the manuscript, assisted in all aspects of the research study as well as the writing of the manuscript, and have agreed to the publication of this manuscript work.