Vitamin E, which exhibits anti-oxidant, anti-inflammatory, and anti-thrombogenesis properties, has been shown to improve retinal blood flow in diabetic retinopathy. This study aim to investigate the effects of Vitamin E (Tocovid) on retinal microhaemorrhages and diabetic macular edema (DME) in diabetic retinopathy. A total of 30 participants were randomly allocated to the treatment group or placebo group. The participants in the treatment group (n = 19) received 200 mg Tocovid twice daily while participants in placebo group (n = 21) received placebo twice daily for 12 weeks. Retinal lesions were assessed at baseline and week 12, and further reassessed at week 36 to investigate the long term effects of Tocovid after treatment cessation. Baseline assessment revealed significant negative correlation between serum Vitamin E level and sizes of retinal microhaemorrhages (p < 0.001) and DME (p < 0.05). Retinal lesions changes were equivocal at week 12. However, reassessment at week 36 revealed a significant decrease in sizes of retinal microhaemorrhages and DME in the treatment group compared to placebo group (p < 0.05). In conclusion, low serum Vitamin E level is associated with increased retinal microhaemorrhages and DME in diabetic retinopathy. Treatment with Tocovid for 12 weeks significantly decreased retinal microhaemorrhages and DME. Significant retinal lesion improvement was observed even after 24 weeks of treatment cessation.
Vitamin E, Antioxidant, Anti-inflammatory, Anti-thrombogenesis, Diabetes, Diabetic retinopathy, Retinal microhaemorrhages, Diabetic macular edema
Diabetes mellitus is a global health crisis of the 21st century, affecting 425 million (1 in 11) adults globally in 2017 [1]. The 2011 Political Declaration on Non-Communicable Disease (NCD) Prevention and Control Symposium listed diabetes mellitus as one of the four major NCD that warrants immediate attention [2]. Poorly controlled diabetes mellitus activates systemic low-grade inflammation which leads to disabling macrovascular and microvascular complications [3]. Diabetic retinopathy is the most common microvascular complication of diabetes mellitus [4]. Within 20 years of diagnosis, one in two individuals with diabetes mellitus will develop diabetic retinopathy [5,6]. To date, diabetic retinopathy is the leading cause of blindness among working-age adults given the rapid rise in prevalence of diabetes mellitus among younger populations [7].
Diabetic retinopathy is a progressive condition. It is classified into two major categories based on International Clinical Disease Severity Scale (ICDSS): (1) Non-proliferative diabetic retinopathy (NPDR), and (2) Proliferative diabetic retinopathy (PDR) [8]. NPDR represents the early stage of diabetic retinopathy which is frequently asymptomatic [9]. NPDR is further classified into mild, moderate, and severe based on the number and severity of vascular lesions [7,10]. PDR represents the late stage of diabetic retinopathy which is characterized by neovascularization and/ or vitreous or pre-retinal haemorrhage [7,10]. The one-year risk of progression from NPDR to PDR is 5% in mild NPDR, 15% in moderate NPDR, and 52% in severe NPDR [11] PDR is the primary cause of severe vision loss (≤ 20/200 vision) in individuals with diabetic retinopathy despite the availability of treatment [7,9,12]. Diabetic macular edema (DME) is another crucial factor affecting visual health in diabetic retinopathy. However, DME is not included in the ICDSS as a parameter for categorizing diabetic retinopathy severity. DME is characterized by retinal thickening or hard exudate formation on retina, which can form at any stage of diabetic retinopathy, even in the absence of retinal microaneurysms and haemorrhages [13-15]. Recent papers have revealed that clinically significant macular edema (CSME) is the main cause of moderate visual loss (≤ 20/40 vision) in diabetic retinopathy [9,14]. Given that DME is independently associated with adverse visual outcomes even in the absence of retinal haemorrhages, investigations on DME as an indicator of diabetic retinopathy progression is warranted [15].
Conventional treatment strategies for diabetic retinopathy targets PDR and CSME, which are late stages of diabetic retinopathy where significant visual loss has occurred. Widely adopted treatment options for PDR and CSME include anti-vascular endothelial growth factor (VEGF) injections and retinal laser photocoagulation therapy. The success rate of anti-VEGF injections in improving visual acuity by 3-lines is marginal at 29%, while laser photocoagulation therapy is associated with multiple adverse effects despite reducing severe visual loss by 50% [16,17]. Therefore, it is evident that prevention of disease progression at early stages of the diabetic retinopathy is crucial in preserving vision. Current prevention strategies for NPDR, the early stage of diabetic retinopathy involves strict glycemic, lipid, and blood pressure control. However, these strategies proved inadequate as evident by the persistently high and increasing prevalence of visual loss due to diabetic retinopathy [18].
Oxidative stress and pro-thrombotic state induced by chronic hyperglycemia play important roles in the pathogenesis of diabetes mellitus-related complications. Chronic hyperglycemia causes lipid peroxidation, which leads to maladaptive systemic low-grade inflammation [19,20]. Chronic inflammation in turn induces pro-thrombotic state through arachidonic acid-thromboxane pathway, which causes leukostasis and increased platelet activation [3,21,22]. Subsequently, damaged retinal capillary cell wall leads to formation of microhaemorrhages and DME [21]. Platelet aggregates and thrombi is observed in retinal vessels of diabetic individuals even in early stages of diabetic retinopathy [23]. As a result, retinal blood flow in individuals with diabetes is significantly decreased compared to non-diabetic individuals (p < 0.05) [24]. These discoveries have sparked researches on the effects of antioxidants and antithrombotic agents on diabetes mellitus.
Over the last decade, an increasing number of researchers have explored the effects of Vitamin E on diabetic retinopathy. Vitamin E is a fat soluble micronutrient which exhibits antioxidant, anti-inflammatory, and anti-thrombogenesis properties. Vitamin E has been shown to improve retinal blood flow, thus preventing diabetic retinopathy progression [20,24-28]. Nevertheless, a systematic review on six cross-sectional studies from 1993 to 2004 failed to demonstrate the association between vitamin E and diabetic retinopathy [29]. The systematic review was limited by inconsistent diabetic retinopathy categorization, variable vitamin E concentration measurements, and inability to investigate the temporal relationship between vitamin E and diabetic retinopathy [29]. In 1999, investigators from Harvard Medical School pioneered the investigation on temporal effects of Vitamin E on diabetic retinopathy [24]. The study reported normalization of retinal blood flow in diabetic retinopathy after treatment with 1,800 IU (1,200 mg) vitamin E per day for four months [24].
Recent evidence revealed that retinal signs are potential alternatives to modified Airlie House Classification, a diabetic retinopathy progression classification tool commonly used in research settings. Although useful in research settings, the Airlie House Classification is complex and not practical for daily clinical practice [12]. The number and severity of retinal haemorrhages has been shown to correlate with progression of diabetic retinopathy [30]. The reversibility of retinal haemorrhage is implicated through reversible abnormal fluorescein leakage in fluorescein angiography [31]. The present study aimed to establish the correlation between serum Vitamin E (α-tocopherol) level and severity of diabetic retinopathy based on retinal microhaemorrhages and DME. The second aim is to investigate the effects of Vitamin E (Tocovid at 400 mg per day) on NPDR in type 2 diabetes mellitus, where progression of NPDR is evaluated through retinal microhaemorrhages and DME.
This pilot, dual-centre, double-blind, randomized, placebo-controlled trial was conducted at Clinical Research Centres in Kuala Lumpur and Johor in Malaysia. The design and conduct of this study adhered to standards of the Declaration of Helsinski. Participants were enrolled from January 2018 to March 2018. This study involved treatment of non-proliferative diabetic retinopathy in type 2 diabetes mellitus with vitamin E (Tocovid) for 12 weeks, followed by reassessment at week 36 to investigate the long term effect of vitamin E on NPDR after treatment cessation. Written informed consents were obtained from participants before participating in the study. This study was approved by Monash University Human Research Ethics Committee (MUHREC) with project number 12090.
Inclusion criteria were individuals aged between 35 to 75-years-old with type 2 diabetes mellitus and non-proliferative diabetic retinopathy. Type 2 diabetes mellitus is diagnosed based on 2006 World Health Organization diagnostic criteria, with fasting plasma glucose level of greater than 7.0 mmol/L, 2-hours post-prandial glucose level of greater than 11.0 mmol/L, or HbA1c level of greater than 6.5%. The glucose control must be stable throughout the past three months (less than 10% change in HbA1c level). Non-proliferative diabetic retinopathy is diagnosed through coloured fundus photographs and graded by an external qualified ophthalmologist based on International Clinical Disease Severity Scale (graded as mild, moderate, or severe non-proliferative diabetic retinopathy).
Exclusion criteria were individuals with unstable eye conditions, individuals who had anti-vascular endothelial growth factor injections, retinal laser photocoagulation therapy, intravitreal steroid injections, on steroid therapy for any reason, and individuals who consumed fenofibrates. Also excluded were individuals who consumed water-soluble anti-oxidants within the past one month, including but not limited to ascorbic acid, glutathione, flavonoids, and melanin; as well as individuals who consumed lipid-soluble anti-oxidants within the past three months, including but not limited to carotenoids, Vitamin D, Vitamin K, and Coenzyme Q10. Individuals who were pregnant or lactating, or individuals who smoked more than 20 cigarettes per day were also excluded. Both eyes from the same participant were included in the study if they both met the inclusion and exclusion criteria. In such cases, both eyes were analyzed in the group that the patient was allocated.
The sample size for this pilot study was calculated using Raosoft online sample size calculator available at www.raosoft.com/samplesize.html. The number of patients at trial centers was approximately 100. A sample size of 80 eyes is required to produce outcomes with a confidence interval of 95% and confidence limit of 5%. This equates to 40 participants in total, with 20 participants in each group. After adjusting for a dropout rate of 10%, the adjusted sample size was determined at 21 participants in each group. Both eyes of the same participants were included in outcome assessment if both eyes met the inclusion criteria. Each eye of the same participant was assessed independently for outcomes. Both eyes may have different severity of diabetic retinopathy, where the degree of effect of Vitamin E on each eye may be different.
For individuals who met the study criteria and consented to participate in the study, anthropometric measurements, safety tests, and fundus photography were carried out. Anthropometric measurements include weight and body mass index. Baseline blood pressure, fasting glucose level, HbA1c level, urinalysis, liver function test, renal function test, lipid profile, and electrocardiography were measured and recorded.
Stratified randomization was performed through computer-generated random-sequence by an unmasked study coordinator using Microsoft Excel software. The study coordinator was not involved in outcome assessment, data collection, or data analysis throughout the study. Study investigators and participants remained blinded to group allocation and investigational product allocation throughout the study. Participants were stratified based on gender (male or female), HbA1c level at screening (< 8.0% or ≥ 8.0%), and duration of diabetes mellitus at screening (< 15 years or ≥ 15 years).
Participants were randomized to one of two groups: the treatment group received Vitamin E (Tocovid SuprabioTM) (Hovid Berhad, Ipoh, Malaysia) 200 mg twice daily, while the placebo group received placebo twice daily for 12 weeks. This dosage is the maximum dose approved by the Food and Drug Administration (FDA). It was selected as lower doses failed to produce clinically significant findings [20]. Both investigational products were soft gels that were visually indistinguishable. They were packed by the study coordinator in identical containers labeled only with study subject number, drug code, and dispensing date. Investigational products were dispensed to patients four weekly. Patients were advised to store the investigational products at room temperature away from direct sunlight and to consume investigational products after meals.
Participants were reviewed four weekly during the 12 weeks' treatment period. Participants were reminded through phone calls to attend follow-up visits after fasting for at least eight hours. At each follow-up visit, participants were monitored for adverse events and compliance to treatment through soft gel counts. Anthropometric measurements, safety tests, and retinal photographs were repeated at week 12 and week 36. Serum Vitamin E (α-tocopherol) level and retinal photographs were assessed at baseline, week 12, and week 36.
Anthropometric measurements: Height (meter), weight (kilogram), and body mass index (kilogram per meter square) were measured using an automated body mass index measuring stadiometer BSM 370 (Biospace Co., Seoul, Korea). Waist circumferences were measured using a measuring tape positioned just above the hip bone. The measurement of waist circumference was taken in centimeters just after the patient breathed out.
Blood pressure: Blood pressure was measured using Omron 705IT automatic blood pressure monitor (HEM-759-E, Omron Corporation, Kyoto, Japan). At least three blood measurements per patient were recorded to obtain an average value. Additional blood pressure measurements were taken when the difference between blood pressure reading was > 10 mmHg systolic or > 5 mmHg diastolic. Participants were allowed to sit and rest for at least five minutes before taking the first blood pressure measurement. During blood pressure measurement, the arm was allowed to rest at heart level and legs uncrossed. Subsequent blood pressure readings were taken one minute apart.
Haemoglobin A1c: Haemoglobin A1c (HbA1c) is a measure of glycemic control over a period of three months. Blood samples were collected in EDTA vacutainers and sent to laboratory for measurements using Cobas Integra 400 plus analyzer (Poche Diagnostics, Canada). The test has a measuring range of 4.3%-18.8% with coefficient variance of < 5%.
Fasting blood glucose: Venous blood was collected in BD Vacutainer® glucose tubes in fasting state. Fasting blood glucose level was measured using assay kits (Cobas 6000 Analyzer, Roche Diagnostics, SA). This assay kit has coefficient of variance of < 4%.
Safety tests: Safety tests performed include renal function test, lipid profile, and liver function test. Venous blood samples were collected in a serum-separating tube (SST). Blood samples were allowed to clot for two hours at room temperature. Subsequently, blood samples were centrifuged (Eppendorf Centrifuge 5702R, Hamburg, Germany) at 3,600 rpm for 15 minutes to separate serum. Serum was extracted and assayed at the laboratory for serum creatinine, blood urea nitrogen, lipid profile, and liver function test (Abbott diagnostic ARCHITECT, Illinois, United States). These assays have coefficient of variances of < 6%.
Patient preparation: Two drops of Tropicamide 1% (Alcon®, Cointrin-Geneva, Switzerland) eye drop were applied to each eye to dilate the pupil to more than 4mm in diameter. The diameter of pupils was assessed through the Fundal camera Digital Retinography System (DRS) (CenterVue Fremont, USA). Eye drop application was repeated at 20 minutes' interval when the pupil's size was unsatisfactory. The maximum number of eye drop application was three times per session.
Retinal fundus photography session and processing: After 20 minutes of eye drop application, participants were invited into a procedure room for a retinal photography session. Each retinal photography session took at least 15 minutes depending on the participant's performance. Patients were briefed regarding the procedures to improve cooperation and to obtain the best quality images with minimum artefacts. Patients were instructed to remain still and not blink when the fundus photos were taken. Lights were switched off to reduce light interference. Chin rest of fundal camera Digital Retinography System (DRS) (CenterVue, Fremont, USA) was adjusted to ensure proper alignment of the participant's eye to the camera. Specifications of DRS fundal camera are provided in Table 1. Seven different fields of the retina were taken, as shown in Figure 1.
 Figure 1: Seven 45° × 40° retinal image fields taken for the right eye.
View Figure 1
Figure 1: Seven 45° × 40° retinal image fields taken for the right eye.
View Figure 1
Table 1: Specification of DRS fundal camera. View Table 1
Retinal photographs were magnified 100 times to reveal microhemorrhages and DME. Photographs were downloaded as JPG files and transferred to the computer using a pendrive for montaging. Seven different fields of colour fundus photographs per eye were merged using Dual Align i2k Retina® Montage Software. The montaged images (retinal maps) were saved as JPEG files as shown in Figure 2.
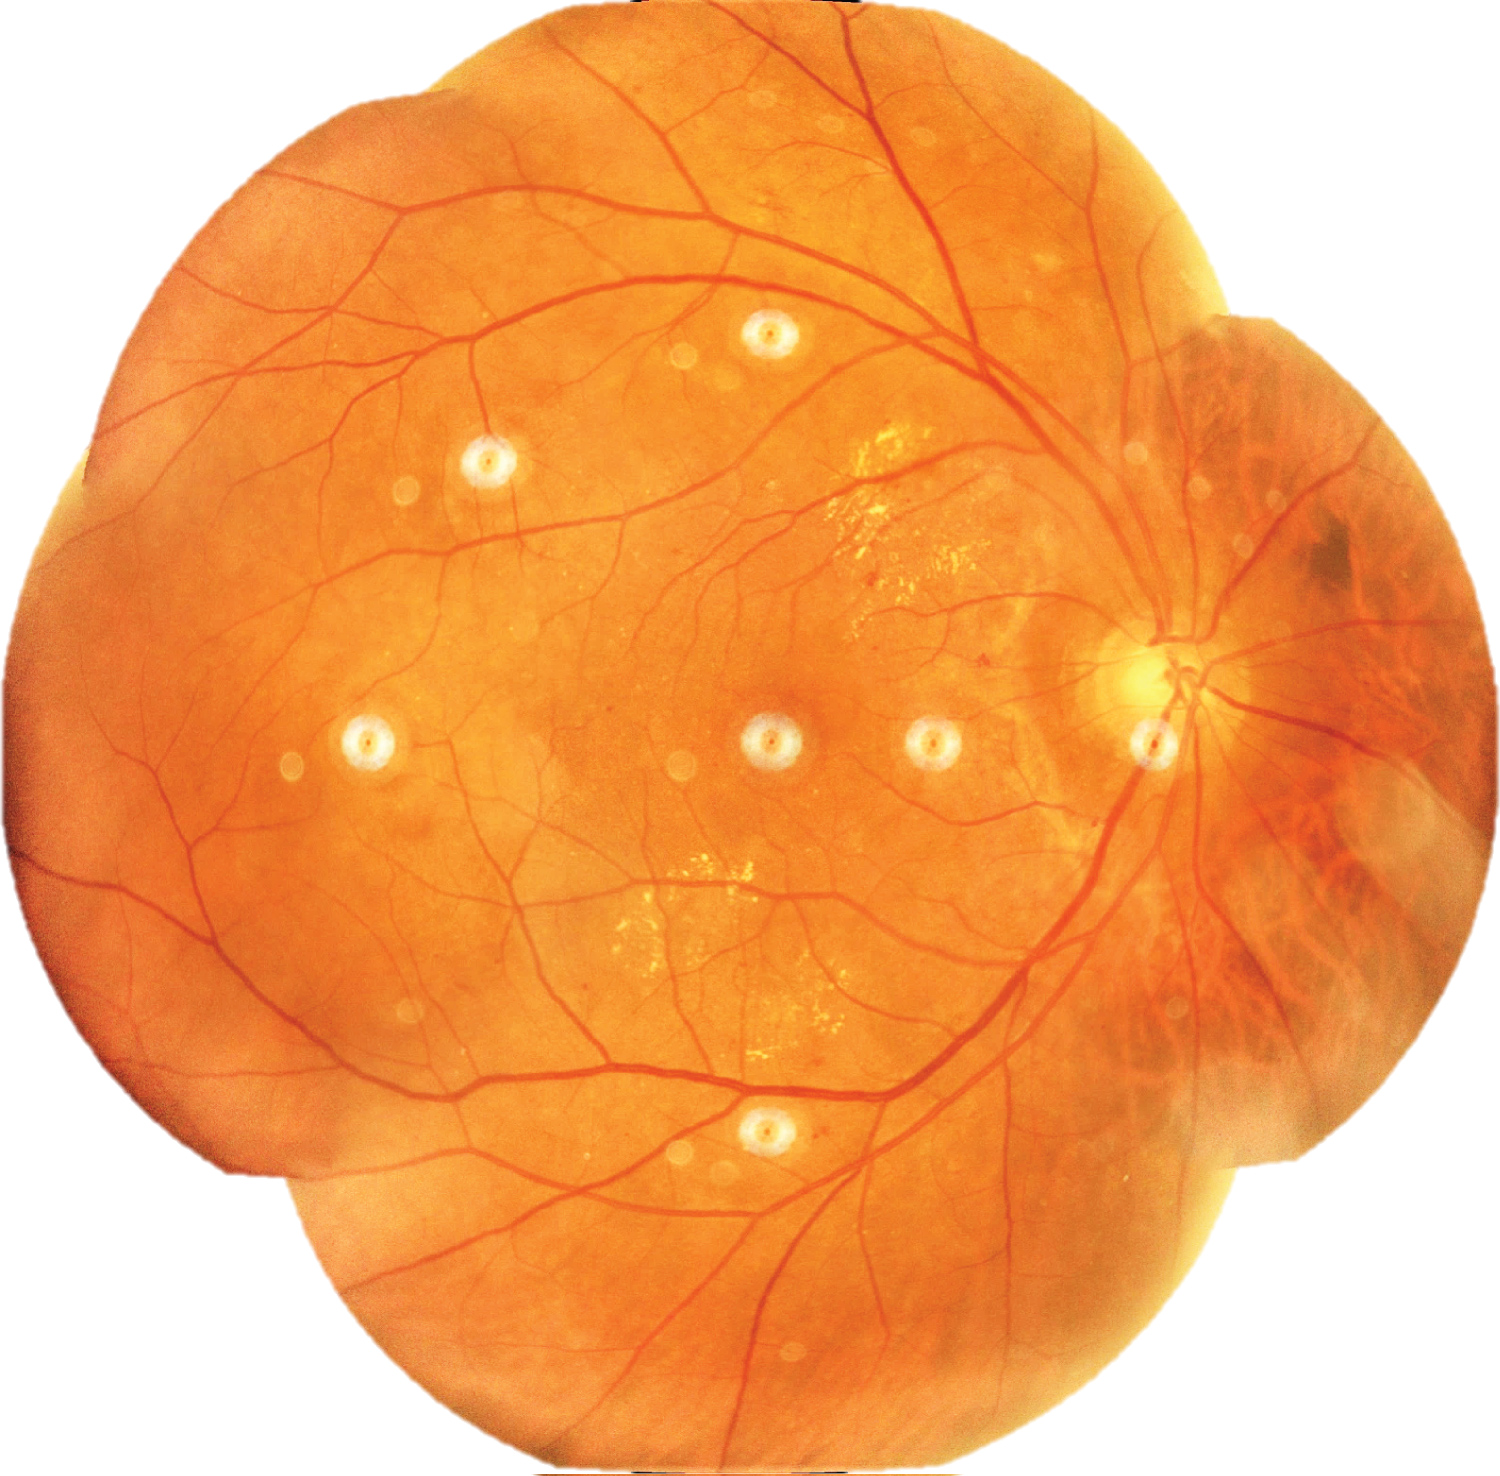 Figure 2: Retinal map of right eye constructed using i2k Retina® Montage Software.
View Figure 2
Figure 2: Retinal map of right eye constructed using i2k Retina® Montage Software.
View Figure 2
Methodology for determining area of intraretinal microhaemorrhage and diabetic macular edema: The sizes of retinal microhaemorrhages and diabetic macular edema on follow-up visits were measured for primary outcome assessment. They were recorded based on the following formulas:
1. Retinal microhaemorrhages per area of retina = , and
2. Diabetic macular edema per area of retina = , where
3. Area of Net Retina =
Area of net retina was measured to account for variation in area of total retina between follow-up visits and among patients. Artefacts that may occur on retinal photographs include center point of camera lens, dusts on camera lens, unclear portions of photographs due to cataract formation, as well as shadow of iris, eyelashes, and eyelid. Where removal of artefacts was not possible, areas of artefact were deducted from area of full retina to obtain the net area of retina.
Outcomes of retinal findings were expressed as percentage change in retinal microhaemorrhage or DME using the following formula:
Areas of retinal microhaemorrhages and DME were measured using ImageJ software. They were magnified to 75% using the 'magnifying glass' tool to reveal retinal haemorrhages and DME. Multiple areas of interest of retinal microhaemorrhages, DME, and artefacts were selected using 'area selection' tool as shown in Figure 3, Figure 4 and Figure 5 respectively. The total area of retinal microhaemorrhages and DME was measured using 'analyze' and 'measure' tools. The measurements in pixel units were recorded in Microsoft Excel.
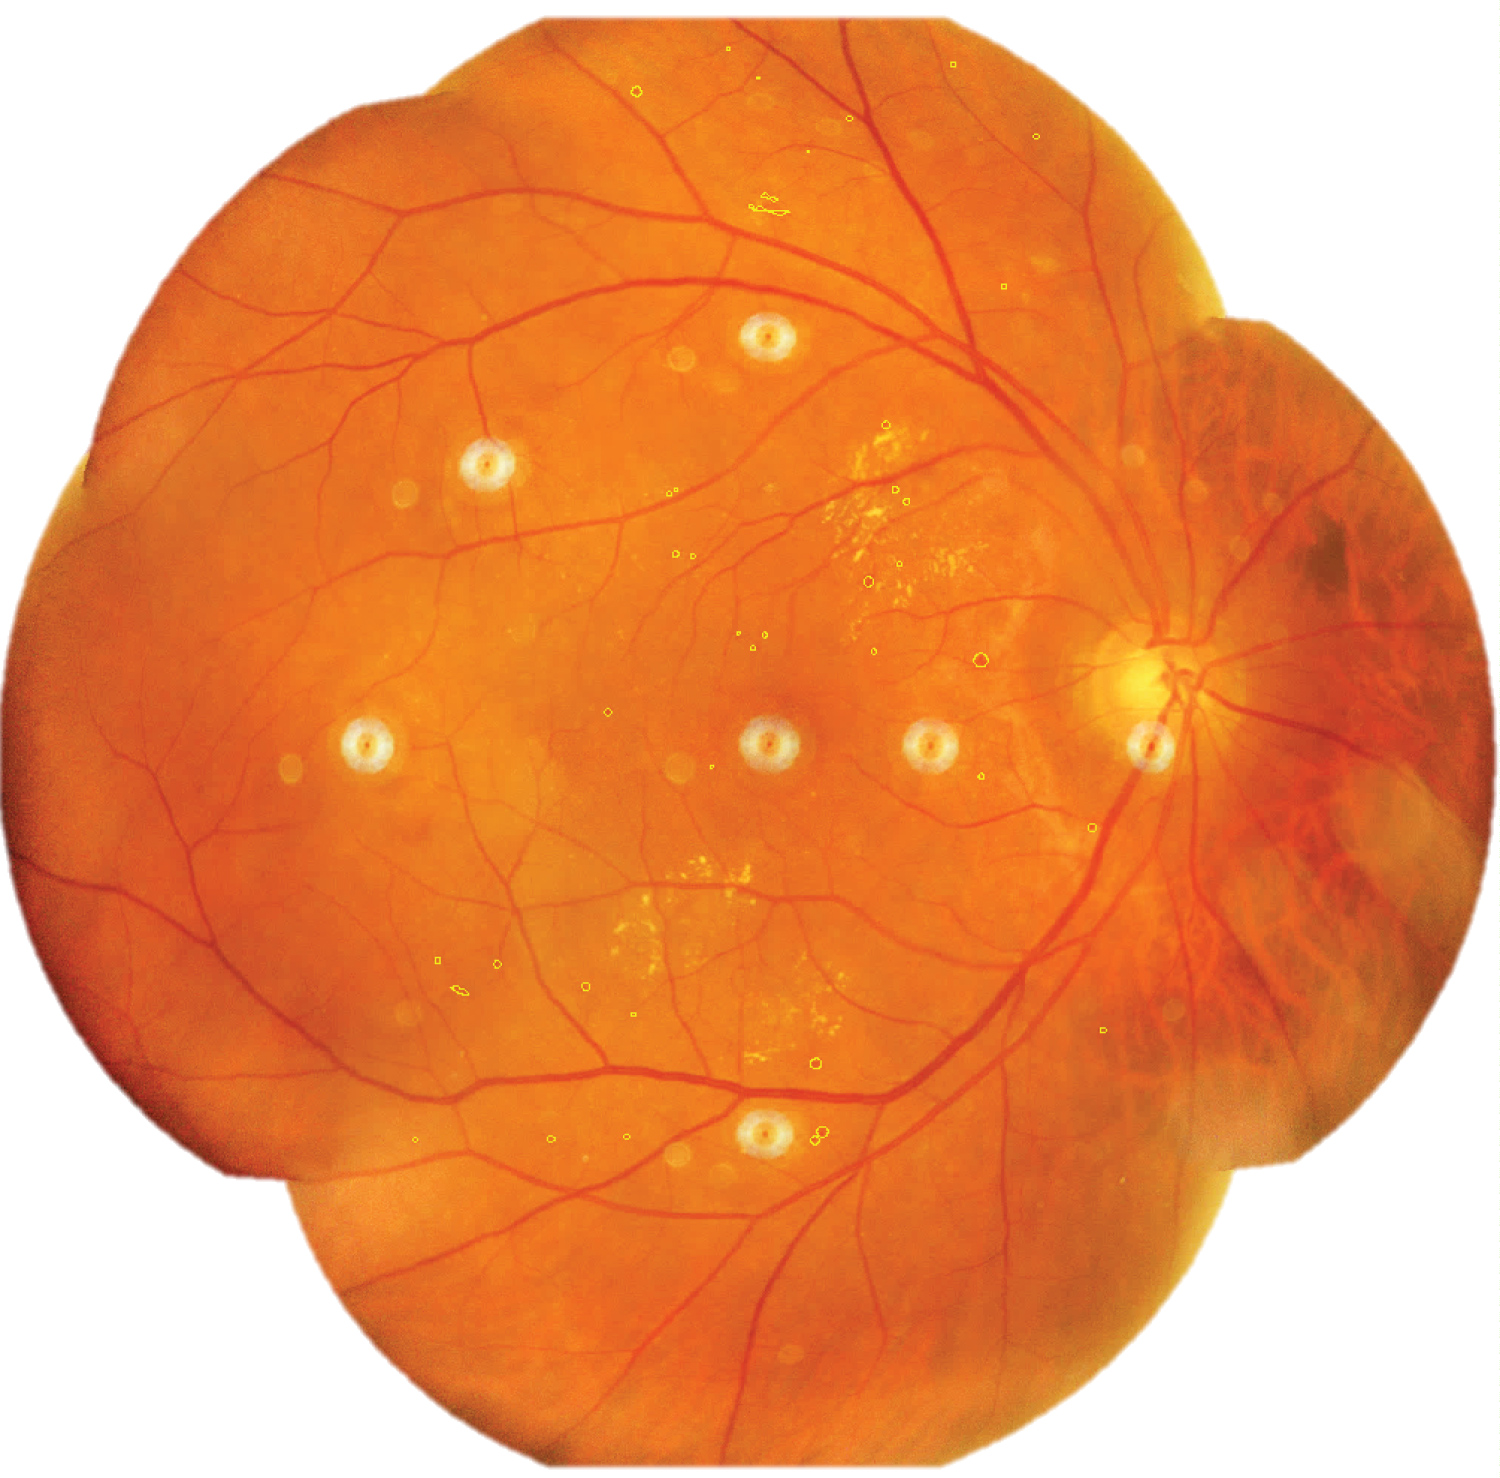 Figure 3: Selected areas of retinal microhaemorrhages (outline).
View Figure 3
Figure 3: Selected areas of retinal microhaemorrhages (outline).
View Figure 3
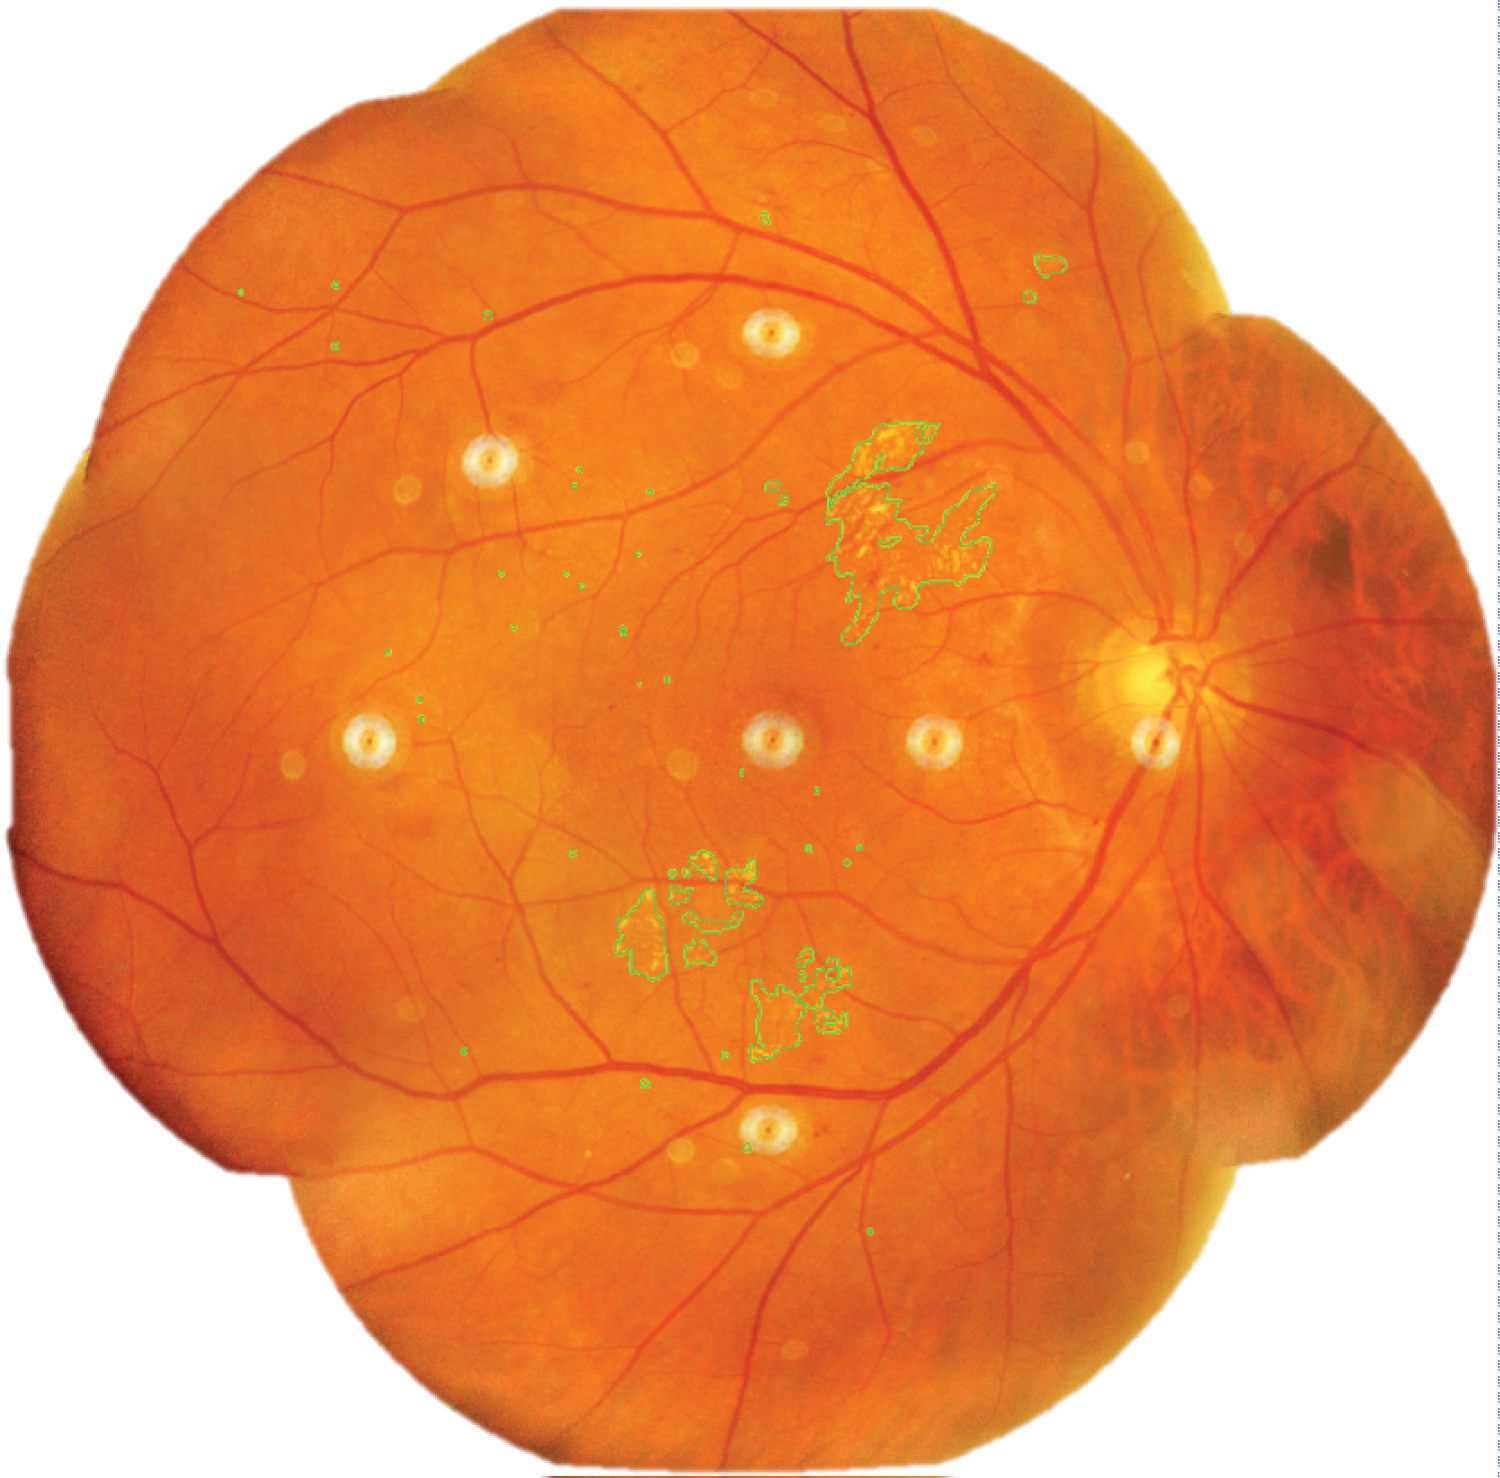 Figure 4: Selected areas of diabetic macular edema (outline).
View Figure 4
Figure 4: Selected areas of diabetic macular edema (outline).
View Figure 4
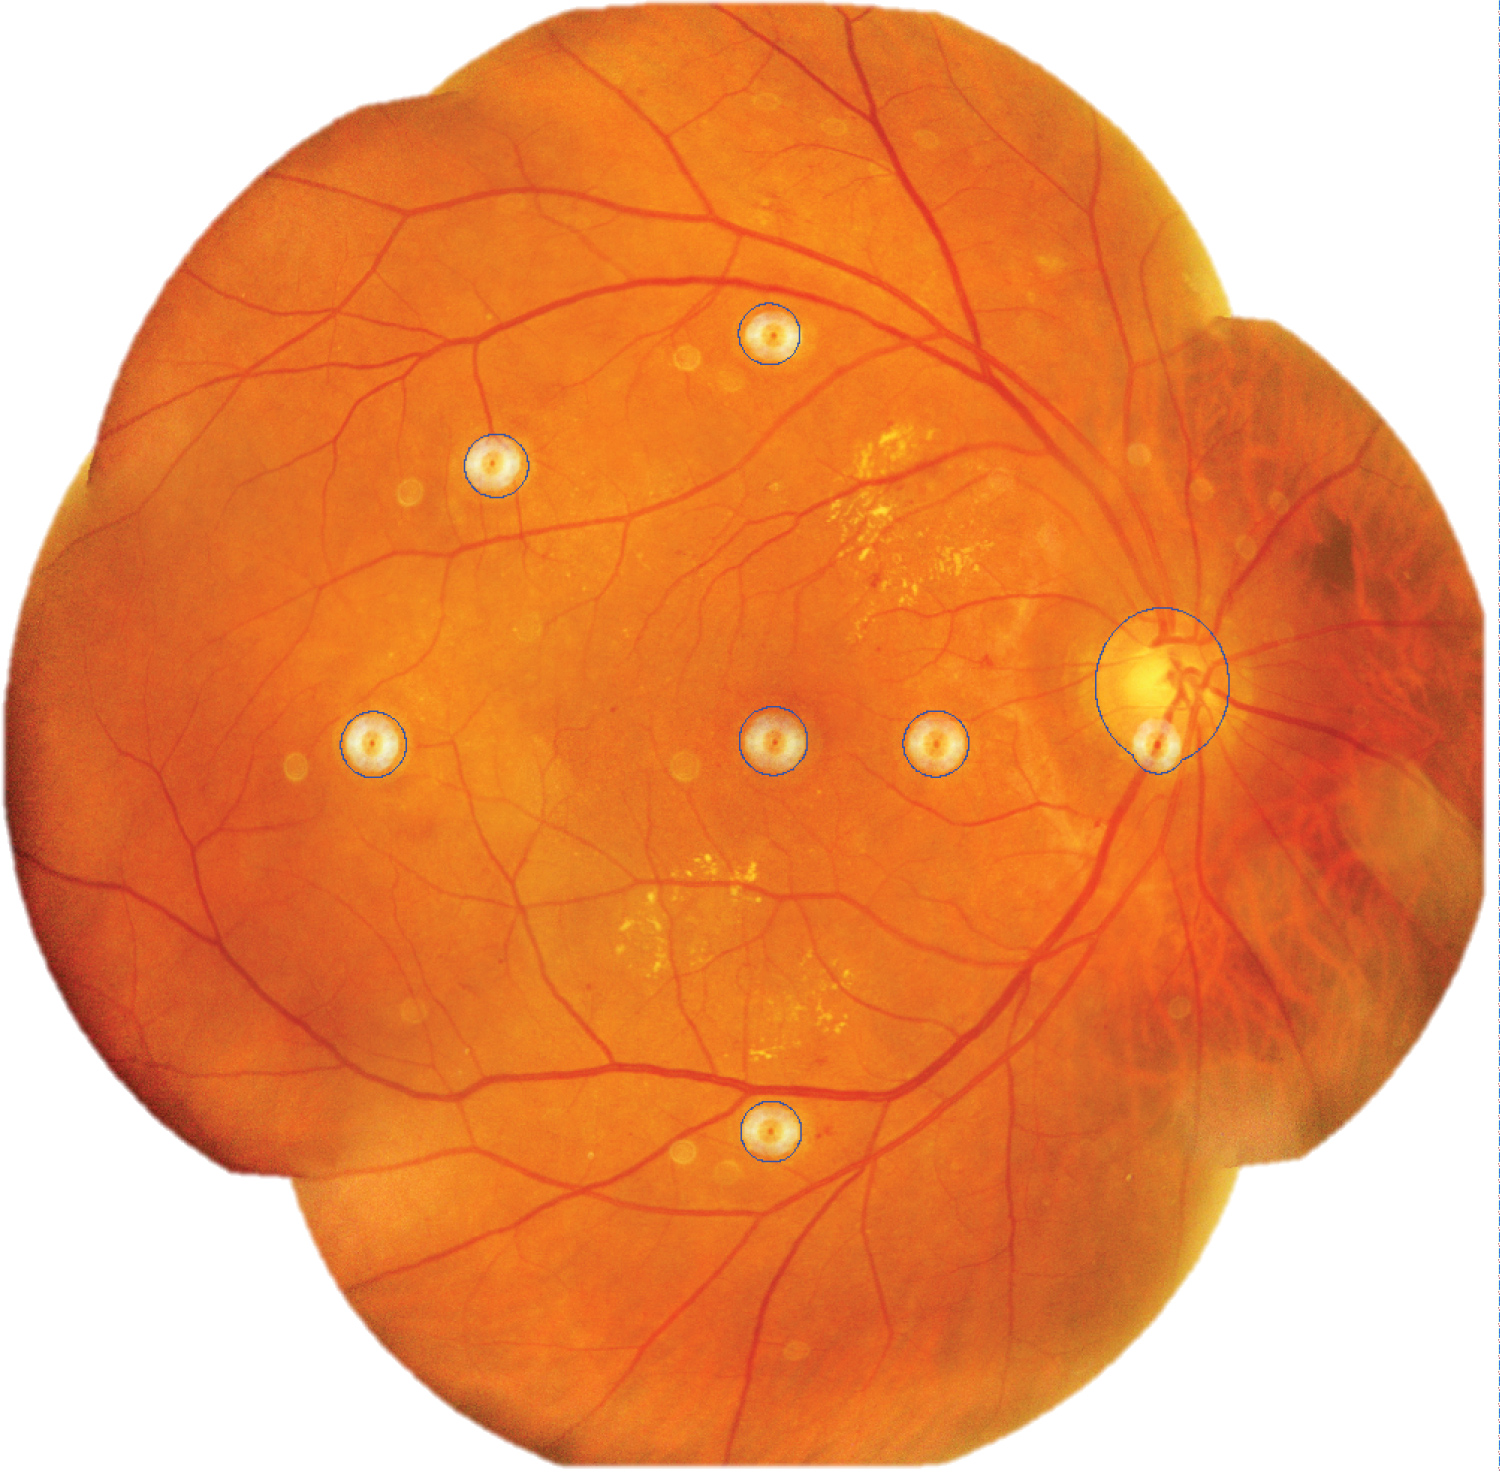 Figure 5: Selected areas of artefacts from camera lens and optic disc (outline).
View Figure 5
Figure 5: Selected areas of artefacts from camera lens and optic disc (outline).
View Figure 5
Retinal assessment measurement reliability: All areas of retinal microhaemorrhages and DME on retinal photographs were measured by the same assessor to prevent inter-assessor variation in outcome assessment. To assess the reliability of measurements, 15% of retinal photographs were randomly selected using Mircrosoft Excel RAND function for intra-rater and inter-rater analysis. Intra-rater reliability assessment was performed by Rater A on Day 1 and repeated on Day 14. Inter-rater reliability assessment was performed by comparing Rater A and Rater B assessments on the same day (Day 1).
Intra-rater reliability: The degree of intra-rater reliability for retinal microhaemorrhages and DME was significantly high as shown in Figure 6 and Figure 7 respectively. The interclass correlation coefficient (ICC) for retinal microhaemorrhages was 0.92 (p < 0.001, 95% CI 0.77-1.10), while the ICC for DME was 0.99 (p < 0.001, 95% CI 0.89-1.07). Scatterplots of intra-rater analysis for retinal microhaemorrhages and DME showed strong, positive, linear association in microhaemorrhage and DME counts by Rater A between Day 1 and Day 14 with few mild outliers.
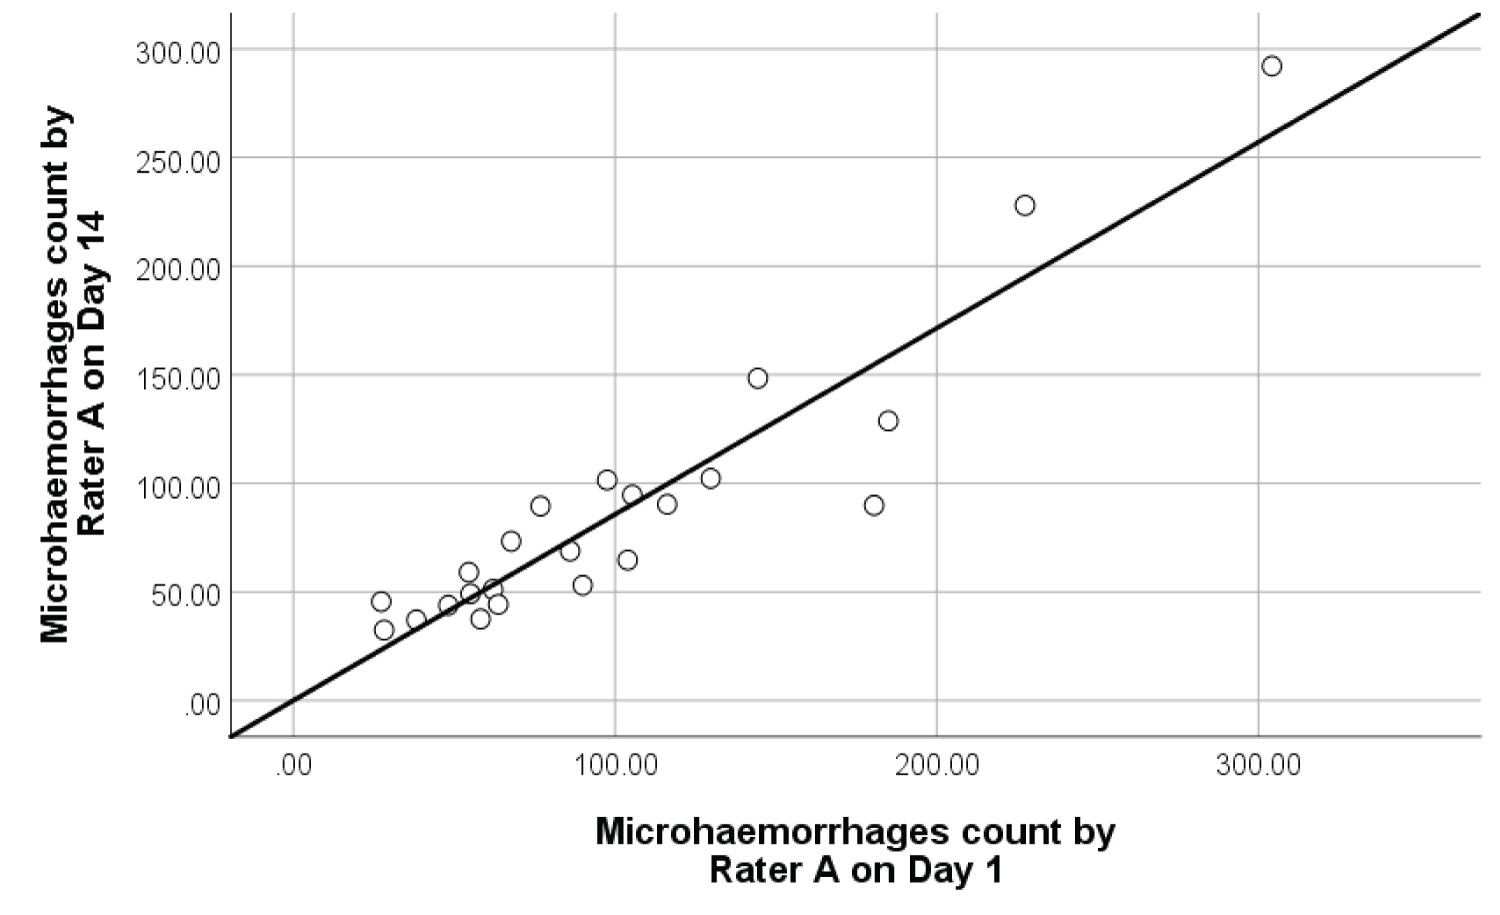 Figure 6: Intra-rater reliability scatterplot with best fit line on 23 samples of retinal microhaemorrhages.
View Figure 6
Figure 6: Intra-rater reliability scatterplot with best fit line on 23 samples of retinal microhaemorrhages.
View Figure 6
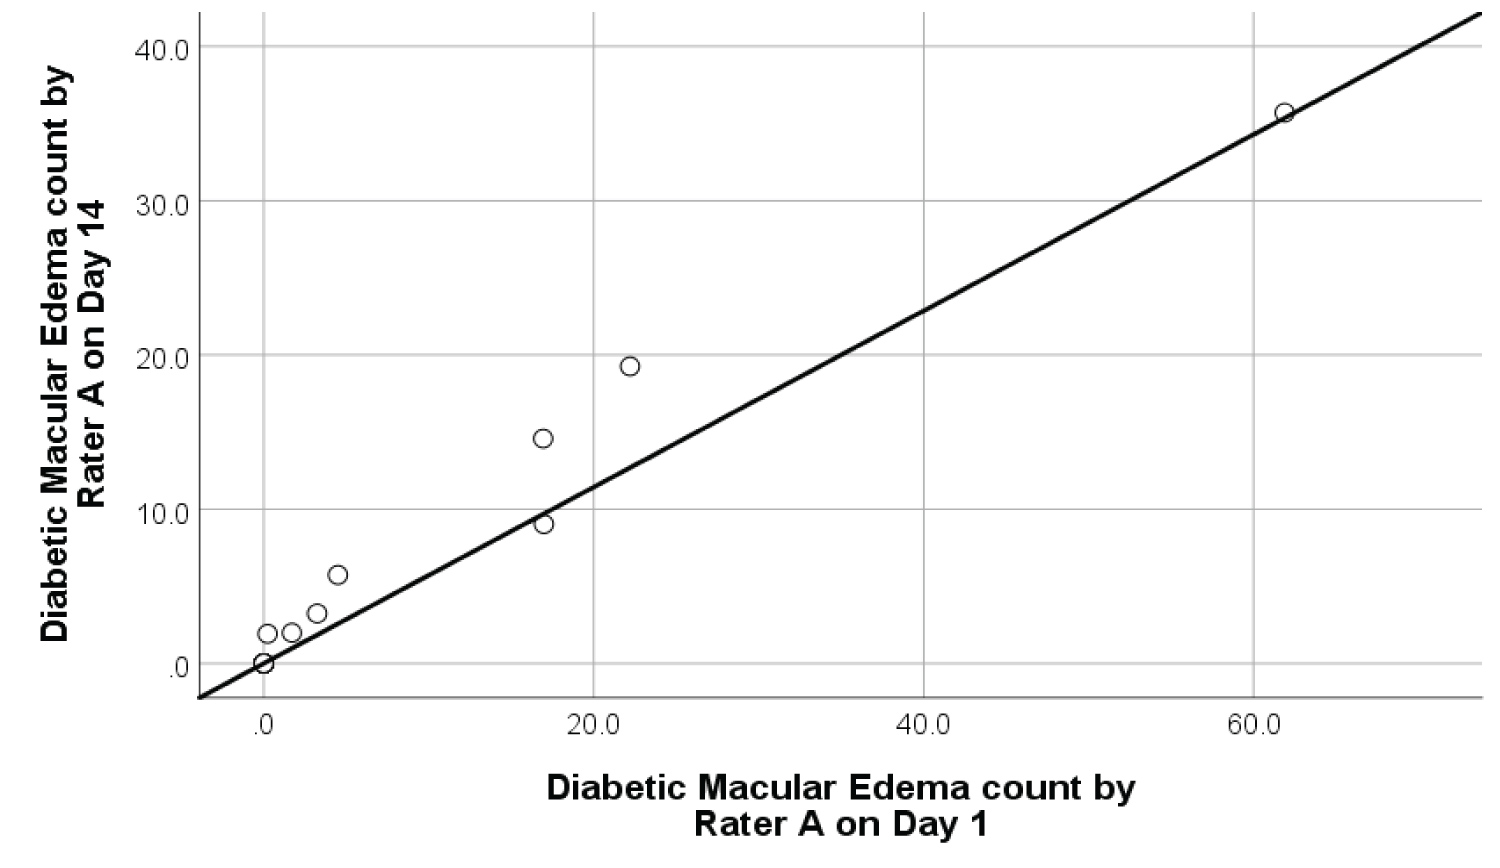 Figure 7: Intra-rater reliability scatterplot with best fit line on 9 samples of diabetic macular edema.
View Figure 7
Figure 7: Intra-rater reliability scatterplot with best fit line on 9 samples of diabetic macular edema.
View Figure 7
Inter-rater reliability: The degree of inter-rater reliability of retinal microhaemorrhages and DME was significantly high as shown in Figure 8 and Figure 9. The ICC for retinal microhaemorrhages was 0.93 (p < 0.001, 95% CI 0.87-1.09), while the CCI for DME was 0.99 (p < 0.001, 95% CI 0.78-1.14). Scatterplots of inter-rater analysis showed positive, non-linear association in microhaemorrhage and DME count between Rater A and Rater B on Day 1. In most cases, rater B produced a larger area of retinal microhaemorrhages compared to Rater A given the same retinal photograph. This may be attributed to slight variation in manually outlined retinal microhaemorrhages by Rater B in using ImageJ software.
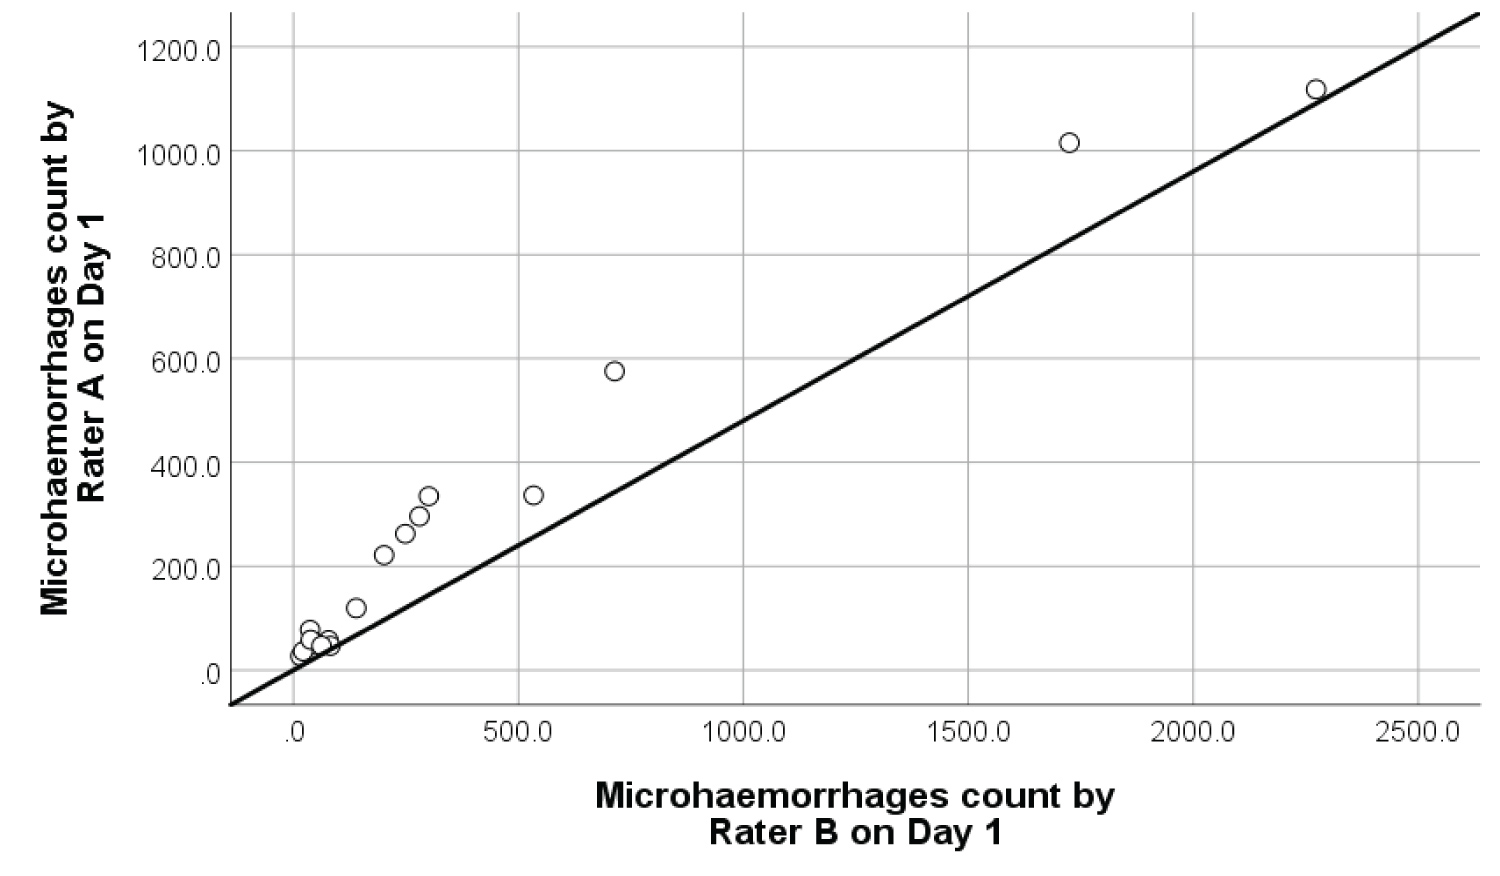 Figure 8: Inter-rater reliability scatterplot with best fit line on 18 samples of retinal microhaemorrhages.
View Figure 8
Figure 8: Inter-rater reliability scatterplot with best fit line on 18 samples of retinal microhaemorrhages.
View Figure 8
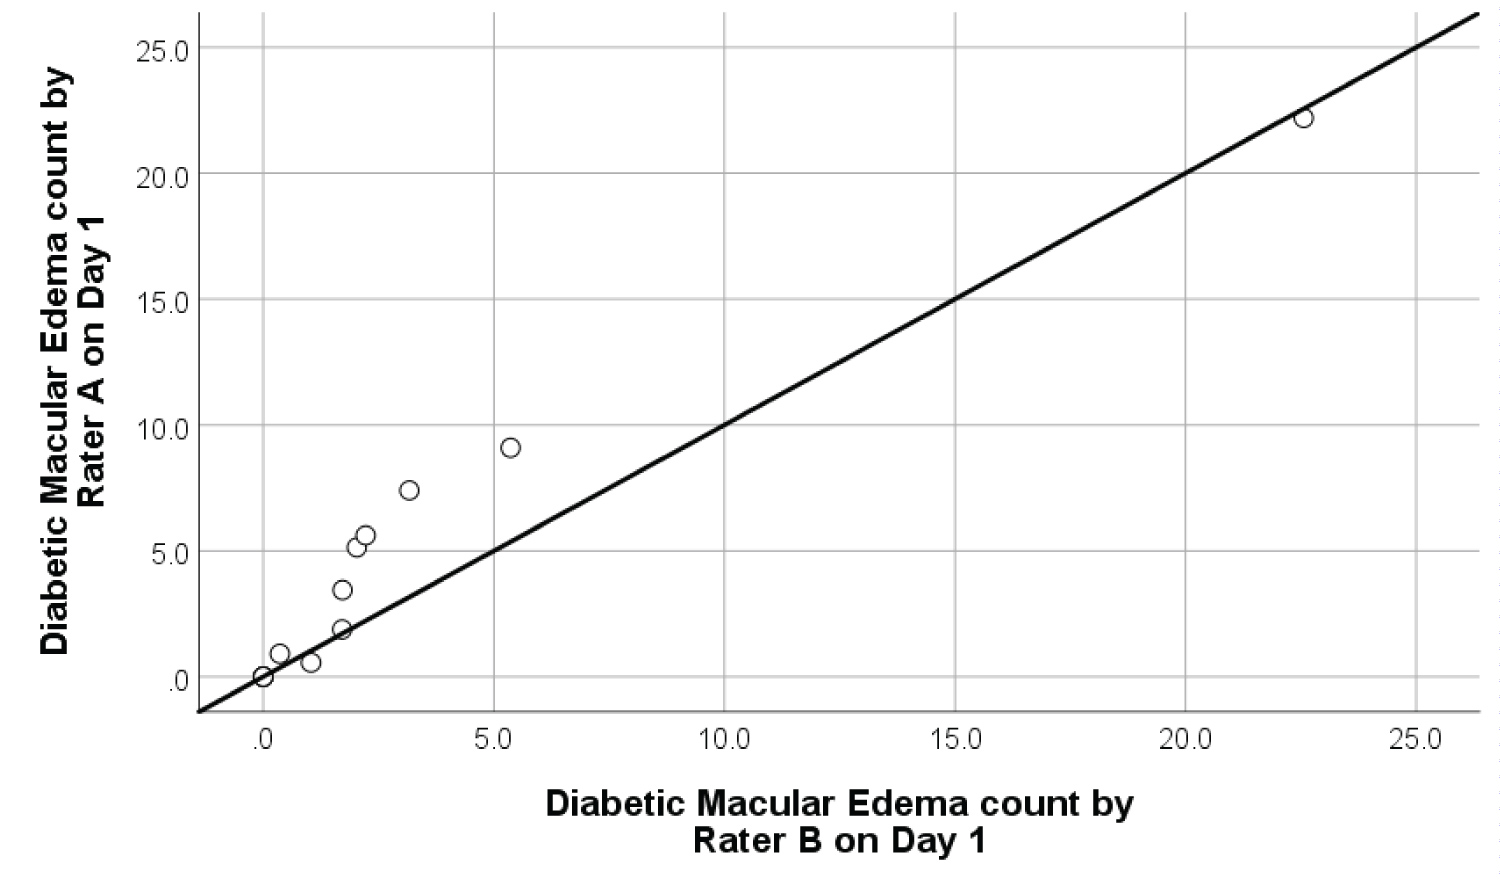 Figure 9: Inter-rater reliability scatterplot with best fit line on 10 samples of diabetic macular edema.
View Figure 9
Figure 9: Inter-rater reliability scatterplot with best fit line on 10 samples of diabetic macular edema.
View Figure 9
Preparation of serum samples: Serum tocopherol level was measured for quantitative assessment of Vitamin E intake. Venous blood was collected in an Ethylenediaminetetraacetic acid (EDTA) vacutainer. Samples were centrifuged (Eppendorf Centrifuge 5702R, Hamburg, Germany) at 3,600 rpm for 15 minutes at 8 ℃ to obtain serum. Serum was extracted in 1 ml eppendorfs and stored under -80 ℃. Measurements were performed when all samples had been collected to minimize inter-assay variation.
Serum preparation for High Performance Liquid Chromatography (HPLC) was carried out under low ambient light condition to minimize light-induced degradation of antioxidants. 200 µL serum and 100 µL ethanol-BHT (0.0625%) were pipetted into an amber microcentrifuge tube. The mixture was vortexed for 15 seconds for deproteinization. 1 ml n-hexane-BHT was added into the mixture. The mixture was vortexed and shaken alternatively for five minutes and centrifuged for three minutes at 2000 xg. Subsequently, the tube was placed on ice to improve phase separation. 900 µL of supernatant was aliquoted into an amber microcentrifuge tube. Extraction was repeated twice with nr-hexane BHT. The extract was evaporated to dryness by centrifugal evaporation. Evaporated extract was added into 100 µL ethanol-BHT and vortexed for three minutes. Samples were placed on ice before analysis.
High Performance Liquid Chromatography (HPLC): The chromatographic system used was an Agilent HPLC 1200 with a fluorescence detector. α-tocopherol was separated on a Phenomenex Kinetex TM PFP column (5.0 µm, 150 × 4.6 mm; Phenomenex) using methanol/ -H2O (87: -13) as an eluent at a flow rate of 0.9 mL/min. The fluorescence detector was set at excitation wavelength of 296 nm, emission wavelength of 325 nm, and photomultiplier tube (PMT) gain at 10.
All statistical analyses were conducted using Statistical Package for Social Sciences (SPSS) version 25 (IBM SPSS Inc, Chicago, IL, USA). The baseline demographics, safety tests, and ophthalmological parameters of participants were compared between the treatment and placebo groups. All outcomes were analyzed on modified intention-to-treat analysis (complete-cases analysis). Independent t-test and Mann-whitney test were used for continuous and non-continuous variables respectively when comparing between the two groups. Fisher's Exact test was used for categorical variables. Repeated measures ANCOVA were used to compare parameters at three time points between the treatment and placebo groups. The reliability of retinal microhaemorrhages and DME area calculation was estimated by interclass correlation coefficient (ICC) using non-parametric Spearman correlation for medians (poor degree of agreement = 0.00-0.20, fair agreement = 0.21-0.40, moderate agreement = 0.41-0.60, strong agreement = 0.61-0.80, while near complete agreement = 0.81-1.00). Confidence interval for ICC was constructed using Fisher's z-transformation. A p-value of less than 0.05 was considered statistically significant.
A total of 60 patients were screened for eligibility at Sunway and Johor Bahru Clinical Research Centers within two months. Of these patients, 41 participants were enrolled. At week 36, 30 participants returned for reassessment. 11 participants were lost to follow-up. 6 participants refused to return while 5 participants did not answer phone calls. Complete case analysis was performed where 58 eyes of 30 participants were included in final analysis of this study. The summary of participant recruitment flowchart is shown in Figure 10. Treatment compliance rate was above 90% in both groups. No serious adverse event or adverse drug reaction was reported.
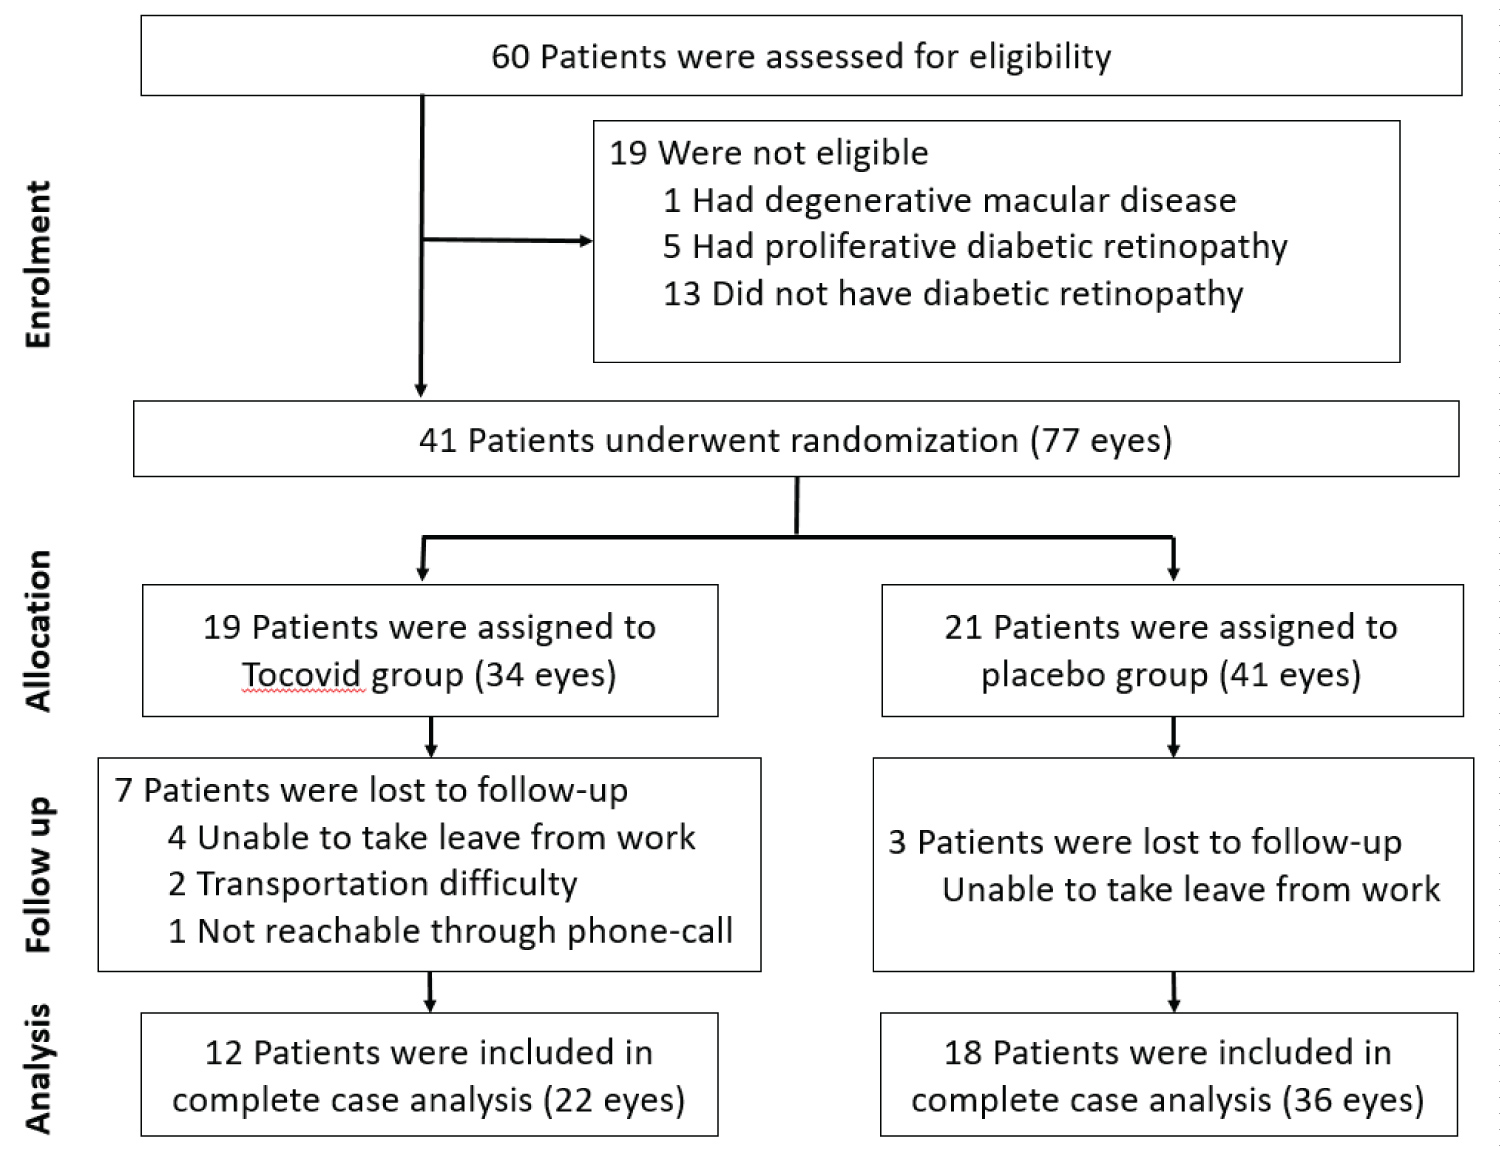 Figure 10: Summary of patient flow diagram.
View Figure 10
Figure 10: Summary of patient flow diagram.
View Figure 10
Baseline characteristics of 30 participants who completed all follow up visits are shown in Table 2. Participants consisted of 24.4% female. 51.7% of eyes assessed were right eyes. The cohort had 48.8% Malay, 17.1% Chinese, and 34.1% Indian participants. Both treatment and placebo groups were similar; there were no statistically significant differences in baseline demographics including gender, race, age, duration of diabetes mellitus, HbA1c level, blood pressure, weight, and body mass index. Safety tests at baseline were similar between two groups and within normal ranges as shown in Table 2. Non-proliferative diabetic retinopathy grading by eye was mild in 62.1%, moderate in 31.0%, and severe in 6.9%. Baseline retinal microhaemorrhages (median 107.8, standard deviation 448.7, p = 0.294) and baseline retinal diabetic macular edema (median 4.7, standard deviation 13.9, p = 0.118) were similar between two groups.
Table 2: Baseline characteristics of 30 patients with type 2 diabetes mellitus. View Table 2
Serum tocopherol was measured for quantitative assessment of vitamin E intake. At baseline, there was statistically significant strong negative correlation between serum tocopherol level and retinal microhaemorrhages (rs = -0.627, p < 0.001) as shown in Table 3. In addition, there was statistically significant medium negative correlation between serum tocopherol level and diabetic macular edema (rs = -0.430, p = 0.046).
Table 3: Correlation between serum tocopherol level and retinal parameters at baseline. View Table 3
Effects of Vitamin E on retinal microhaemorrhages: A total of 58 eyes were analysed for retinal microhaemorrhages, 22 in the treatment group and 36 in the placebo group. There was no significant difference in retinal microhaemorrhages between the treatment group and the placebo group from baseline to week 12 (p > 0.05). There was a statistically significant percentage decrease in retinal microhaemorrhages in the treatment group compared to the placebo group from week 12 to week 36 (p = 0.009). Overall, there was a statistically significant percentage decrease in retinal microhaemorrhages in the treatment group compared to the placebo group from baseline to week 36 (p = 0.027). The results are summarized in Table 4 and Figure 11.
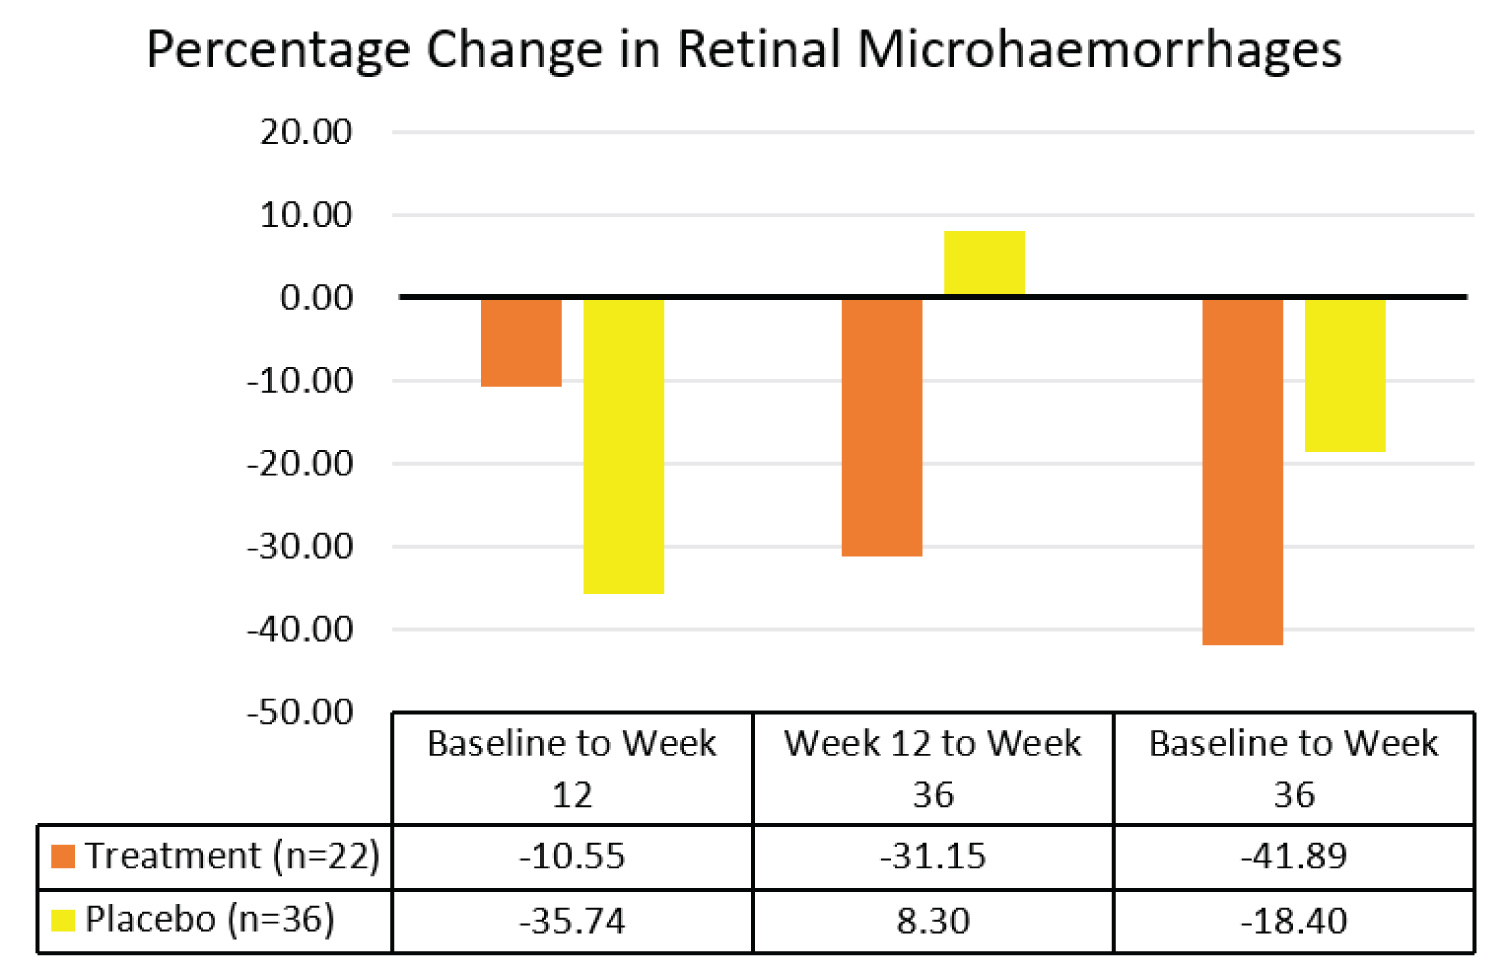 Figure 11: Comparison of median percentage changes in retinal microhaemorrhages between treatment group and placebo group.
View Figure 11
Figure 11: Comparison of median percentage changes in retinal microhaemorrhages between treatment group and placebo group.
View Figure 11
Table 4: Comparison of median percentage changes in retinal microhaemorrhages between treatment group and placebo group. View Table 4
Subgroup analysis was conducted to ascertain the severity of non-proliferative diabetic retinopathy (NPDR) that benefited the most from Tocovid treatment from baseline to week 36. Subgroup analysis revealed a significant percentage decrease in area of retinal microhaemorrhages in both mild and moderate NPDR by 25.8% (p = 0.019) and 59.8% (p = 0.021) respectively as shown in Table 5. Subgroup analysis of severe NPDR was excluded due to small sample size.
Table 5: Subgroup analysis of percentage change in area of retinal microhaemorrhages per area of retina in Treatment group between baseline and week 36. View Table 5
Effects of Vitamin E on diabetic macular edema: A total of 26 eyes were analysed for retinal diabetic macular edema, 14 in the treatment group and 12 in the placebo group. There was no significant difference in retinal diabetic macular edema between the treatment and the placebo groups from baseline to week 12 (p > 0.05), and from week 12 to week 36 (p > 0.05). However, there was a statistically significant percentage decrease in retinal diabetic macular edema in the treatment group compared to the placebo group at week 36 (p = 0.045). The results are summarized in Table 6 and Figure 12.
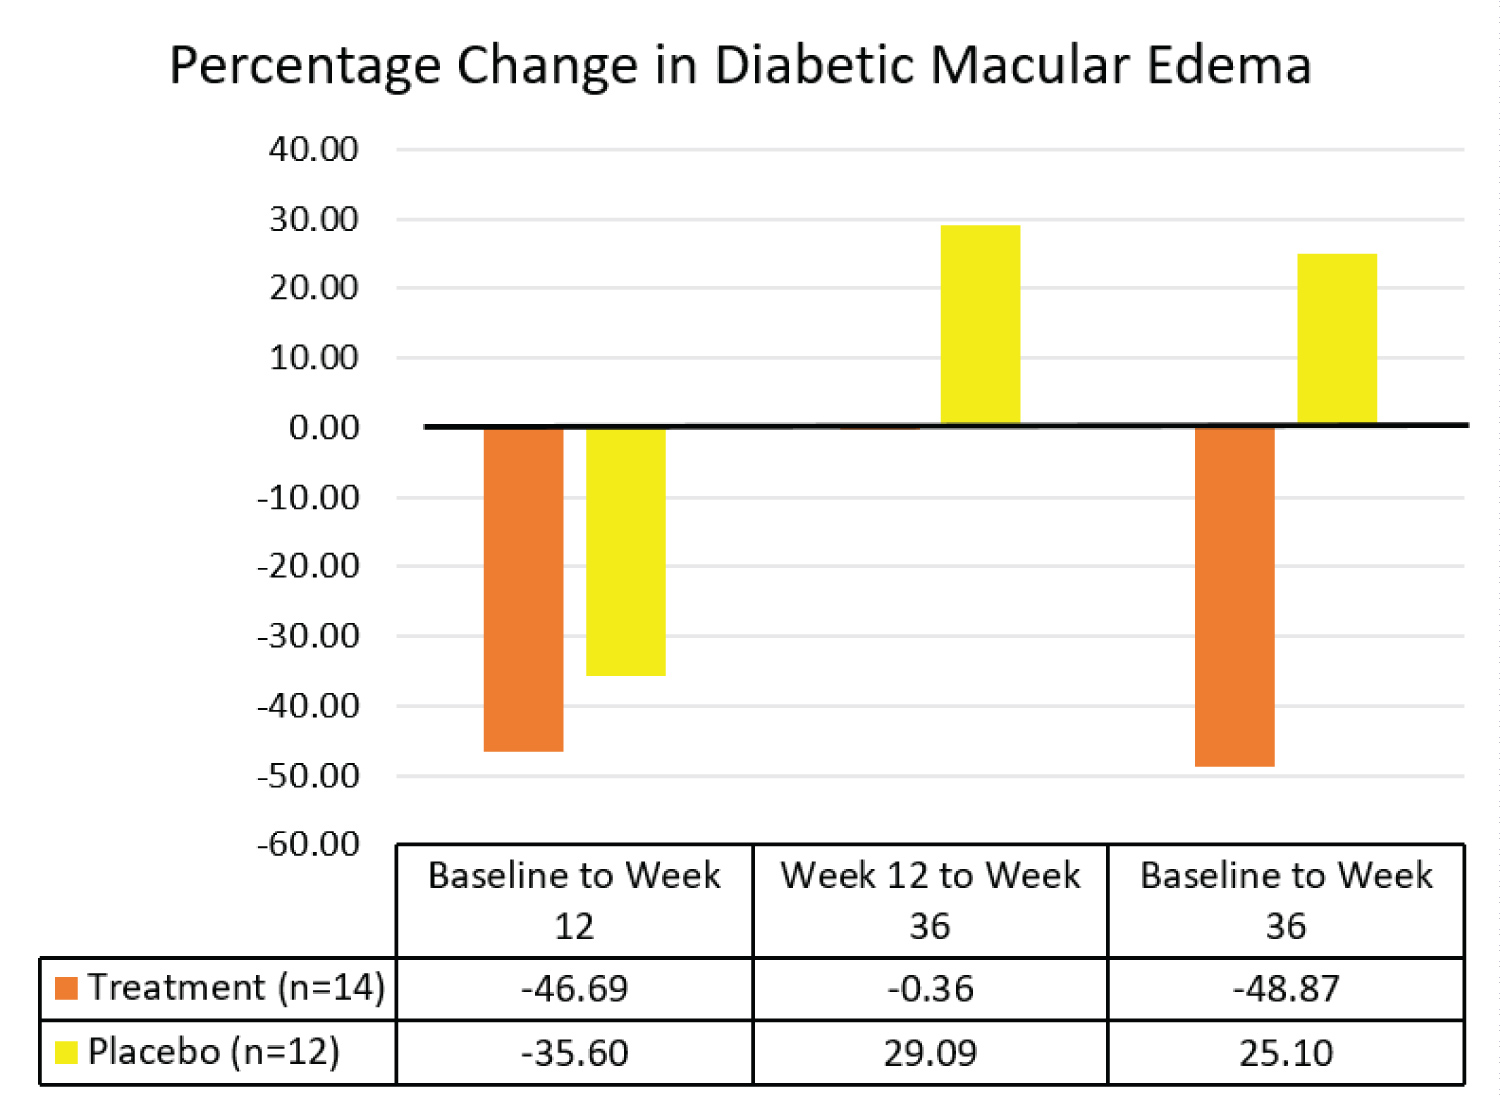 Figure 12: Comparison of median percentage changes in retinal diabetic macular edema between treatment group and placebo group.
View Figure 12
Figure 12: Comparison of median percentage changes in retinal diabetic macular edema between treatment group and placebo group.
View Figure 12
Table 6: Comparison of median percentage changes in retinal diabetic macular edema between treatment group and placebo group. View Table 6
Subgroup analysis revealed a significant percentage decrease in area of DME in moderate NPDR by 33.8% (p = 0.018) when analyzed separately as shown in Table 7. Subgroup analysis of severe NPDR was excluded due to small sample size.
Table 7: Subgroup analysis of percentage change in area of diabetic macular edema per area of retina in Treatment group between baseline and week 36. View Table 7
ANOVA repeated measures analysis was conducted for data collected at baseline, week 12, and week 36 to investigate for possible confounding effects by changes in HbA1c level and blood pressures [10,32]. There was no significant difference in HbA1c level, systolic blood pressure, and diastolic blood pressure within the treatment group and placebo group throughout the trial (p > 0.05) as shown in Table 8.
Table 8: Comparison of HbA1c and blood pressures in treatment group and placebo group between baseline, at three-months treatment, and at six- to nine-months washout. View Table 8
This study showed statistically significant negative association between serum tocopherol level and size of retinal microhaemorrhages (rs = -0.627, p < 0.001) as well as DME (rs = -0.430, p = 0.046) at baseline. This finding is in contrast with the 2010 systematic review on six cross sectional studies that investigated the association between Vitamin E and diabetic retinopathy [29]. Two cross-sectional studies in the systematic review used validated food frequency questionnaires to ascertain Vitamin E level, which is prone to recall bias and measurement errors leading to misclassification of exposure [29]. This study adopted standardized laboratory measurements which produce greater accuracy. Recent consumption of Vitamin E supplements can affect serum or plasma Vitamin E measurements. However, none of the hospital-based studies in the systematic review that measured serum or plasma Vitamin E level accounted for vitamins and minerals intake in analyses [29]. In this study, patients who were taking Vitamin E supplements and other antioxidants were excluded to increase the accuracy of association between serum Vitamin E (tocopherol) level and retinal signs.
Vitamin E has been shown to improve retinal blood flow significantly in patients with diabetes mellitus (p < 0.001) [24]. In this study, the clinical effect of Vitamin E after improving retinal blood flow was assessed through size of retinal microhaemorrhages and DME per area of retina. The methodology for assessing retinal microhaemorrhages and DME used in this study is novel. Our analysis showed high degree of intra-rater and inter-rater reliability in measurements of retinal microhaemorrhages and DME areas using ImageJ software (p < 0.001). The consistency of measurements decreased with larger areas of microhaemorrhages and DME. Therefore, this methodology is more suitable for smaller areas of microhaemorrhages and DME, particularly observed in mild and moderate NPDR.
Airlie House Classification and International Clinical Disease Severity Scale (ICDSS) are two assessment tools frequently adopted to assess diabetic retinopathy progression. Although useful in research settings, the Airlie House Classification is complex and not practical for daily clinical practice. On the other hand, DME was not included in ICDSS although it is independently associated with adverse visual outcomes even in the absence of retinal haemorrhages. Since retinal microaneurysms and microhaemorrhages are validated indicators of diabetic retinopathy progression, measurement of these retinal signs may offer simpler quantitative assessment of retinal condition compared to Modified Airlie House Classification in research settings [15,31]. In addition, this methodology enables detection of minor changes in diabetic retinopathy progression in daily clinical practice that may be unnoticeable when ICDSS is used. Further, this methodology can be used to assess DME which is an independent indicator for diabetic retinopathy progression not included in ICDSS [9,14]. However, the resource intensive nature of this methodology remains a drawback. Recent computer-based studies reported promising results from automated retinal analysis software such as Retmarker DR (Retmarker SA) in measuring retinal microaneurysms, microhaemorrhages, and exudates [33]. With the development of computer software for automated analysis of retinal signs, this methodology may act as a non-invasive, accurate, efficient, and cost-effective alternative to the ICDSS.
To our knowledge, this is the first study that investigated the temporal effects of vitamin E on non-proliferative diabetic retinopathy in type 2 diabetes mellitus. In addition, this study assessed the long term effects of Vitamin E on retinal microhaemorrhages and DME up to 24 weeks after treatment cessation. This study showed statistically significant 41.9% (IQR 60.2) overall decrease in retinal microhaemorrhages in the treatment group compared to 18.4% (IQR 89.0) decrease in the placebo group (p = 0.027). The marked decrease in retinal microhaemorrhages was attributed to Vitamin E since possible confounding factors remained constant, including HbA1c and blood pressure [10,32]. When analyzed separately, retinal microhaemorrhages decreased in both groups during the treatment period. This might be attributed to better control of blood glucose level and blood pressure whilst in the study. However, the possible placebo effect is dampened with time as evidenced by continued improvement of retinal lesions in the treatment group and not in the placebo group. Retinal microhaemorrhages continued to decrease significantly by 31.2% (IQR 79.2) in the treatment group up to 24 weeks after treatment cessation (p = 0.009). In contrast, retinal microhaemorrhages increased slightly by 8.3% (IQR 119.6) in the placebo group.
On the other hand, there was a statistically significant 48.9% (IQR 63.7) overall decrease in DME in the treatment group compared to an increase of 25.1% (IQR 299.3) in the placebo group (p = 0.045). Similarly, an initial decrease in DME in both groups may be attributed to better control of blood glucose level and blood pressure whilst in the study. After treatment cessation, DME in the placebo group increased. In contrast, the progression of DME in the treatment group was inhibited. The pronounced overall decrease in DME in the treatment group was attributed to Vitamin E as HbA1c and blood pressure remained constant.
Subgroup analysis suggests that Tocovid is beneficial for individuals with mild NPDR in reducing the size of retinal microhaemorrhages. The beneficial effects of Tocovid are more pronounced in moderate NPDR, where Tocovid significantly reduced sizes of both retinal microhaemorrhages and DME. The reliability of this finding can be improved through larger sample size in future studies.
Our pilot study is the first to reveal the legacy effect of vitamin E in improving NPDR by decreasing the sizes of retinal microhaemorrhages and DME. Approximately 90% of the body's total vitamin E content is stored in adipose tissues. Vitamin E is released from adipose tissue into the bloodstream over time when diet is depleted of vitamin E [34]. Therefore, the release of vitamin E from adipose tissue after treatment cessation may contribute to further decrease in retinal microhaemorrhages and inhibit the progression of DME in the treatment group, which was not observed in placebo group. Future researches should obtain serum tocopherol levels monthly to confirm the persistent higher levels of Vitamin E in sera of patients treated with Vitamin E.
The delayed treatment effect of Vitamin E in decreasing area of retinal microhaemorrhages and DME may be attributed to the indirect action of Vitamin E in improving these parameters. The pathogenesis of diabetic retinopathy causing retinal microhaemorrhages and DME involves multiple pathways. Diabetes mellitus induces chronic low-grade inflammation and oxidative stress, leading to retinal microthrombosis formation through arachidonic acid-thromboxane pathway [3,22]. Since Vitamin E exhibits anti-oxidant and anti-thrombogenesis properties through this pathway [35], it inhibits retinal microthrombosis formation and prevents vascular damage, thus preventing formation of retinal microhaemorrhages and DME. Following the inhibition of retinal microthrombosis formation, progression of retinal microhaemorrhages and DME is inhibited, while pre-formed retinal microhaemorrhages and DME resolve spontaneously through reabsorption by surrounding cells [36].
One of the main limitations of this study is the small effective sample size following complete case analysis for data missing completely at random. A total of 41 participants were recruited into the study as per sample size calculation. However, only 30 participants attended all post-treatment follow-up visits where 58 retinal photographs were available for analysis. As a result, the statistical power of this study decreased, in addition to reduced accuracy of the results. Investigators strived to remind participants regarding follow-up visit dates through phone calls and to identify the reasons for missing follow-up visits. Vitamin E is reported to exhibit protective effects against diabetic retinopathy progression through anti-oxidant, anti-inflammatory, and anti-thrombotic properties. Participants taking other anti-inflammatory and anti-thrombotic medications should be excluded in future studies to reduce the confounding effects on diabetic retinopathy progression. Further, the primary properties of Vitamin E that contributed to improvement of diabetic retinopathy can be explored in future studies through biomarkers such as serum malondialdehyde (MDA) level, intracellular adhesion molecule-1 (ICAM-1), advanced glycation end-product (AGE), and serum thromboxane B2 (TXB2) [20,25,26,35,37,38].
Nevertheless, this pilot study clearly demonstrated the significant decrease in size of retinal microhaemorrhages and DME following Vitamin E treatment for 12 weeks. Future studies should explore and establish the association of retinal microhaemorrhages and DME sizes with the progression of diabetic retinopathy. The sensitivity and specificity of retinal microhaemorrhages and DME to act as indicators of diabetic retinopathy progression should be investigated. In addition, future studies should investigate the duration of action of Vitamin E on diabetic retinopathy after treatment cessation and ascertain the optimal supplementation frequency and dosage.
In conclusion, low serum tocopherol level is significantly associated with greater size of retinal microhaemorrhages and diabetic macular edema (DME) in non-proliferative diabetic retinopathy. Vitamin E (Tocovid) treatment for 12 weeks significantly decreased retinal microhaemorrhages and DME compared to placebo for up to 24 weeks after treatment cessation. Therefore, Tocovid may be a useful adjunct to current treatment and prevention strategies for non-proliferative diabetic retinopathy.
Conceptualization, U.D.P., B.A., and K.A.K.; retinal assessment methodology initially developed, Y.C.; retinal assessment methodology-modification, E.Y.N.; Vitamin E measurement methodology, S.C.W.P., U.D.P., and K.A.K.; formal analysis, E.Y.N.; investigation, E.Y.N., Y.C., S.C.W.P., G.C.J.T., Y.T.N., U.D.P, B.A., and K.A.K.; writing-original draft preparation, E.Y.N.; writing – review and editing, Y.C., S.C.W.P., G.C.J.T., Y.T.N., U.D.P, B.A., and K.A.K., supervision, B.A. and K.A.K.; project administration, K.A.K.; funding acquisition, B.A.
This research was funded by Monash University Malaysia under the Tropical Medicine and Biology (TMB) grant (Grant number: TMB-2018-CR3185140918-SuzTMQ/KAK) and Fundamental Research Grant Scheme (Grant number: FRGS/1/2018/SKK02/MUSM/02/1).
We would like to extend our gratitude to ExcelVite, Malaysia for the supply of Tocovid Suprabio. We thank the research staff at Monash University Clinical Research Centres in Kuala Lumpur and Johor Bahru for their technical assistance: Noras'kin Mohamad, Ungku Zulaikha, Savithri Gopal, Chui Chor Sin, and Pang Pei Ling.
The authors declare no conflict of interest. The sponsors had no role in the design of the study; in the collection, analyses, or interpretation of data; in the writing of the manuscript, or in the decision to publish the results.