The prevalence of Type 2 diabetes mellitus (T2DM) continues to climb in many parts of the globe in association with the rise in Obesity.
In parallel to the increase in the prevalence of diabetes mellitus, evidence indicates a high prevalence of vitamin D deficiency Worldwide. Areas with high prevalence of vitamin D insufficiency and deficiency have been associated with a higher prevalence of diabetes. The reported prevalence of vitamin D deficiency among subjects with Type 2 diabetes mellitus ranges from 63.5% to 91.1%.
Most studies on vitamin D status among Diabetes mellitus subjects involved Caucasians. Data on this subject matter is scarce in Africa.
This study was conducted between the months of May and August (Rainy/winter season) at the Diabetes clinic of the Lagos University Teaching Hospital, LUTH, Lagos, Nigeria. It was an analytical cross-sectional study. A total of 114 eligible type 2 diabetes mellitus participants and 60 healthy controls participated. All participants were clinically assessed and blood samples for relevant investigations taken. Serum vitamin D level was analyzed using the High Performance Liquid Chromatography (HPLC) method.
The mean age was 52 ± 7.6 years in the T2DM group and 50 ± 8.4 in the control group, (p = 0.9).
The female to male ratio in both T2DM and healthy control subjects was 1.5:1.
Majority of the study subjects had vitamin D deficiency with prevalence of 72 (63.2%) in T2DM subjects and 32 (53.3%) in the controls (p = NS). There was no significant difference in the distribution of Vitamin D3 deficiency status by age or sex in both T2DM and Control groups.
The mean serum vitamin D level in T2DM subjects with vitamin D deficiency was 9.2 ± 1.1 ng/dl and 21.5 ± 0.7 ng/dl in the sufficient group (t = 11.9, p = 0.0001). The mean HbA1c and Fasting plasma glucose were higher in the vitamin D deficient group compared to the sufficient group (7.5 ± 1.9% and 148 ± 60.9 mg/dl vs. 6.8 ± 1.6% and 134 ± 43.5 mg/dl respectively, p NS). The proportion of subjects with good glycaemic control (HbA1C f 7.0%) was significantly higher in the vitamin D sufficient group 19 (73.1%) compared to the vitamin D deficient group, 33 (45.8%), Z = -2.39, p = 0.01).
Vitamin D deficiency is common among the participants in this study. This alludes to the widespread vitamin D deficiency and insufficiency in both apparently healthy populations and patients with various pathologies including diabetes mellitus. The season of study (rainy/winter) may have contributed to the low levels of vitamin D among the participants.
Vitamin D deficiency, Type 2 diabetes, Serum calcium
The prevalence of Type 2 diabetes mellitus (T2DM) continues to climb in many parts of the globe in association with the rise in Obesity [1]. Currently, there are 415 million people worldwide living with diabetes and 90-95% have T2DM. This number is expected to reach 642 million by 2040 [2]. Available data have shown that Nigeria presents with the largest number of persons with diabetes mellitus in Africa and report indicates that the prevalence of Type 2 DM in Nigeria is about 4-5% [3].
A novel association with diabetes mellitus that has received considerable attention recently is Vitamin D deficiency. Vitamin D deficiency is usually caused by low dietary vitamin D intake and reduced cutaneous production of vitamin D. The latter condition is associated with reduced sunlight exposure due to geographic location, genetic background affecting skin colour, age, and cultural or religious practices [1].
In the skin, 7-dehydrocholesterol, a derivative of cholesterol is photolysed by ultraviolet light at wavelengths between 270 and 300 nm, with peak synthesis occurring between 295 and 297 nm [4]. The products are pre-vitamin D3 (preD3), lumisterol and tachysterol. At room temperature, the transformation of pre-vitamin D3 to vitamin D3 takes about 12 days to complete [5].
Melanin in the epidermis, by absorbing UV irradiation, can reduce the effectiveness of sunlight in producing D3 in the skin. Persons with darker skin tones, such as Africans and south Asians, exhibit lower serum concentrations of vitamin D, due to reduced skin absorption of ultraviolet B light by darker skin pigments [6-8].
The seasonal variation of vitamin D levels can be quite pronounced with higher levels during the summer months and lower levels during the winter. The extent of this seasonal variation depends on the latitude, and thus the intensity of sun light striking the exposed skin [7]. Serum vitamin D levels are frequently lower during winter months due to reduced exposure to sun light, this may be one important reason for the lower serum vitamin D levels, in Blacks and Hispanics living in temperate latitudes [6].
Consistent with the hypothesis that vitamin D deficiency and diabetes are related, areas with high prevalence of vitamin D insufficiency and deficiency have been associated with a higher prevalence of diabetes [5]. The reported prevalence of vitamin D deficiency among subjects with Type 2 diabetes mellitus ranges from 63.5% to 91.1% [6,7].
Hypovitaminosis D has recently emerged as one of the factors contributing to the development of both type 1 and type 2 diabetes mellitus [9-15].
The effect of vitamin D on B-cell function and insulin sensitivity has been observed in both animal and human studies [8]. Vitamin D is required for and improves the production of insulin; and also improves insulin sensitivity [16]. Vitamin D facilitates the biosynthetic capacity of B-cell and also accelerates the conversion of pro insulin to insulin [17].
Most published work on vitamin D status in Nigeria/sub-Saharan Africa was done among children aged between 6 months and 8 years, and a few on healthy pregnant and non-pregnant women [18-21].
Glew, et al. in his work on vitamin D status in adult Fulani men and women (non-diabetes mellitus subjects) in Gombe State Nigeria, reported a high prevalence of hypovitaminosis D in both men and women with values of 45% and 83% respectively [20].
In Nigeria, there are no available data on the vitamin D status of diabetes mellitus subjects. This study aims to evaluate the serum vitamin D status of T2DM subjects in Lagos. The primary objective (outcome) is to determine and compare the prevalence of vitamin D deficiency in T2DM and control subjects. While the secondary objective is to compare glycemic control (HbA1c) in vitamin D sufficient and deficient T2DM subjects.
This study was conducted between the months of May and October (Rainy/winter season) at the Diabetes clinic of the Lagos University Teaching Hospital, LUTH, Lagos, Nigeria. It was an analytical cross-sectional study. Eligible type 2 diabetes mellitus participants were selected from the LUTH diabetes Clinic register, and invited to the Endocrinology laboratory of Medicine Department. Healthy control participants who volunteered and met the inclusion criteria were selected among LUTH staff members and the General Out-Patient Department, GOPD, and given appointment to participate. Participants were instructed to report between 08:00 a.m and 10:00 a.m (after an overnight fast of 8 to 12 hours) on the appointment date. All participants were clinically assessed and blood samples for relevant investigations taken.
The study participants were recruited into the study after signing the informed consent form indicating free willingness to participate in the study. The study was done at no financial cost to the study participants. Approval for the study was obtained from the Health and Ethics Committee of LUTH. Participants were free to withdraw from the study at any stage if they so wished. No participant was to be penalized in any way for deciding to opt out of the study.
The following groups of persons were eligible for recruitment into the study:
A) Type 2 diabetes mellitus participants
• Participants aged 35 to 65 years with type 2 diabetes mellitus and on oral antidiabetics
• Participants who gave informed consent
B) Control participants
• Apparently healthy participants aged 35 to 65 years who gave informed consent (matched for age and sex)
Those who were excluded from the study were:
• Participants below 35 years or above 65 years
• Participants with type 1 DM
• Type 2 DM participants on insulin (due to influence of insulin antibodies on serum insulin assay)
• Pregnant women (serum vitamin D levels are generally low in pregnancy)
• Participants with chronic diseases including renal insufficiency (GFR < 30 ml/min), history of chronic liver disease or ALT > 5 times upper reference limit, tuberculosis, diarrheal or malabsorption state.
• Patients on vitamin D supplements or drugs that affect vitamin D metabolism such as corticosteroids.
The sample size was calculated using the Kish and Leslie formula.
Where,
N = desired sample size.
Z = Standard deviation set at 1.96 corresponding to 95% confidence interval.
P = Prevalence of Vitamin D deficiency = 91.1%
q = 1.0 – P
d = degree of accuracy required set at 0.05 (5%)
Control Participants: The ratio of the controls to T2DM participants was 1:2. Hence the estimated number of control participants was 56.
The total calculated sample size was 168 (112 T2DM and 56 control participants). To allow for a dropout rate of about 10%, 184 subjects were estimated to be recruited for this study (T2DM participants = 122; and controls = 62).
In a fasting state, between 08.00 a.m. and 10.00 a.m., 10 ml of venous blood was collected from the antecubital fossa of each subject. Tourniquet was lightly applied about 2 to 4 cm above puncture site and left for less than 2 minutes. The blood sample collected was shared into appropriate sample bottles for the relevant tests as stated below.
Three milliliters of blood sample were collected into plain bottles. The samples were left for 15 to 20 minutes to clot at room temperature and then centrifuged at a speed of 3000 r.p.m for 10 minutes to obtain the serum which was stored at -80 °C (in ultralow freezer) until when used.
The Agilent series 1120 HPLC system with quaternary pump was employed for the assay. Prior deproteinization of the serum was done by liquid phase extraction using acetonitrile. The extracted sample was transferred to an auto sample vial and 20 μL injected into the HPLC system. Separation was performed on a Zorbax eclipe XDB-C8 column (4.6 × 150 mm, 5 μm size) maintained at 40 °C. The mobile phase was methanol/acetonitrile (15:85) and the flow rate was 1 ml/min. Detection was at 280 nm, the injection volume was 20 μL. The vitamin D3 peaks were resolved with retention time of 4.6 to 4.8 mins.
Figure 1 shows the calibration curve for the determination of serum Vitamin D3. Samples were run in duplicates and the mean absorbance plotted against concentrations of vitamin D3. The calibration curve was linear in the range of serum vitamin D3 concentrations (10-80 ng/ml) of interest. Using this curve the vitamin D3 concentrations of patients were obtained by interpolation.
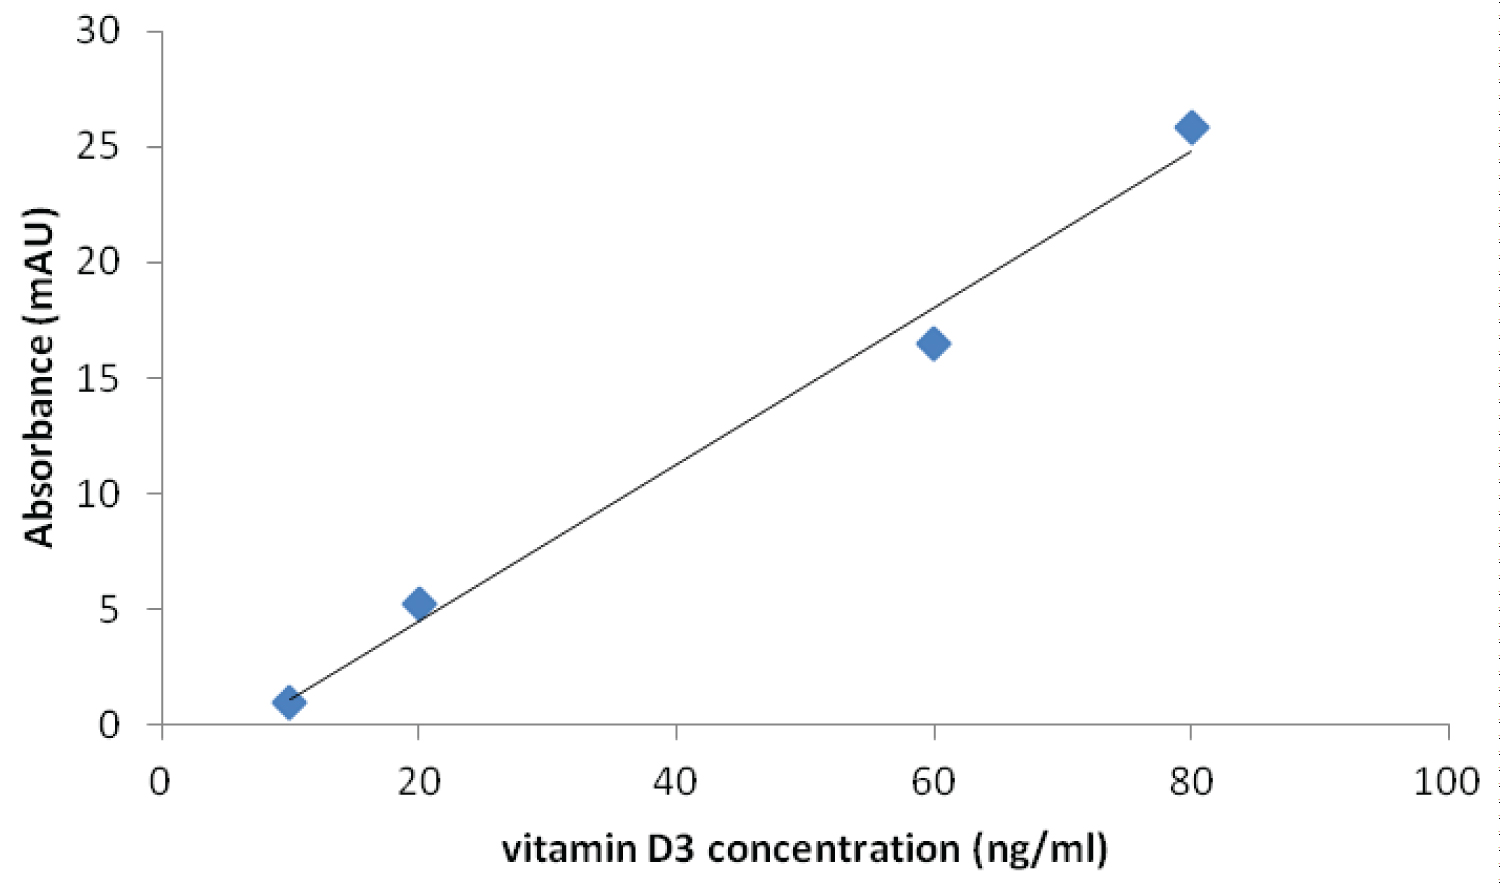 Figure 1: Calibration Curve for the Determination of vitamin D in Serum by HPLC Method.
View Figure 1
Figure 1: Calibration Curve for the Determination of vitamin D in Serum by HPLC Method.
View Figure 1
Various concentration of vitamin D3 (10, 60 and 80 ng/ml) were added to three different aliquots of same serum. Each sample concentration was injected and run three times and the average taken. The serum used for the process had undetectable vitamin D3 level; hence the baseline vitamin D3 level was assumed as zero. The recovery study showed that the method employed was efficient and accurate in recovering the fat soluble vitamin D3 from serum samples; the recovery rate ranged from 91.3 to 116.7%, with a mean of 104.4 ± 12.7%.
About 2 ml of blood was transferred into fluoride oxalate bottles. The sample was then centrifuged at a speed of 3000 r.p.m for 10 min. The plasma was separated and stored at -20 °C until the time for analysis. The Trinder (Glucose-oxidase) method was employed [22]. The process involved the addition of 2 ml of plasma into about 2 ml of a glucose oxidase containing solution in a test-tube. The mixture was incubated at room temperature for 15 minutes; it was then allowed to cool to room temperature during which time the colour changes from colourless to pink depending on glucose concentration. The absorbance was read in a spectrophotometer and the reading is compared with that of a standard glucose solution with a known glucose concentration which had been incubated with the glucose oxidase solution.
About 1 ml of blood was transferred into potassium EDTA bottles. The blood sample was stored at a temperature of between 2 °C and 8 °C, for not longer than four days. Analysis was done via the Boronate affinity chromatography technique, using the Bio-rad in2it automated Glycohemoglobin analyzer [23].
In this analytical technique, a boronate such as phenylboronic acid is bonded to the surface of the column support. When a solution of proteins (e.g. hemolysate) is passed through the column, the glycated component is retained by the complexing of its diol groups with the boronate. After the unretained non-glycated component elutes from the column and passes through the spectrophotometric detector, where it is detected at wavelength of 413 ± 2 nm, the glycated component is eluted from the column with a reagent that displaces it from the boronate and then passes through the detector.
Data pertinent to the study were collated by means of study data forms. These data were entered directly into prepared data forms, and double checked for errors. They were later entered into spreadsheet for cleaning and storage.
Statistical analysis was done using the Statistical Package for Social Sciences, SPSS version 17. Data distribution (normality) was investigated using the D' Agostino-Pearson Omnibus normality test for appropriate statistical analysis. Summary description of data was listed as mean, median, standard deviations, confidence intervals, proportions and tables.
Data on serum vitamin D3 levels were not normally distributed; hence the reference values were derived from the anti-log of the log transformed data. Comparisons of the clinical, anthropometric and biochemical variables were analysed using student's T-test.
Comparisons of categorical variables were analysed using Chi-square test. P-values less than 0.05 were considered statistically significant.
A total of 194 participants (124 type 2 diabetes mellitus and 70 healthy control subjects) were invited to participate in this study. Of the 70 control participants, 10 did not meet the inclusion criteria (four had hypertension, three had elevated fasting glucose in the diabetic range, one was on treatment for pulmonary tuberculosis and two were pregnant). Out of the 124 T2DM patients invited, 10 were excluded (8 did not meet inclusion criteria while 2 declined).
The mean age was 52 ± 7.6 years in the T2DM group and 50 ± 8.4 in the control group, (p = 0.9). The female to male ratio in both T2DM and healthy control subjects was 1.5: 1. The mean body mass index, BMI, was 27.2 ± 4.6 and 27.2 ± 5.1 in the T2DM and control groups respectively, (p = 0.76).
Table 1 shows the distribution of participants by vitamin D status. Reference values for serum vitamin D were derived from the 95% confidence interval of anti-log of the transformed control group data. The serum vitamin D levels were then classified as shown in the Table 1. Majority of the study subjects had vitamin D deficiency with prevalence of 72 (63.2%) in T2DM subjects and 32 (53.3%) in the controls. This difference between the groups was not statistically significant (χ2 = 1.62, p = 0.44).
Table 1: Distribution of Study Participants by Serum Vitamin D Status. View Table 1
The distribution of vitamin D deficiency status by age and sex is shown in Table 2.
Table 2: Distribution of vitamin D deficient Participants by Age and Sex. View Table 2
The proportion of T2DM subjects with good glycaemic control (HbA1C ≤ 7.0%) was significantly higher in the vitamin D sufficient group 19 (73.1%) compared to the vitamin D deficient group, 33 (45.8%), Z = -2.39, p = 0.01. Comparisons of other biochemical variables are as shown in Table 3.
Table 3: Biochemical variables in vitamin D deficient and vitamin D sufficient T2DM subjects. View Table 3
The mean age was 52 ± 7.6 years in the T2DM group and 50 ± 8.4 in the control group, (p = 0.9). The female to male ratio in both T2DM and healthy control subjects was 3:2.
Majority of the study subjects had vitamin D deficiency with prevalence of 72 (63.2%) in T2DM subjects and 32 (53.3%) in the controls (p = NS). There was no significant difference in the distribution of Vitamin D3 deficiency status by age or sex in both T2DM and Control groups.
Majority of the study participants, 100 (90.4%) of T2DM patients and 59 (98.3%) of the healthy controls had normal serum calcium level (2.1 to 2.55 mmol/L). Asymptomatic hypocalcaemia (serum calcium < 2.1 mmol/l) was seen in 11 (9.6%) of T2DM patients and none in the control group. Mean corrected serum calcium level was significantly lower in T2DM subjects compared to controls (2.23 ± 0.09 mmol/l vs. 2.28 ± 0.09 mmol/l respectively, p-0.003).
The mean serum vitamin D level in T2DM subjects with vitamin D deficiency was 9.2 ± 1.1 ng/dl and 21.5 ± 0.7 ng/dl in the sufficient group (t = 11.9, p = 0.0001). The mean HbA1c and Fasting plasma glucose were higher in the vitamin D deficient group compared to the sufficient group (7.5 ± 1.9% and 148 ± 60.9 mg/dl vs. 6.8 ± 1.6% and 134 ± 43.5 mg/dl respectively, p NS).
The findings from this study, to a large extent corroborated with previous work in this field. The prevalence of vitamin D deficiency in this study is 63.2% and 53.3% in T2DM and controls respectively. This alludes to the widespread vitamin D deficiency and insufficiency in both apparently healthy populations and patients with various pathologies including diabetes mellitus [24]. The reported prevalence of vitamin D deficiency among persons with Type 2 diabetes mellitus ranges from 63.5% to 91.1% [6,7]. The reason for this high prevalence of vitamin D deficiency among the study participants is not clear. However, the season (rainy/winter) during which the study was carried out may play a role, as the exposure to sunlight and therefore vitamin D production is expected to be low during the period. There are several reports on seasonal variation of serum vitamin D and glycaemia [25-27]. The higher levels of HbA1c and Fasting plasma glucose in vitamin D deficient T2DM participants compared with their vitamin D sufficient counterpart is consistent with the inverse relationship between vitamin D levels and glycaemic control reported in other similar studies [12,28-30].
The finding of a lower mean serum calcium concentration in persons with T2DM compared to healthy control is consistent with those of other studies and may be due to the reported elevated urinary excretion of calcium in T2DM [31]. The finding of a predominantly normal calcium levels among the study participants vis-a-vis the extent of vitamin D deficiency status is as reported by Sedrani who found vitamin D deficiency in about 50% of his study participants and all had a normal serum calcium level [32]. The reason for this is not clear, but it may have something to do with the threshold for vitamin D level below which derangement of serum calcium may occur. The serum vitamin D levels observed in this study, though low, may be enough to maintain calcium levels within normal range, coupled with intake of calcium containing supplements or milk among the participants.
Vitamin D deficiency is common among the participants in this study. This alludes to the widespread vitamin D deficiency and insufficiency in both apparently healthy populations and patients with various pathologies including diabetes mellitus. The season of study (rainy/winter season) may have contributed to the low levels of vitamin D among the participants.