To compare oxidative stress, mitochondrial oxidative phosphorylation capacity, microvascular function, and exercise performance of type II diabetics (T2D) to that of control subjects and to determine whether Co-enzyme Q10 (CoQ10) supplementation has any effects on these measures.
Fourteen older adults (7 T2D patients with mild peripheral arterial disease (PAD) (69.9 ± 5.1 years) and 7 age-matched controls (67.0 ± 8.9 years) participated in the study. Each participant went through 2 week placebo followed by 2 week CoQ10 supplementation trials. During each trial, participants performed plantar flexion exercise during which gastrocnemius phosphocreatine (PCr), pH, oxygen (O2) saturation and BFindex were measured using 31P magnetic resonance spectroscopy (MRS) and near infrared spectroscopy (NIRS).
Comparing T2D to controls, significant differences were observed in PCrre (22.3 ± 13.4 vs. 49.4 ± 36.6 mM∙kg-1∙min-1) and BFindex (5.3 ± 2.9 vs. 9.7 ± 2.9%∙s-1) (p = 0.03). Moreover, O2 saturation recovery was significantly longer for T2D (70.9 ± 52.1 vs. 31.8 ± 8.4 s; p < 0.01). When comparing placebo trial to CoQ10 trial, significant reduction in Malondialdehyde (MDA), after CoQ10 trial, was observed in controls (1.29 ± 0.41 vs. 0.88 ± 0.35 uM, p < 0.05) but not in T2D (1.31 ± 0.19 vs. 1.47 ± 0.36 uM, p > 0.05). With the CoQ10 trial, a trend of improved PCr/Pi in T2D patients at rest was seen (6.87 ± 1.2 to 8.59 ± 2.7). However, no other significant changes were observed with CoQ10 supplementation for either group, including pH, PCr recovery (T2D: 22.3 ± 13.4 vs. 23.2 ± 11.4 mM∙kg-1∙min-1; CON: 49.4 ± 36.6 vs. 43.7 ± 33.3 mM∙kg-1∙min-1, p = 0.9), and BFindex (T2D: 5.3 ± 2.9 vs. 3.9 ± 2.2%∙s-1; CON: 9.7 ± 2.9 vs. 9.2 ± 2.4%∙s-1, p = 0.5).
Noted reduction in MDA seen in healthy, older individuals suggests a positive antioxidant effect of CoQ10 supplementation. However, when PAD is present, as can be the case of T2D, two weeks of CoQ10 supplementation at 200 mg•day-1 may not be long enough or potent enough to produce similar effects.
CoQ10, Diabetes, Antioxidant, Metabolic function, Hemodynamics, Exercise
∆BV: Blood Volume Change; ABI: Ankle Brachial Index; AOX: Antioxidant; ATP: Adenosine Triphosphate; BFindex: Microvascular blood flow; BMI: Body Mass Index; CoQ10: Coenzyme Q10; ETC: Electron Transport Chain; H+: Proton; Hb/Mb-oxy: Hemoglobin/Myoglobin-O2 Saturation; ipH: Intracellular pH; MDA: Malondialdehyde; NIRS: Near Infrared Spectroscopy; NO: Nitric Oxide; NOS: Nitric Oxide Synthase; MRS: Magnetic Resonance Spectroscopy; PAD: Peripheral Arterial Disease; PCr: Phosphocreatine; PCrre: PCr Resynthesis Rate; RM: Repetition Maximum; ROS: Reactive Oxygen Species; SSI: Steady State Incremental Exercise; T2D: Type 2 Diabetes; T50NIR: Half-time to Recovery; VO: Venous Occlusion
In the United States, 30.3 million people (9.4% of the population) have diabetes, most of whom suffer from type 2 diabetes (T2D) [1]. Hyperglycemia in T2D may alter glucose metabolic pathways leading to formation of unfavorable by-products such as reactive oxygen species (ROS) [2]. Elevated ROS and its subsequent oxidative stress, due to hyperglycemia in T2D, have been proposed as a major contributing factor leading to diabetic complications [3-5] including vascular dysfunction [6-8]. Peripheral Arterial Disease (PAD) is a common finding in T2D [9] in which blood flow and subsequent O2 supply to working muscles are impaired thereby limiting functional capacity [10,11]. Moreover, T2D associated with PAD, has been shown to increase mortality rate in this population [12].
Another factor contributing to impaired functional capacity in T2D is mitochondrial dysfunction. Studies have reported decreased oxidative phosphorylation activity [13,14], as well as mitochondrial DNA damage [15], in T2D. Moreover, defects in the capacity to metabolize glucose and fatty acids results in accumulation of fatty acids and triacylglycerol in non-adipose tissues, including skeletal muscle [16]. These accumulating fatty acids are prone to lipid peroxidation increasing ROS, a process thought to be one of the major causes of mitochondrial damage [17].
While hyperglycemia in T2D increase ROS production, it can also lead to glycation of antioxidant (AOX) enzymes thereby reducing AOX availability [18,19]. Thus, hyperglycemia upregulates ROS formation while down-regulating AOX formation leading to an even higher level of oxidative stress. For example, mitochondrial reducing equivalents, such as co-enzyme Q10 (CoQ10), have been found to be deficient in T2D [20,21]. This suggests that a quantitative and/or functional deficiency in CoQ10 may potentially occur in T2D, further diminishing metabolic efficiency and functional capacity.
CoQ10 is a potent antioxidant [22,23] and a component of the ETC which has been shown to improve mitochondrial [24,25] and vascular function [26,27]. Furthermore, CoQ10 has shown to reduce fasting plasma glucose in diabetes [23]. Thus, supplemental CoQ10 has the potential to improve functional capacity of T2D and possibly reduce the progression of disease. In the present study, we examined and compared these parameters of T2D patients to that of control subjects and how short-term dietary CoQ10 supplementation may alter these measures. We hypothesized that; 1) T2D patients would exhibit impaired mitochondrial and microvascular functions, and exercise performance when compared to age-matched control subjects and 2) T2D patients would show significant improvements in these measures after CoQ10 supplementation.
Fourteen older individuals were recruited to participate in the study (7 T2D patients with a mild case of PAD (Fontain class IIa) (Age: 69.9 ± 5.1 yrs) and 7 age, gender and activity matched non-diabetic individuals (Age: 67.0 ± 8.9 yrs). All subjects were non-smokers and engaged in no more than one planned physical activity per week. All T2D patients were previously diagnosed with T2D (fasting glucose ≥ 126 mg/dL) and in good glycemic control. The study protocol was approved by the Institutional Review Board at the University of Pennsylvania (IRB#: 803931). Informed consent was obtained from each subject before enrollment of the study.
Prior to the study, each subject's laboratory and physical examination information, including vital signs, height, weight, diet, activity habits, medication, ankle brachial index (ABI), and blood work were obtained. Once enrolled in the study, the same measures and questionnaire were obtained during each visit to monitor and record any changes during the course of the study. All study subjects were encouraged to stay on the same diet, medication, and activity level throughout the study.
This study used a non-randomized, single blinded, cross-over design, where all T2D patients and control subjects received 2 weeks of placebo treatment first, followed by 2 weeks of CoQ10 treatment at 200 mg•day-1 (100 mg capsule, twice a day). The treatment order was not randomized due to a long wash out period of CoQ10. An oral, over-the-counter CoQ10 dietary supplement was used (Swanson Health Products, Inc., Fargo, ND). To account for a possible order effect, an initial baseline trial was conducted before the placebo trial.
Each subject was asked to report three times; 1) Baseline (visit 1); 2) 2 weeks post placebo (visit 2); and 3) 2 weeks post CoQ10 supplement (visit 3). Identical exercise testing was performed during each visit. Blood samples were drawn from the antecubital vein before and after exercise in all trials to measure changes in Malondialdehyde (MDA) level to estimate oxidative stress status.
All exercise protocols were performed in a 2 Tesla, 75 cm bore MRS magnet. Co-registration of 31P-MRS and NIRS (Cogniscope; NIM, Inc.) was performed to observe dynamic changes of phosphate (31P) metabolites, intracellular pH (ipH) and total hemoglobin/myoglobin-O2 saturation (Hb/Mb-oxy) in the medial gastrocnemius at rest, during and after exercise. For exercise protocol, dynamic plantar flexion in supine position was performed, using workloads relative to pre-determined one repetition maximum (RM) (Figure 1). For T2D group, the leg that the patient was having the most pain was used throughout the study.
 Figure 1: Typical changes in blood volume during SSI exercise in a control subject (solid line) and a T2D patient (dotted line).
View Figure 1
Figure 1: Typical changes in blood volume during SSI exercise in a control subject (solid line) and a T2D patient (dotted line).
View Figure 1
12 s Dynamic exercise: After obtaining resting measures, each subject performed a 12-s dynamic plantar flexion exercise (~ 2 contraction/s) at 40% of 1RM. All subjects stopped exercising after 12-s or when medial gastrocnemius muscle PCr level declined to 50% of the resting PCr, whichever came first [28]. From the MRS spectra, post-exercise PCr, ipH, and PCr re-synthesis rate (PCrre) were measured as a function of mitochondrial oxidative phosphorylation capacity. From NIR spectra, Hb/Mb-Oxy during exercise was measured as a function of O2 utilization. Half-time to recovery (T50NIR), which is the time from cessation of exercise to 50% of resting Hb/Mb-oxy, was measured as a function of O2 delivery. Recovery delay was measured from cessation of exercise to the start of Hb/Mb-oxy recovery.
Steady State Incremental Exercise (SSI): Each subject also performed SSI by pushing down the pedal against a set resistance at a rate of 30 plantar flexions/min with a 1-s work/rest cycle (Figure 2). Starting workload was set at 30% of 1 RM and increased by 10% every two minutes. Exercise was stopped when PCr level declined to < 50% of the resting PCr. Exercise capacity was determined by the time it took for each subject to deplete 50% of resting PCr. From NIR spectra, blood volume change (ΔBV) during exercise and initial rate of total Hb change (ΔtHBrate) immediately after exercise were used to determine BFindex. From MRS spectra, post-exercise PCr, ipH, and ipH recovery were measured.
 Figure 2: Typical changes in ipH (circle and triangle; top panel) and Hb/Mb-oxy (solid and dotted lines; bottom panel) after SSI exercise in a control subject (circle and solid line) and a T2D patient (triangle and dotted line).
View Figure 2
Figure 2: Typical changes in ipH (circle and triangle; top panel) and Hb/Mb-oxy (solid and dotted lines; bottom panel) after SSI exercise in a control subject (circle and solid line) and a T2D patient (triangle and dotted line).
View Figure 2
All data were analyzed using a commercially available statistical software tool pack (Sigma Stat). A two-way ANOVA (Analysis of Variance) with placebo vs. CoQ10 trials and T2D vs. control subjects as factors were conducted on all variables. Significance level (α) was set to 0.05. To examine relationships between MRS and NIRS metabolic measures, a pearson product-moment correlation was used.
Resting response: T2D and control subjects' resting variables are summarized in Table 1. There were no significant differences in anthropometric, heart rate (HR) or blood pressure (BP) measures. T2D patients' ABI for both right and left were below 1 (range = 0.61 ~ 0.95) and were significantly lower than the control subjects (p = 0.001). T2D patients' resting 31P spectra revealed significantly smaller PCr (p = 0.04), PCr/Pi (p = 0.01), and larger Pi (p = 0.04) (Table 1).
Table 1: Metabolic and hemodynamic responses at rest, during and after exercise in T2D patients and control subjects. View Table 1
Exercise response: End exercise PCr (p = 0.745), PCr depletion rate at the onset of exercise and end exercise ipH were not significantly different between T2D and control subjects for either 12 s (p = 0.634) or SSI (p = 0.165) exercise (Figure 3). ipH remained above 6.75 (range = 6.85 to 6.96) for all groups during all exercise tests, indicating that exercises were performed under relatively aerobic conditions as designed. 12-s end exercise Hb/Mb-oxy (%) was not significantly different in T2D when compared to control subjects (Table 1 and Figure 3) (p = 0.547). During SSI exercise, T2D reached 50% of resting PCr significantly earlier than control subjects resulting in shorter exercise duration (p = 0.03) (Table 1). A significantly larger increase of ΔBV was observed in control subjects whereas in T2D, after an initial increase, ΔBV either stayed the same or decreased (p = 0.008) (Figure 1).
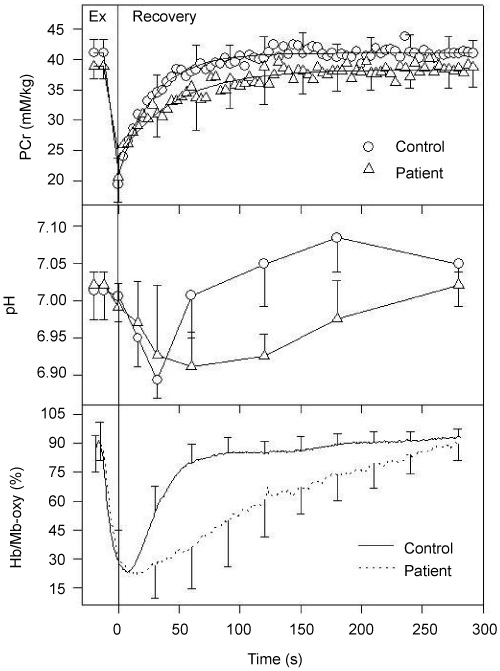 Figure 3: Changes in PCr (top panel), ipH (middle panel) and Hb/Mb-oxy (bottom panel) at rest, during and after 12 s exercise in control subjects (circle and solid line) and T2D patients (triangle and dotted line).
View Figure 3
Figure 3: Changes in PCr (top panel), ipH (middle panel) and Hb/Mb-oxy (bottom panel) at rest, during and after 12 s exercise in control subjects (circle and solid line) and T2D patients (triangle and dotted line).
View Figure 3
Recovery response: PCrre and Tc after 12-s exercise was significantly less in T2D when compared to control subjects (p = 0.02) (Figure 3 and Table 1). When PCrre and Tc were correlated to NIR measures, strong and significant relationships were shown between PCrre and T50NIR (r = -0.46; p = 0.01), PCrre and recovery delay (r = -0.46; p = 0.01), PCrre and ΔBV (r = 0.60; p < 0.001). ipH recovery was also significantly slower in T2D for both 12-s (p = 0.002) and SSI (p = 0.03) exercises (Figure 2 and Figure 3). T50NIR in O2 saturation was significantly slower in T2D when compared to control subjects (p = 0.05) (Figure 2, Figure 3 and Table 1). Moreover, there was a significant delay in HbO2 recovery in T2D (p = 0.02) (Table 1).
Resting response: A significant reduction in MDA, after CoQ10 trial, was observed in control subjects (1.29 ± 0.41 vs. 0.88 ± 0.35 uM, p < 0.05) but not in T2D (1.31 ± 0.19 vs. 1.47 ± 0.36 uM, p > 0.05) (Figure 4). With CoQ10 supplementation, reduced Pi and elevated PCr/Pi were seen in T2D to a point where significant differences seen, prior to CoQ10, between the groups were diminished. However, these changes were not statistically significant (p > 0.05) (Table 2).
Table 2: Metabolic and hemodynamic responses at rest, during and after exercise in T2D patients and control subjects during placebo and CoQ10 conditions. View Table 2
 Figure 4: Changes in MDA (uM) during placebo and CoQ10 trials at pre-exercise (blue bars) and post-exercise (red bars) states in control subjects (left panel) and T2D patients (right panel).
*Significantly different from placebo condition at p < 0.05.
View Figure 4
Exercise response: Similar to resting responses, post exercise MDA was significantly lower, after CoQ10 trial, when compared to placebo trial in controls (1.17 ± 0.28 vs. 1.51 ± 0.17 uM, p < 0.05) but not in T2D (1.64 ± 0.29 vs. 1.56 ± 0.31 uM, p > 0.05) (Figure 4). However, improvements in exercise duration after CoQ10 supplementation was not statistically different for either group (Table 2). Further, PCr changes at the onset of exercise, end exercise ipH, or ΔBV during SSI exercise was not significantly altered for either group with CoQ10.
Recovery response: PCrre, after 12-s exercise, was not significantly different for either group under CoQ10 trial (Table 2 and Figure 5). Slight improvement in ipH recovery was seen in T2D after CoQ10 trial (6.89 vs. 6.92). However, these changes were not statistically significant (p > 0.05). Hb/Mb-oxy during recovery was not significantly different with CoQ10 treatment for either T2D or control group (p = 0.960) (Table 2 and Figure 5). Moreover, no significant CoQ10 treatment effect (p = 0.469) was detected in BFindex for either group.
 Figure 5: Changes in PCr (top panel), ipH (middle panel), Hb/Mb-oxy (bottom panel) during and after 12-s exercise in control subjects (left panels) and T2D patients (right panels) during placebo (circle and solid line) and CoQ10 trials (triangle, dotted line).
View Figure 5
Figure 5: Changes in PCr (top panel), ipH (middle panel), Hb/Mb-oxy (bottom panel) during and after 12-s exercise in control subjects (left panels) and T2D patients (right panels) during placebo (circle and solid line) and CoQ10 trials (triangle, dotted line).
View Figure 5
Resting response: This study found a significantly lower PCr, PCr/Pi and higher Pi in T2D when compared to control subjects. Studies have reported abnormal resting Pi metabolites and/or ratios in different diseases. For example, lower PCr/Pi has been reported in mitochondrial [29] and COPD patients [30], while higher Pi/PCr has been associated with T2D [31,32]. Under the condition of constant pH, PCr/Pi is interpreted as phosphorylation potential, one of the main activators in cellular respiration [33,34]. Thus, lower resting PCr/Pi observed in T2D suggests a state of constant metabolic stress even at rest and a reduced phosphorylation potential. Under ischemic conditions, this reduced phosphorylation potential results not only in over delivered electrons (e-) and subsequent over production of ROS but also accumulation of other metabolites, such as H+, Pi, and ADP, which negatively impact cellular respiration and further stress the mitochondrial respiratory system.
Exercise and recovery responses: One of the research questions in this study was whether T2D patients have impaired skeletal muscle blood flow, mitochondrial function and exercise performance when compared to control subjects. To compare groups, this study used the same relative workloads for all subjects to keep the metabolic rate equivalent. During this state, PCrre was significantly less in T2D suggesting compromised mitochondrial oxidative phosphorylation capacity. Delayed PCrre can occur when mitochondria is not functioning properly. Delayed PCrre can also occur when there is an insufficient O2 supply to the mitochondria as evidenced by a significant relationship between O2 recovery and PCr recovery (p < 0.01) seen in this study. These observations are in agreement with other studies reporting delayed PCr recovery after exercise under ischemic condition [35,36]. Insufficient O2 supply to the mitochondria impairs e- flow in the ETC and, as a result, ATP production is reduced. Furthermore, insufficient O2 delivery while the mitochondria is fully activated during exercise can lead to overflow of e- within the mitochondria increasing redox potential that favors ROS production.
In this study, a reduction in capillary blood flow (as indicated by lower ΔBV and BFindex) was observed in T2D during exercise. This is in agreement with other studies reporting reduced skeletal muscle blood flow in response to exercise in T2D [37,38]. A lower ΔBV and BFindex found in T2D indicates reduced O2 supply to the muscle. When there is insufficient O2 supply, while the demand is high, a mismatch in the O2 flux can occur, impairing mitochondrial oxidative phosphorylation capacity. This phenomenon was clearly demonstrated where PCr recovery was delayed in T2D and it was significantly related to T50NIR and ΔBV.
Intracellular pH response: Exercise capacity of T2D was significantly lower than control subjects where T2D patients reached PCr/Pi of 1 (a state of anaerobic threshold), earlier than control subjects. Moreover, T2D patients' ipH during exercise was lower and recovery was significantly delayed in T2D (Figure 4 and Figure 5). The extent of H+ generation depends on work intensity and ATP hydrolysis via anaerobic glycolysis. Moreover, the amount of H+ present in the cell depends on the ability of H+ efflux. In this study, exercise was stopped at the same metabolic state (anaerobic threshold) for all subjects. Therefore, lower intramuscular pH and delayed pH recovery in T2D reflects the reduced ability of H+ to be released from the cytosol to the extracellular space rather than increased ATP hydrolysis. Impaired blood flow (O2 delivery) observed in T2D appears to be the primary factor for the reduced clearance capacity of H+. It has been suggested that the relationship between exercise-induced PCr/Pi and acidosis is assumed to be a specific parameter for muscle ischemia [39,40]. At similar PCr/Pi, increased acidosis suggests delayed clearance of lactate or H+ due to reduced tissue perfusion as evidenced by reduced ΔBV and BFindex. Furthermore, ipH kinetics can affect PCr recovery. Thus delayed PCr recovery, associated with reduced O2 delivery, can be further delayed by prolonged acidic environment.
Resting response: After CoQ10 trial, a significant reduction in MDA was observed in healthy, older control subjects, suggesting CQ10 may have beneficial antioxidant effects in reducing oxidative stress. This is in agreement with other studies, which have reported a positive antioxidant role of CoQ10 lowering MDA level [23,41-43]. One study reported reduction of MDA with CoQ10 supplementation in children with autism spectrum disorder [42]. Another study reported similar findings in patients with multiple sclerosis [43]. Aging is often associated with elevated oxidative stress [44], causing age related tissue damage. Furthermore, reduced level of CoQ has been shown as a result of the aging process [45], making the older individuals even more prone to oxidative damage. Thus, supplementing with CoQ10 can potentially benefit this population by normalizing CoQ10 and also scavenging ROS, thereby reducing oxidative stress and delaying the aging process.
Interestingly, MDA level was not significantly altered with CoQ10 in T2D patient group. Although studies have suggested the beneficial antioxidant effect of CoQ10, clinical trials involving particularly at high-risk patients, such as T2D, are less remarkable [46]. Lack of significant changes seen in T2D patients in this study may partly be due to the dosage or the duration not potent or long enough for this population, who may have undergone significant cellular modifications with chronic exposure to oxidative stress. For example, damaged mitochondria of type II diabetes can lead to not only deficient in CoQ [20,21] but also over production of e- and subsequent ROS, creating a greater oxidative stress environment than healthy, older control subjects. The given dose or duration of CoQ10 in current study may have not been sufficient enough to scavenge the over delivered e- and/or reduce ROS present within the T2D mitochondria, which may be responsible for the lack of reduction in MDA level seen in this population.
Metabolic response: After the CoQ10 treatment, T2D group's PCr and PCr/Pi were elevated to the values similar to the control subjects. However, these differences were not significant. Normalization of PCr/Pi ratio with CoQ10 has been seen in patients with mitochondrial disease [47] and Friedreich's Ataxia [48] CoQ10 can improve the metabolic status by better handling of the e- within ETC, where CoQ10 can scavenge over delivered e- reducing ROS concentration and also enhancing e- transport as a co-factor to improve ATP production [22,49].
Exercise and recovery responses: Similar to the resting response, a significant reduction in MDA, with CoQ10 supplementation, was observed in control subjects although improvements in functional capacity or other measures were not as obvious. This is contrary to our original hypothesis that CoQ10 would improve functional capacity of T2D patients. Lack of improvements seen in this study may be due to multiple factors. First and foremost, two weeks of CoQ10 supplementation at 200 mg•day-1 may have not been long enough or potent enough for those already having undergone significant modification of vascular tone with chronic exposure to oxidative stress. For the study, a short term but a maximum dose at safe level of 200 mg•day-1 (typical dosage 100 mg•day-1) was chosen to see the acute effect of the supplementation. Although some studies have reported positive effects of CoQ10 supplementation with a similar duration and dosage [50,51], results from CoQ10 studies involving human subjects, particularly patient populations, are rather inconclusive [52]. Solid evidence for the benefit of short-term CoQ10 supplementation on T2D with PAD has yet to be established.
Another possible factor may be due to CoQ10 having a greater effect on the mitochondria than microvasculature. As described earlier, PCrre can be altered significantly by O2 delivery as evidenced by current findings of strong and significant relationships between PCrre and hemodynamic measures. This phenomenon is in agreement with other studies reporting the influence of O2 delivery on mitochondrial phosphorylation capacity. Thus, while some improvements in mitochondrial oxidative phosphorylation capacity may have been present, without sufficient O2 delivery in mitochondria, no discernable improvements in PCrre can be observed.
Small sample size of the patient group as well as the control group decreases the statistical power, which makes it challenging to detect the small changes and draw a generalization of the population.
In conclusion, CoQ10 supplementation exhibited a positive effect in lowering oxidative stress status, shown by reduced MDA, in healthy older individuals. Moreover, CoQ10 supplementation appeared to have marginal effect on mitochondrial oxidative phosphorylation potential of T2D patients at rest without significantly affecting microvascular measures or functional capacity during exercise. Lack of significant microvascular changes after two weeks of CoQ10 supplementation in T2D is most likely the reason for the lack of functional improvement in T2D.
We dedicate this paper to late scientist, Britton Chance, who had been the inspiration and tremendous support for this work. We would also like to thank Ms. Gwen Lech, Dr. Emile R. Mohler III, Allen Bonner, Dr. Luis Melara and Dr. Paul Taylor for their assistance and support.
The authors declare that the research was conducted in the absence of any commercial or financial relationships that could be construed as a potential conflict of interest.
This work was supported by Diabetes Action Research and Education Foundation Grant.
All authors have read the manuscript, assisted in all aspects of the research study as well as the writing of the manuscript, and have agreed to the publication of this manuscript.