The Deese-Roediger-McDermott (DRM) task is a typical experimental paradigm used to induce false memory production. Previous investigations using event-related potentials (ERPs) revealed differences in a late negative component, FN400, in healthy subjects performing the DRM. However, false memory production may be related to the earlier engagement of cortical circuits. So far, there is no study exploring the electrophysiological activation of both early and late neural networks DRM-related in healthy subjects.
We compared the neuronal bases of good and bad performers in healthy subjects performing the DRM. Electroencephalography (EEG) was used to find differences in the event-related potential (ERP) components typical for the DRM, namely the early sensory N1 and P2, and the late FN400 component. Using independent component analysis (ICA), we extracted one functional component time-locked to the P2 component, and with source reconstruction (LAURA) we investigated the underlying sources of the FN400 component.
Compared to good performers, bad performers displayed increased latency of sensory N1 component and significantly lower amplitude of the P2 and the late FN400 components. They showed a lower activity of the P2 generator as revealed by ICA. Using source reconstruction, a different activation inparietal lobules and the left orbitofrontal cortex was also revealed in bad performers in the FN400 time-range.
Altogether, our findings indicate that the performance in distinguishing false and true memories is correlated to an early activation of neuronal network. Such activation patterns suggest a more efficient activation of neuronal circuitry allocated to discrimination ability, selective attention and subsequent familiarity processing as well as more efficient prefrontal and parietal cortices activation.
DRM, False memory, Event-related potentials, Independent component analysis, Brain sources reconstruction
The way our memory is able to encode, store and retrieve past events can be influenced or even impaired by cognitive and biological elements [1]. This is especially relevant in pathological contexts such as schizophrenia where false memories can be associated with symptoms like delusional ideation [1-6]. Theoretical discussions aiming to gain a better understanding of the processes involved in memory distortions have focused on mechanisms relative to true and false memories' production. An efficient experimental model often used to produce false memories and investigate their characteristics is the DRM paradigm (DRM is for Deese-Roediger-McDermott) [7]. In the study phase of the DRM task, subjects learn lists of words (studied items; e.g. table, sit, legs, seat, soft, desk, arm sofa, wood, cushion, rest and stool) which are all semantically related to a target word, e.g. "chair". Later, in a recognition phase the participants are presented a list of words including target words (related "lures"), studied items present in the study list of words or "old" words, unrelated or/and weakly related words ("new" words). Subjects often falsely recognize 60% of the target words as being words of the study list (thus making "false alarms" for target words, also named related lures, e.g. "chair").
There are many different theories regarding mechanisms underlying the production of false memories in the DRM task [8]. One of these is that a sense of familiarity, as "assumed to reflect the assessment of "quantitative" memory strength information" [9] might lead to more "false alarms" than recollection process, which "reflects a threshold retrieval process whereby "qualitative" information about a previous event is retrieved" [9] and might facilitate an efficient recognition memory performance. Moreover, if a subject can correctly retrieve qualitative information (spatial, temporal, modalities,...) about the "conditions under which a memory is acquired" [10], i.e., if he can properly perform an efficient source monitoring, his performance in a recognition task will improve because he can rule out items that only elicit a sense of familiarity and thus lower the "false alarms" rate.
Using electroencephalography (EEG), several studies investigated the neurophysiological correlates of the DRM task [11-14], notably Curran, et al., [13] that focused on the differences between good and poor performers, i.e. subjects showing a good ability to discriminate between lure-yes and old-yes conditions according to an A' index [15]. They identified late frontal event-related potential (ERP) components between 1000 and 1500 ms that are only present in good performers. They also showed differences between good and poor performers in parietal ERP components between 400 and 800 ms, which are related to the recollection, as opposed to familiarity [9]. In the same study, they also analyzed the FN400, a frontal negativity around 400 ms, typically associated with familiarity-based recognition memory [9,13]. Indeed, the frontal response FN400 was shown to be similar in high familiarity conditions (lure-yes and old-yes), but significantly different from low familiarity condition (new-no) [13] although these data were not always replicated due to differences in experimental conditions [14,16]. These first observations suggest that patterns of brain activity specifically related to recollection and familiarity occurs at a late stage in cognitive processing of the stimulus.
Surprisingly, these prior electrophysiological studies have focused on late endogenous ERPs components (ERPs task-dependant and starting around 250 ms after stimulation), whereas the preceding sensory-evoked potentials (N1, P2, N2) remain mainly undiscussed for the most part. To our knowledge, there are no studies using event-related potentials (ERPs) method to characterize ERP components specific to the good and poor performers healthy young adult players in a time range of 150-700 ms.
Previous investigations using ERPs revealed three major components related to cognitive processes in participants performing a memory task. First, the visual N1 component is associated with the discrimination process use of the stimulus, approximatively 75 ms and 125 ms after stimulus onset [17]. Its latency is directly related to the difficulty of stimulus sensory detection and discrimination. This component has been described to be maximal at fronto-central electrode sites. Secondly, the DRM also involved selective attention related to discrimination processes [18-20] and working memory processes [21], reflected by the positive component, the P2, peaking around 200 ms after stimulus onset. This component is localized in the fronto-centrol-parietal electrode sites. Finally, previous studies investigated on changes of the FN400, a mid-frontal negativity around 400 ms associated with familiarity memory processes.
Despite a difference in the late stage of information processing difference between recollection and familiarity reported between good and bad performers during the DRM, their underlying processing differences remain unclear and have not been investigated so far. Therefore, using ERP, independent component analysis (ICA) and supplementary source reconstruction analysis (LAURA), the primary purpose of this study was to compare the neuronal bases of good and bad performers during the DRM. At first we hypothesized to find a decrease of the FN400 amplitude in the bad compared to good performers. Secondly, we assumed to find changes of parameters (i.e. amplitude, latency) in the N1 and P2 component between both conditions, since subjects with memory impairments may present deficits underlying these components.
Participants responded to advertisements posted in public places in the area of Fribourg as well as within the campus of the University of Fribourg. We recruited a group of 20 French-speaking healthy subjects between 18 and 35 years old (mean age 25.50 ± 4.3 SD). Subjects with current psychiatric diagnoses were excluded using the Mini International Neuropsychiatric Interview (MINI) [22]. Isolated past episodes of depressive or anxiety disorders were tolerated. A past or current history of a clinically significant central nervous system disorder have been excluded. Participants were required to sign an informed consent and an information sheet. Each participant was free to withdraw from the study at any time. This project was approved by the Ethical Committee of the University of Fribourg, Switzerland. The protocol was developed according to the Helsinki Declaration.
The Mini International Neuropsychiatric Interview (MINI) [22] which is a structured interview based on the DSM-IV, was used to exclude current minor and major psychiatric disorders on the axis I.
A psychometric battery (Cogstate, see www.cogstate.com for details) including: The Groton Maze Learning Test and Set-Shifting Task for executive functions; Detection Task for psychomotor function; Identification Task for visual attention; Groton Maze Learning Test delayed recall for visual learning and memory; International Shopping List Task and Delayed Recall for verbal memory; One Back Task for working memory; as well as the Social-Emotional Cognition Task for social cognition were administered in the morning by a trained clinical psychologist. An abridged IQ test consisting of two subtests of the Wechsler Adult Intelligence Scale (WAIS) [23] was also administered.
The participants performed a French adapted version of the DRM task [24-29]. Our protocol was similar to the one proposed by [14]. The participants were seated in a sound- and light-attenuated room and were asked to listen to a study list containing 288 words grouped into 24 sets of 12 semantic associates of a non studied theme words. They were asked to memorize the maximum of words from the study list. Next, a recognition list was presented centrally on a 21-inch PC screen which contained 288 words with 96 from each of the following three conditions: lure, old and new. Old words were those that were included in the study list and therefore heard by the participant during the study phase. Lures were semantic associates of studied words although they were not in the study list. We used a version of the DRM with four lures per word list [11,14,30] in order to provide more robust EEG signal analysis. Finally, new words were not studied in the list and were not obvious semantic associates of the studied words.
During the recognition task, the subjects were asked to press a key for words they thought they heard on the study list and another key for words that they thought they had not previously heard. Auditory and visual stimuli presentation, trigger sending and response recording were implemented using the E-Prime software (Psychology Software Tools, Inc., Sharpsburg, PA 15215-2821, USA).
Continuous EEG was recorded using 128 active surface Ag/AgCl electrodes (Active Two MARK II Biosemi EEG System, BioSemi B.V., Amsterdam, Netherlands) mounted on a head cap (Neuro Spec Quick Cap) and referenced to the common mode sense (CMS; active electrode). Supplementary electrodes were placed on the left and right mastoids and on the right, left, supra-, and infra-orbital sites. Electrode impedances were kept below 20 kΩ. Electrophysiological signals were sampled at 2048 Hz (DC amplifiers and software by Biosemi, USA). Markers corresponding to stimuli presentations and responses were used offline to segment the continuous EEG data into time-locked epochs. The continuous EEG was referenced to mastoid channels using the Brain Vision Analyzer 2.0 software (Brain Products GmbH, Munich, Germany). Then, the EEG trials were automatically scanned for contamination by muscular or electrode artifacts (criteria for rejection: voltage step > 70 μV/ms or peak to peak deflection within 200-ms intervals > 200 μV/ms). The remaining trials were inspected visually to control for residual minor artifacts. The epochs were band-pass filtered offline between 1 and 30 Hz (-24 dB). The total analysis window, corresponding to an epoch, lasted for 2000 ms, starting 495 ms before stimulus onset.
ERP analyses were performed by averaging the EEG signal over a window of 1200 ms with a 200 ms pre-stimulus onset period. In order to investigate processes related to recognition memory, we examined the ERP for trials of words separately (old, new, and lure) in each group. ERPs were averaged with a 200 ms baseline epoch prior to stimulus onset.
We measured peak latency of the N1 ERP component as a function of time from stimulus onset. Latency of sensory N1 component was measured at the anterior midline electrode locations (C20, Fz and C22) in the 3 conditions (lure, old and new). The mean amplitude (i.e. area under the curve: AUC) of this ERP component was measured from the pre-stimulus baseline to the maximum peak within a specified window between 80 and 100 ms.
The P2 component was analyzed at the frontal (C20, Fz and C22 combined) and posterior (Pz, A20 and POz) electrode locations where it reached its highest amplitude [19]. The mean amplitude of the P2 (i.e. area under the curve: AUC) was measured from the pre-stimulus baseline to the maximum peak within a specified window between 140 and 160 ms.
We measured the FN400 component at the mid-frontal (C20, Fz and C22) electrode location where its amplitude was maximal, as documented in former studies [9,13,31]. The mean amplitude of this component was measured from the pre-stimulus baseline to the maximum peak within a specified window between 385 and 415 ms.
The automatic amplitude analysis of the three ERP components was completed using visual inspection by a trained neurophysiologist.
ICA is a signal processing technique for blind source separation of linear mixture of evoked electrophysiological data into temporally independent and spatially stationary sources [32,33]. We used the infomax ICA algorithm [34,35] RUNICA, as implemented in EEGLAB with default values (including data sphering). The ICA software, EEGLAB, was provided by the Computational Neuroscience Laboratory of the Salk Institute (San Diego, Calif., USA), and implemented in MATLAB version R2012b (Mathworks, Natick, Mass., USA). The ICA component of interest was superposed on the ERP waveform and those visually matching the ERP in the time period of interest (around the P2 component) were selected.
We estimated electrical sources underlying scalp-recorded data using distributed linear inverse solution based on a local autoregressive average (LAURA) regularization approach [36,37]. The solution space is based on a realistic head model and includes 5010 solution points homogeneously distributed within the grey matter of the average brain of the Montreal Neurological Institute (courtesy of R. Grave-de Peralta Menendez and S. Gonzalez Andino, University Hospital of Geneva, Geneva, Switzerland). Intracranial source estimations were calculated for the time period of FN400 component. In order to obtain those estimates, ERPs for each participant and each experimental condition were first averaged separately across the above-mentioned time periods of interest to generate one time course per component, participant and experimental condition. The distribution of source activities across conditions were then statistically compared for each solution point using the difference in condition means as a test statistic, a non-parametric permutation test with 10,000 permutations, using a significance level of < 0.05 uncorrected.
Two-tailed t-tests and Fisher exact tests were used to compare performances (average percentage of yes responses in lures and old conditions and of no responses in the new condition, A' and B''D values for old/lure), age, sex and laterality between the two groups of subjects.
To normalize the variance of the EEG data distribution (i.e., mean amplitude of ERPs), a ranking transformation was used. The normality of the data distribution was verified with the Shapiro-Francia test. Task conditions (old-yes, lure-yes, new-no) and participant group (Good, Bad) were included as independent variables in a repeated-measure regression model to analyze their respective influence on each of the dependent variables (EEG measures).
The strength of the association between neuropsychological and EEG variables and DRM performance scores were evaluated using Spearman's rank correlation. Statistical analyses were corrected with the Benjamini-Hochberg procedure [38] as appropriate.
Analyses were performed using the Stata software package, version 14.2. We used the Stata regress command with the "vce (cluster)" option that specifies that standard errors allow for intragroup correlations. Observations are thereby independent. The statistical threshold for α was set at p < 0.05.
Analysis were focused on three responses to the DRM, i.e. the target words falsely identified as studied words (lure-yes), the truly recognized studied words (old-yes) and the truly rejected new words (new-no) [13,14]. In order to discriminate good and bad performers, we used the A' measure of discrimination [15], adapted for the DRM task [14,39]. The A' was used to provide an estimate of the ability of the subjects to discriminate between old words and lures. We also computed the B''D value which reflect the liberal or conservative bias in regard to old/lure discrimination [14,15].
Comparison between the performance measures between the two performance groups showed significant differences in proportion of lure-yes (t = 2.25, p = 0.043), old-yes (t = -2.37, p = 0.029), new-no (t = -2.30, p = 0.041) and in the A' old/lureindex (t = -4.42, p = 0.0005) and no differences in bias according to the B''D old/lureindex (t = 0.04, p = 0.692) (Table 1).
Table 1: DRM Performances of participants. View Table 1
There were no significant differences of sex (Fisher exact test statistic value is 1), laterality (Fisher exact test statistic value is 1) or age (t = 1.5298, p = 0.140) between the two groups (Table 2).
Table 2: Characteristics of participants. View Table 2
There were significant differences in Cogstate's scores between good and bad performers. The total number of errors and the number of errors in the delayed recall task of the Groton Maze learning task were significantly lower in good than in bad performers (respectively z = 2.126, p = 0.0335 and z = 3.698, p = 0.0002* with a two-sample Wilcoxon rank-sum) (Table 3).
Table 3: CogState neuropsychological performances for participants (n = 20). View Table 3
There was also a significant inverse correlation between the number of errors in the Groton Maze learning (GML) task and the number of old-yes responses (GML Coeff -0.616, p = 0.004; GMR Coeff -0.53, p = 0.016), where GML corresponds to the total number of errors for all trials, and GMR corresponds to the number of error at delayed recall. In contrast, no correlation between the performance in the Groton Maze learning task and the number of lure-yes responses (GML Coeff 0.109, p = 0.647; GMR Coeff -0.209, p = 0.377) was observed (Table 4).
Table 4: Correlations between neuropsychological scores and DRM conditions. View Table 4
A significant inverse correlation was revealed between the number of lure-yes responses and the number of correct responses in the delayed verbal memory task of the Cogstate battery (Coeff 0.639, p = 0.002*). However, there was no correlation between the number of old-yes responses and the performance in the Cogstate verbal memory task (Coeff -0.189, p = 0.424) (Table 4).
The p-values marked with an asterisks (*) resisted a multiple correction computed according to Benjamini-Hochberg.
Figure 1 shows the grand average waveforms for both groups, all items combined. A classic N1 component was elicited on frontal electrode locations in both groups. Its latency decreased significantly with the level of performance (14.5 ms ± 6.4 ms; t = 2.26, p = 0.036). In contrast, the N1 mean amplitude remained unchanged between the two groups (-28.8 ± 19.1; t = 1.51, p = 0.157). No two-way interaction between factors was observed for these two ERP parameters.
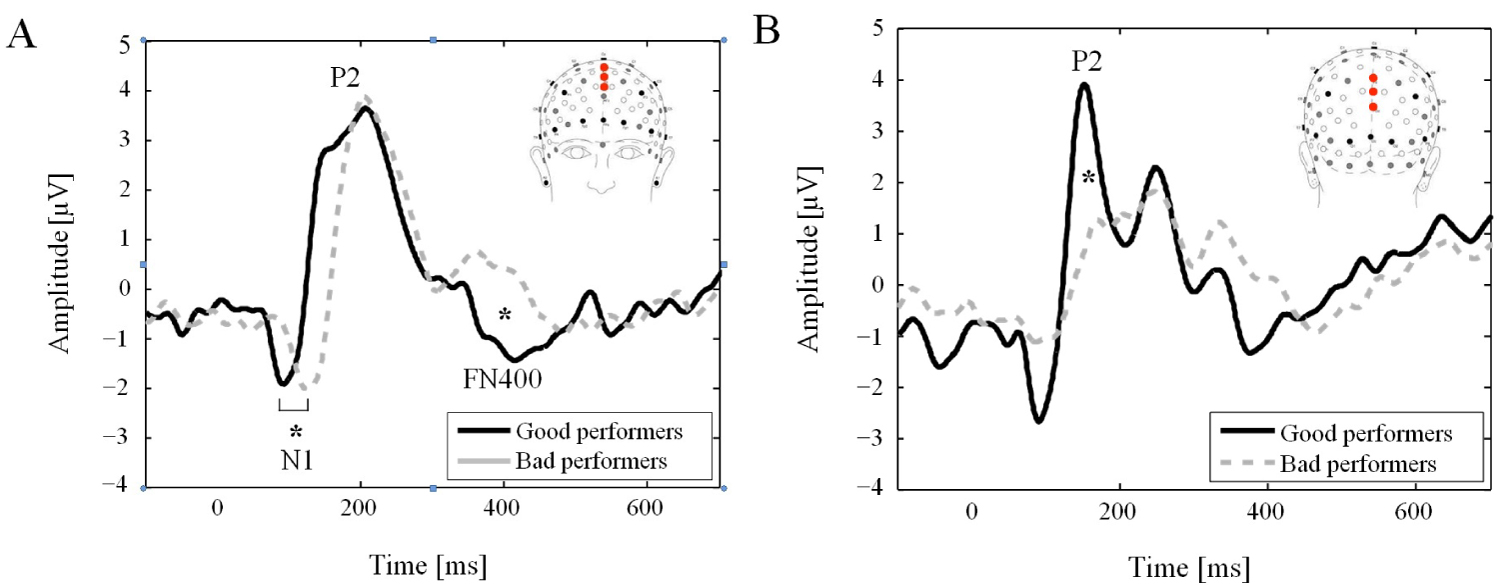 Figure 1: Event-related potentials. Event-related potentials averaged on frontal electrodes (C20, Fz and C22; (A) and parietal (Pz, A20 and POz; (B) electrode locations for Good and Bad performers all conditions (lure, old and new items) combined. The labels show the main components. Note the significant difference for the N1 latency and for the mean amplitude for the P2 and FN400 for the Bad performer.
*p < 0.05. View Figure 1
Figure 1: Event-related potentials. Event-related potentials averaged on frontal electrodes (C20, Fz and C22; (A) and parietal (Pz, A20 and POz; (B) electrode locations for Good and Bad performers all conditions (lure, old and new items) combined. The labels show the main components. Note the significant difference for the N1 latency and for the mean amplitude for the P2 and FN400 for the Bad performer.
*p < 0.05. View Figure 1
A positive P2 component was clearly distinguished in both groups during the 140 ms to 160 ms time interval in posterior electrode locations. Its mean amplitude was significantly higher (-60.9 ± 21.8; t = -2.79, p = 0.014) for good performers as compared to bad performers. No two-way interaction between factors was observed.
The later FN400 component revealed a lower mean amplitude (7.8 ± 2.0, t = 3.90, p = 0.001) for bad performers as compared to good performers. No interactions between group and condition (new-no, old-yes, lure-yes) was observed.
The adjusted p threshold compute according to the Benjamini-Hochberg procedure [38] remained unchanged.
To endorse an underlying component of the P2 ERP, we conducted the ICA. An IC in the time period of the P2 was found in both conditions yet only in good performers was the IC time-locked to the peak of the P2 component at parietal electrode sites. The IC component accounted for 7.7% of the variance in good performers, but only for 0.9% of the variance in bad performers.
The topographic distributions of the ICs are presented in Figure 2 accompagnying the corresponding IC.
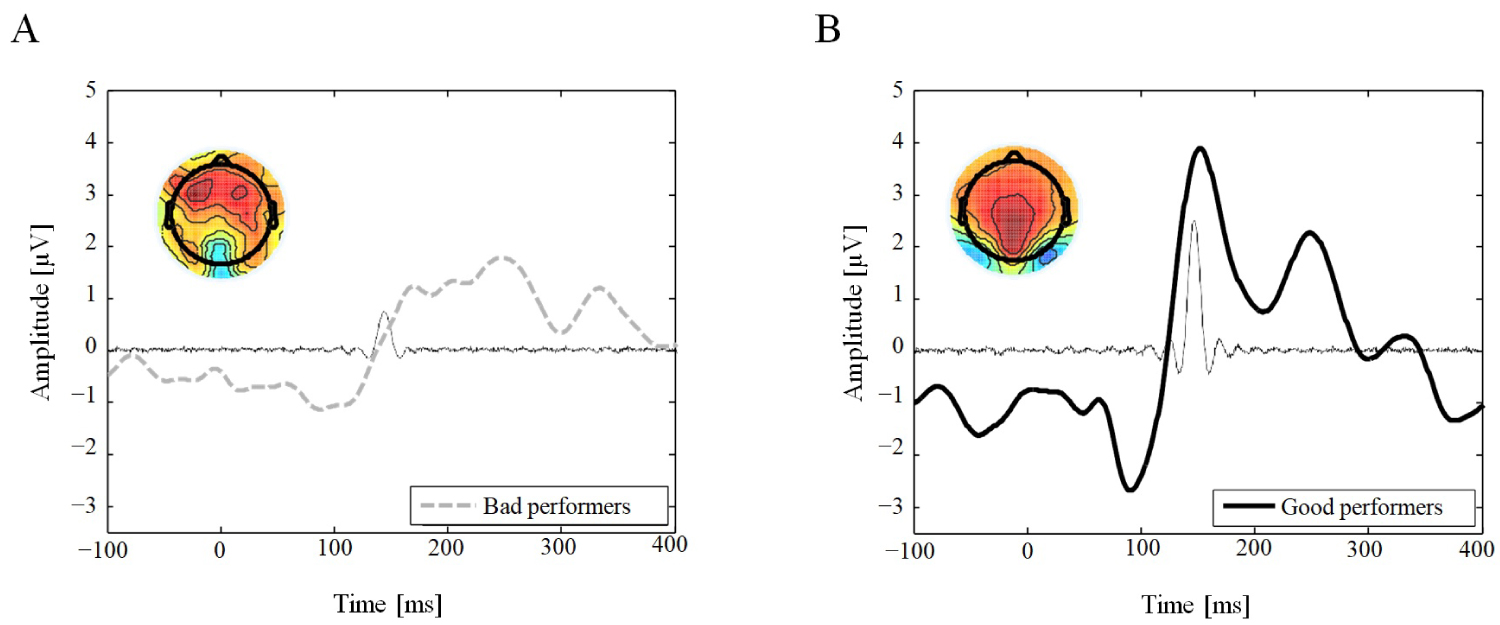 Figure 2: Independent Component Analysis (ICA). Posterior (Pz, A20 and POz electrodes) grand average ERP waveform (thick line) and superimposed time envelopes of the one IC (thin line) predominantly activated for a period of 140-160 ms for Bad (A) and Good (B) performers. (A) The IC component only accounted for 0.9% of the variance in the bad performers; (B) But for 7.7% of the variance in the Good performers. Insert, scalp topography of the IC obtained for each group (A: Bad, B: Good performers).
Note that this IC time-locked to the P2 in both groups. View Figure 2
Figure 2: Independent Component Analysis (ICA). Posterior (Pz, A20 and POz electrodes) grand average ERP waveform (thick line) and superimposed time envelopes of the one IC (thin line) predominantly activated for a period of 140-160 ms for Bad (A) and Good (B) performers. (A) The IC component only accounted for 0.9% of the variance in the bad performers; (B) But for 7.7% of the variance in the Good performers. Insert, scalp topography of the IC obtained for each group (A: Bad, B: Good performers).
Note that this IC time-locked to the P2 in both groups. View Figure 2
We conducted the source localization to identify the differences of inactivity of the underlying brain regions of the FN400 component for both experimental conditions. Figure 3 displays the differences in grand mean source estimations for good and bad performers over the 385-415 ms period. A significant difference between good and bad performers (p < 0.05) was detected in a cluster in the superior parietal lobules on both sides and in the left orbitofrontal cortex (gyrus frontalis inferior).
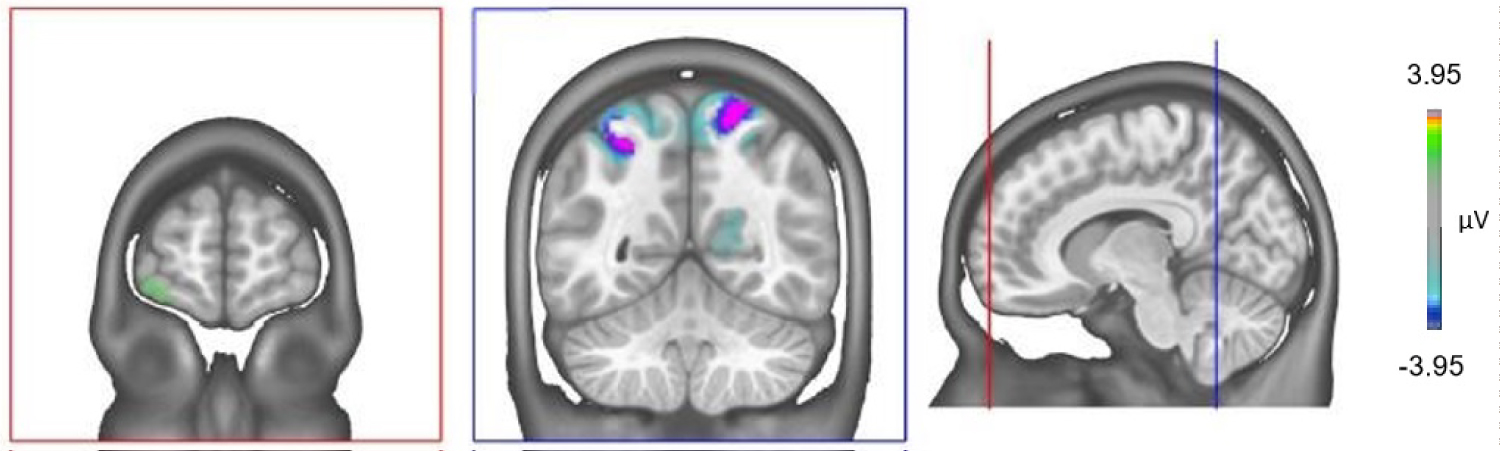 Figure 3: Electrical source imaging localization. Differences between the sources of neuronal activity between Good and Bad performers in the time period of the FN400 component (Bad vs. Good performers). There is a strong hypoactivation in the superior parietal lobules on both sides and hyperactivation of the left orbitofrontal cortex (gyrus frontalis inferior) of the Bad performers over the 385-415 ms period. View Figure 3
We confirmed that good performers show a significant higher visual memory performance but not a better verbal memory performance than bad performers (Table 3). It is therefore possible that when a subject scoring high in visual spatial memory task hears a word, a visual mnesic component of the word is activated and facilitates a later efficient true recognition through a priming effect [40]. This would explain why a good visual memory is associated to a better performance in DRM verbal recognition task visual mnesic component being the words presented on the screen) but not to verbal recall task (as in the verbal memory task in the cogstate). There is in the latter no visual stimulus helping retrieving the studied word. This would explain why there is no correlation between the rate of true recognition in the DRM and the performance in the verbal recall task of the Cogstate. Interestingly, the absolute number of lure-yes answers was inversely correlated with performance in the delayed recall of the verbal memory task and no other tasks of the Cogstate (Table 4). This indicates that a poor performance in a free recall verbal memory task is not specifically associated to a poor performance in a recognition verbal memory task of the DRM, but specific to false memory proneness. Altogether, these findings suggest that performance in the DRM task relies on an intertwined dual memory process involving visual and verbal information processing.
Neurophysiological differences between good and bad performers were already apparent at early stages of information processing. Indeed, good and bad performers showed differences in the morphology of the N1 and P2 components. This suggests difficulties to efficiently recruit neural networks engaged in discrimination process in bad performers. Interestingly, it has been reported that for subjects who were asked to press a button when a predetermined item was presented, the N1 amplitude was greater when the subjects identified the target than in control situation [17]. Although no significant differences were observed on the N1 mean amplitude between the two performances groups in our study, this was not the case for the latency of this component. This finding strongly suggests an earlier recruitment of a neuronal circuitry involved in discrimination processes in good performers. Because of the very early time course of this activation pattern, there should be a better visual discrimination ability between words present in the study list (old) and unheard words (lures and new) during the DRM task. In this context, the precocious occurrence of the N1 component reflects the ability of good performers to activate pertinent perceptual memory elements, which are only later consciously processed to discriminate whether a stimulus is ranked as remembered or not.
In the present study, the disparity in the morphology of the P2 component between performance groups could reflect commitment of different memory processes, like incongruence detection, selective attention and mental workload. Functionally, the P2 is involved in incongruence detection [19] and selective attention [18,20,41,42], supporting the idea that its higher amplitude for good performers (Figure 1) reflects a better ability to detect incongruence between target stimuli (words of the study list, i.e. old) and distracters (lure or new words) in the DRM task, namely a greater ability to overcome the high semantic similarities between these two categories through a more efficient selective attention process.
The present observations should also be interpreted in conjunction with findings regarding the P2 modulation associated with workload changes. It was documented that the morphology of P2 is modulated by mental workload in visual [43] and additive paradigms [21]. According to this theoretical point of view, the lower P2 amplitude in bad performers indicates low workload capacities in this group. Taking this into account, the present data indicate the presence of difficulties to adequately activate specific neuronal circuitry necessary to correctly perform the DRM task. The smaller IC activity in bad performers reinforces this interpretation.
As expected, the amplitude of the FN400 was higher in good performers as compared to bad performers (Figure 1). Interestingly, Curran et al. [13] showed that the FN400 was more negative for the least familiar condition, i.e., the new-no condition. Although the FN400 component also exhibits familiarity related differences in studies using other memory-recognition paradigms than the DRM [16], this FN400 finding related to the DRM experiment could not be replicated in a subsequent experiment [14]. Similarly, we found no significant differences between conditions suggesting a familiarity effect. As mentioned by Curran, et al., there are several possible explanations for this apparent discrepancy. First, in the former study, Curran, et al. used a visual study list [13], which is not the case in his subsequent study [14] and our study where the study list is auditory. Second, the retention interval was longer in our study and this of Curran, et al. [14]. Such long retention time was indeed shown to eliminate the old/new effect in the N400 component [44].
Based on theories regarding mechanisms underlying the production of false memories in the DRM task, the difference on the FN400 amplitude may reflect an exaggerated dependence on familiarity processing in bad performers. This in turn might lead to false recognition of lures as having been heard, just because they are "familiar" [16]. On the other hand, bad performers may base their response on semantic proximity detection [45-47], which could be associated with familiarity processing. Thus, cognitively, the lower FN400 amplitude reflecting an excessive relying on familiarity in bad performers leads to produce more false memories. Interestingly, Yonelinas and colleagues reported that excessive relying on familiarity might participate to false memory production [48], while an efficient source monitoring strategy might help to overcome the familiarity requirement to limit false memory proneness [10,26].
The implication of the activation of the superior parietal regions in the generation of the FN400 is not easy to interpret because those regions are simultaneously involved in true recognition [49] and in familiarity processing regardless of the correctness of the answer [48]. Therefore, the lower activation of the superior parietal regions in the bad performers might be directly associated to a worse true recognition performance as highlighted in our data (old-yes in Table 1) [49]. Simultaneously, a better activation of these regions in good performers might reflect a better ability to overcome recognition processes uniquely based on familiarity [48].
Due to implication of the left prefrontal cortex in monitoring processes [50] and in performance in DRM task [51], the hyperactivity in the left PFC of bad performers suppose an inefficient compensatory hyper activation process associated to an impaired monitoring processing which ultimately leads to poor performances during the DRM paradigm.
In summary, differences in N1 and P2 components morphology seen in good performers underlie a more efficient and early information processing, e.g., selective attention, incongruence detection of mnesic elements (including visual components) during the DRM task. This facilitates later coherent information processing during the FN400 time-range, and it is associated to the ability to overcome possible confusion between items that are apparently familiar and items that are later properly recognized as being remembered. The specific brain regions implicated in these phenomenons include the superior parietal lobes and the left orbitofrontal cortex.
This study has not been submitted elsewhere for publication, in whole or in part, and all the authors listed have approved the manuscript. The authors declare that there are no actual or potential conflicts of interest.
The authors gratefully acknowledge: Colleagues of the Mental Health Network Fribourg (RFSM) for their technical assistance and the recruitment of participants.
We thank Dr. J Lipiec for his support.
We thank Prof T Curran, Prof A Yonelinas and Dr. G Plancher for kindly providing informations about the DRM design used in their experiments.