The hematocrit known as erythrocyte volume fraction (EVF) or packed cell volume (PCV), is the volume percentage of red blood cells in blood. The present report examines the association between hematocrit (HCT) and anyone of seven cardiac parameters such as shock type (SHOCKT), heart rate (HR), mean arterial pressure (MAP), cardiac index (CI), systolic blood pressure (SBP), mean central venous pressure (MCVP), diastolic blood pressure (DBP) for shock patients. It is reported herein that that mean HR is partially positively associated with HCT (P = 0.1002), while mean MAP is partially negatively associated with HCT (P = 0.0988). Variance of MAP is partially positively associated with HCT (P = 0.0703), while variance of CI is negatively associated with HCT (P = 0.0039). On the other hand, mean HCT is negatively associated with shock type (SHOCKT) at level 2 (P = 0.0014) & at level 3 (P = 0.0281). Variance of HCT is partially negatively associated with SBP (P = 0.0947) and HR (P = 0.0718), while it is partially positively associated with CI (P = 0.1049). Note that in epidemiology, partially significant (herein considered around 10% level of significance) effects are known as confounders. It is observed herein that HCT has some effects on HR, MAP, shock type, SBP & CI, but it has no effect on DBP & MCVP for the considered data set.
The HCT is the volume percentage of red blood cells in blood which is normally about 40% for women and 45% for men [1]. Generally, HCT is an integral part of an individual complete blood count results including platelet count, white blood cell count and hemoglobin concentration [1,2]. In epidemiological study, the association between HCT and the incidence of cardiovascular disease (CVD) is inconsistent, as there is a little study about the association of HCT with CVD, or heart failure (HF) [1-6]. Blood viscosity is the thickness and stickiness of blood, which is a direct measure of the ability of blood to flow through the vessels. It may have inverse relationship with blood flow.
It was reported that in the range of 60.16% and 25.32%, a 10.99% increase of hematocrit produced an increase of 1 unit relative viscosity, which means approximately a 20% increase in blood viscosity for a healthy individual [7]. Due to HCT increased, increasing viscosity is a possible cause of changes in blood flow rate, blood pressure, and the equivalent physiologic compensation ratios [6-8]. Most of the earlier conclusions regarding the association between HCT and the incidence of CVD have been drawn based on inappropriate statistical methods such as gender-pooled multivariable Cox proportional hazards models, generalized additive models, nonparametric regression smoothing [1,7,8]. Best of our knowledge, there is a little study regarding the association between HCT and any cardiac parameter based on probabilistic model along with model justification.
The report focuses the effects of HCT on every one of seven cardiac parameters such as shock type, HR, SBP, MAP, DBP, CI and MCVP with the help of a real data set of 113 study units containing 20 study characters [9]. The given data set is a multivariate data, which has been recorded twice (measurements upon admission and just before death or discharge). The association of HCT with any cardiac parameter can be observed in two ways. One way is with the help of probabilistic modeling of HCT on cardiac parameters, and along with other independent variables. Another way is with the help of probabilistic modeling of any cardiac parameter on HCT, and along with other independent variables. Note that six models (fully or partly) of cardiac parameters (for HR, SBP, MAP, DBP, CI and MCVP) have been published [10-14]. Model of HCT for the considered data set [9] is not reported in any previous article, which is reported herein. Based on the above two ways, the report examines the effects and association of HCT with the above stated seven cardiac parameters.
The data set can be noticed in the site: http://www.umass.edu/statdata/statdata/data/shock.txt. The data description, study population, data collection method and covariate description are given in [9]. This is not reproduced herein. The data set contains 113 shock patients along with 20 study characters which are sex (SEX) (male = 0, female = 1), height (HEIGHT), age (AGE), systolic blood pressure (SBP), survival status (SURVIV) (survived = 1, death = 2), diastolic blood pressure (DBP), shock type (SHOCKT) (non-shock = 1, hypovolemic = 2, cardiogenic, or bacterial, or neurogenic or other = 3), heart rate (HR), body surface index (BSI), mean arterial pressure (MAP), appearance time (AT), cardiac index (CI), mean circulation time (MCT), mean central venous pressure (MCVP), urinary output (UO), hematocrit (HCT), hemoglobin (HG), plasma volume index (PVI), red cell index (RCI), card sequence order (initial = 1, final = 2) (CSO).
The seven interested response variables (HCT, HR, SBP, MAP, DBP, CI and MCVP) are all positive, continuous, non-constant variance and non-normally distributed. These are generally modeled by joint generalized linear models (JGLMs) with Log-normal and Gamma distributions [15-17]. Models of the six cardiac parameters (HR, SBP, MAP, DBP, CI and MCVP) have been derived using both the distributions with JGLMs, and they have been reported in [10-14]. Joint mean and variance models for HCT have been derived herein using both the distributions. Detail description of JGLMs has been given in [15-17], which is not reproduced herein. Interested readers may go through [15,16].
The association of HCT with the cardiac parameters can be obtained from its mean & variance models, which are derived in this section using JGLMs, as it was not reported in the earlier articles. Hematocrit (HCT) is considered as the interested response variable, and the rest others are treated as the explanatory variables of HCT. Applying both the joint Log-normal & Gamma models, HCT is analyzed using JGLMs. The smallest value (within in each class) of Akaike information criterion (AIC) selects the final model by minimizing both the predicted additive errors and squared error loss [18]. The analysis results are produced in Table 1. Some partially significant effects such as SBP, HR and CI are incorporated in the variance model for better fitting [18,19]. These partially significant effects (SBP, HR & CI) are termed as confounder in Epidemiology. For HCT analysis, the joint Gamma models fit (AIC = 1181.702) reveals more better fit than Log-normal (AIC = 1189), according to AIC rule.
Table 1: Results for mean and dispersion models of hematocrit from Gamma fit. View Table 1
In practice, the valid conclusions are mainly drawn from the data generated probabilistic model, which is assumed to be true. Therefore, the derived model is to be verified adopting model diagnostic tools. Here model diagnostic graphical analysis is applied for the final selected Gamma fitted models (Table 1), which is displayed in Figure 1. The absolute gamma fitted residuals (Table 1) are plotted with respect to fitted values in Figure 1a, which is approximately a linear except the right tail. The right tail is little decreasing as one small absolute residual is located at the right boundary. The normal probability plot for the Gamma fitted mean model of HCT (Table 1) is displayed in Figure 1b. It does not show any discrepancy in fitting with respect to missing variables or outliers. Therefore, both the figures prove that the fitted Gamma model (Table 1) is approximately a true unknown HCT model.
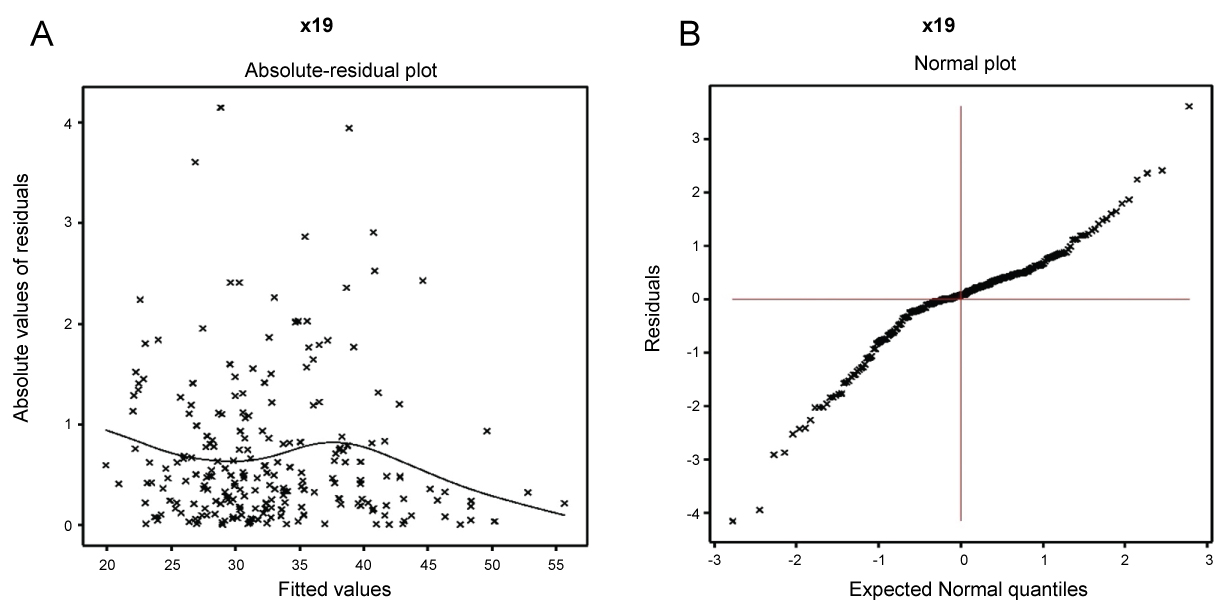 Figure 1: For the joint Gamma fitted models of HCT (Table 1), a) Absolute residuals plot with respect to the fitted values; b) The normal probability plot for the mean model. View Figure 1
The analysis results of HCT for the final selected Gamma model fit are displayed in Table 1, which shows that mean HCT is negatively associated with the cardiac parameter shock type (SHOCKT) at level 2 (P = 0.0014) and at level 3 (P = 0.0281). In addition, it is negatively associated with urinary output (UO) (P = 0.0196), plasma volume index (PVI) (P = 0.0077), and it is positively associated with hemoglobin (HG) (P < 0.0001) (highly significant as t-value is very large). Variance of HCT is partially negatively associated with the cardiac parameters SBP (P = 0.0947), HR (P = 0.0718), while it is partially positively associated with CI (P = 0.1049). In addition, variance of HCT is positively associated with HG (P = 0.0076) & survival status (SURVIV) (P = 0.0004).
Gamma fitted mean () model (Table 2) of HCT is
Table 2: Association of cardiac parameters with hematocrit (HCT). View Table 2
= exp. (2.6877 - 0.0554 SHOCK2 - 0.0348 SHOCK3 - 0.0001 UO - 0.0014 PVI + 0.0811 HG),
and the Gamma fitted variance () model is
= exp. (- 5.525 + 0.922 SURVIV - 0.005 SBP - 0.006 HR + 0.119CI + 0.141 HG).
The mean & variance relationship of HCT are presented in the above by two equations. It is observed that mean HCT is explained by SHOCK2, SHOCK3, UO, PVI and HG, while variance of HCT is explained by SURVIV, SBP, HR, CI and HG.
The association of HCT with the cardiac parameters can be observed from its mean & variance models, which have been derived above (Table 1). The following associations of HCT on cardiac parameters can be concluded from Table 1.
• Mean HCT is negatively associated with SHOCKT at level 2 (P = 0.0014), concluding that as HCT rises, shock status is lower at level 1 than level 2.
• Mean HCT is negatively associated with SHOCKT at level 3 (P = 0.0281), implying that as HCT rises, shock status is lower at levels 1 & 2 than level 3.
• Variance of HCT is partially negatively associated with SBP (P = 0.0947), concluding that as SBP increases, HCT variance decreases.
• Variance of HCT is partially negatively associated with HR (P = 0.0718), interpreting that as HR increases, HCT variance decreases.
• Variance of HCT is partially positively associated with CI (P = 0.1049), indicating that as CI rises, HCT variance increases.
Joint mean and variance models (partly or fully) of DBP, SBP, HR, MAP, MCVP, and CI for the above data set [9] have been derived in [10-14]. From these models, the following interpretations are drawn.
• Mean HR is partially positively associated with HCT (P = 0.1002), interpreting that HR increases as HCT increases [10]. Note that variance of HR has no association with HCT.
• Mean MAP is partially negatively associated with HCT (P = 0.0988), implying that MAP increases as HCT decreases [11].
• Variance of MAP is partially positively associated with HCT (P = 0.0703), implying that MAP variance increases as HCT rises [11].
• Mean CI has no association with HCT, while variance of CI is negatively associated with HCT (P = 0.0039), interpreting that CI variance increases as HCT decreases [12].
• Mean and variance of SBP [13], DBP [13] and MCVP [14] have no association with HCT.
The above associations of HCT with the cardiac parameters have been obtained from the models of the cardiac parameters on HCT, and along with the rest independent variables [10-14]. These above reported associations of HCT are summarized in Table 2.
The effects and associations of HCT with the cardiac parameters have been presented above, and their summarized forms are displayed in Table 1 and Table 2. Note that HCT is highly positively associated with HG (P < 0.0001) (Table 1), indicating that HCT increases as HG increases. In addition HG is a part of HCT. Again, from Table 1, it is noted that mean HCT is negatively associated with PVI (P = 0.0077) and UO (P = 0.0196), indicating that HCT increases as PVI, or UO, or both decreases. So, HCT can be controlled by controlling HG, PVI and UO.
The report has focused the effects of hematocrit on seven cardiac parameters such as shock type, SBP, HR, DBP, MAP, CI and MCVP. The effects of hematocrit have been highlighted herein from the models of six cardiac parameters (SBP, HR, DBP, MAP, CI, MCVP), and also from the joint mean & variance models of HCT. The joint mean & variance models of HCT have been derived in the report (Table 1). The report has shown that HCT is associated with mean HR & MAP (mean models of cardiac parameters HR & MAP), shock type (from mean model of HCT), and it is also associated with the variances of CI & MAP (variance model of cardiac parameters CI & MAP). Also the variance of HCT is associated with SBP, HR & CI (from variance model of HCT). It is shown that HCT is inversely associated with mean MAP & shock type, and directly associated with mean HR. Also HCT is directly associated with the variance of MAP, and it is inversely associated with the variance of CI. Again, variance of HCT is inversely associated with SBP & HR, while it is directly associated with HR. The report has shown that HCT has some effects on HR, MAP, shock type, SBP & CI, but it has no effect on DBP & MCVP for the considered data set.
From the report, it is noted that if HCT is high, HR may increase (partially significant), MAP may decrease (partially significant), incidence of shock may decrease for the cardiac patients who have no-shock, or hypovolemic shock. Again, for high HCT, variance of CI may decrease, while variance of MAP may increase (partially significant). In addition, HCT variance is low, if SBP & HR are high, and CI is low. The report does not show that HCT is a risk factor of mean SBP, DBP, MCVP (hypertension), which is a contradiction to the earlier findings in [7,8].
The results derived herein are only related with the considered data set [9]. For different data, models may be changed (values of the regression coefficients may be different), but the association may be same. It is not examined herein as we have not other data set. Here only seven cardiac parameters (shock type, SBP, HR, DBP, MAP, CI and MCVP) have been considered. There may be many more cardiac parameters such as maximum HR, peak HR, basal HR, maximum BP, basal BP, ejection fraction etc, which are not considered in the report as these factors are not included in the considered data set. The reported results in the article have been little compared with the earlier findings, as there is a little study regarding the association of HCT with cardiac parameters. The article does not focus the biological mechanism of these association of HCT with the cardiac parameters, as the authors are not expert in these areas. All the conclusion are drawn herein based on true probabilistic models. Future researches may focus more cardiac parameters and biological explanations.
Note that HCT is an integral part of an individual complete blood count results including platelet count, white blood cell count and hemoglobin concentration [1,2]. It is better to identify the individual effects of platelet count, white blood cell count and hemoglobin concentration on cardiac parameters. This data set contains hemoglobin concentration, and its effects on cardiac parameters have been presented in [20]. It is noted that high hemoglobin concentration levels have more adverse effects on cardiac parameters than hematocrit [20]. The effects of platelet count & white blood cell count have not been studied as these are not included in the data set. Future researches may consider all these components of HCT, and along with more cardiac parameters. The report has shown some effects of HCT on cardiac parameters which may be useful for medical practitioners. As these cardiac parameters have different associations with HCT, so it should not be very high and very low. Further studies are required to draw more concrete decision.
The authors confirm that this article content has no conflict of interest.
The authors are very much indebted to the referees who have provided valuable comments to improve this paper. This research was supported by the Brain Research Program through the National Research Foundation of Korea (NRF) funded by the Ministry of Science, ICT & Future Planning (2014M3C7A1062896).