Purpose: To investigate the relationship between VO2max and performance in the 1200m shuttle run test in elite Premier League academy football players.
Methods: Seventeen male professional outfield football players completed a laboratory based incremental treadmill test to establish vVO2max and a field based 1200m shuttle test to estimate velocity at MAS. During the pre-season period a linear speed phase consisting of twice weekly PS exposures were conducted and each player’s PS reached during this period was established. Body composition was measured using DEXA.
Results: Examining the standardized (scaled) coefficients, ASR (7.373) had the largest effect on VO2max followed by PS (-5.568), MAS (3.604), Body Fat (-0.285) and Lean Mass (-0.185).The results suggest that the model is a significantly better predictor than a model that constantly predicts the mean VO2max value (F = 3.422, p = 0.041).
Conclusions: The MAS values obtained from the 1200m shuttle test may be an appropriate assessment to consider when monitoring and individualizing high-intensity performance rather than the generic threshold of 5.5 m/s.
English Premier League, Football, Match performance, Individualized, Soccer
Physical performance in football is characterized by its intermittent multi-directional nature, which requires well developed aerobic and anaerobic fitness [1]. Modern players must display high levels of endurance, speed, strength and coordination skills [2]. High levels of aerobic fitness allow players to maintain repetitive high-intensity actions within matches and also improve recovery rate between high-intensity periods [3]. Generally, the dominant metabolic pathway utilized during professional football training and match-play is aerobic, and maximal oxygen uptake (VO 2 max) has been used as a measure of aerobic fitness [4]. Recently VO 2 max has been correlated with key match performance indices [5].
VO 2 max is the body’s ability to maximize the use of oxygen during maximal effort. The most accurate measure of VO 2 max, which is often referred to as the “gold standard” consists of a maximal laboratory treadmill test [6]. Maximal oxygen uptake has been shown to be an important predictor of football performance (Aquino et al., 2020). However, an accurate measurement of VO 2 max is more challenging in the field, therefore the development of an easy to administer practical measurement method is warranted [4].
In football, VO 2 max has been shown to significantly relate to the distance covered in match-play [7,8]. However VO 2 max derived from treadmill testing with gas analysis can be impractical for team sports to administer [9]. Maximal Aerobic Speed (MAS) is the lowest speed at which VO 2 max may occur [10] and has been described as a practical and time efficient method to assess the aerobic energy system in team sport athletes [9]. Time spent above MAS has been shown to correlate with improvements in aerobic fitness in youth athletes [11], however the exact amount of time above MAS and the application to senior professional football players still requires further investigation.
Essentially for a player to meet the demands of the modern game, individualized aerobic and anaerobic capacities must be identified to accurately prescribe training for each player [11]. Thus, the most accurate method to measure aerobic fitness in team sport athletes is required but remains unclear [9]. Numerous field-based tests have been developed that significantly correlate with laboratory-based MAS tests [9], however none have examined the relationship between laboratory-based VO 2 max and the 1200m shuttle test in elite Academy football players.
Therefore, the purpose of this study was to investigate the relationship between VO 2 max and performance in the 1200m shuttle run test in English Premier League (EPL) Academy football players. The findings from this study may have important implications for training prescription and player development.
Seventeen male EPL academy outfield football players with a mean ± standard deviation (SD), at start of 2022-2023 seasons, age 19.6 ± 1.2 years, stature 1.8 ± 0.05m, body mass 75.2 ± 5.6 kg, participated in the present study. The methodology for differentiating specialized positions was adapted from previous research [12]. As various situational factors have an influence on the style of play that can be modulated by different tactical roles [13], context was considered whilst using a player’s average position in an attempt to determine a player’s relevant tactical role in the team [14]. All participants were classified based on their regular playing position at the start of the season and remained consistent throughout the study period. The sample group consisted of defenders n = 7, midfielders n = 6, and forwards n = 4. Goalkeepers data were excluded due to their position-specific demands [15,16]. All data evolved as a result of employment where players were routinely monitored over the course of the competitive season. Nevertheless, club approval for the study was obtained [17] and ethics was approved by the local Ethics Committee of University of Central Lancashire (BAHSS 646 dated 17/04/2019) and in accordance with the Helsinki Declaration. Moreover, written informed consent was obtained from all study participants. Informed written consent was provided by the parents of participants under 18 years of age at the time of data collection. To ensure confidentiality, all data was anonymised prior to analysis.
Body composition (total mass, fat mass, lean mass, percent body fat [%BF] was measured using DEXA with Smart Scan version 4.7e; Lunar Radiation Corporation, Madison, WI, USA). To assess body composition, subjects laid flat on the scanner, in light clothes, the DEXA scanner performed a series of transverse 1 cm scans starting at the subject’s head progressing toward the feet [18]. All scans were analyzed by the same investigator.
Participants completed a laboratory-based speed lactate and VO 2 max test [19] via an incremental protocol utilizing a motorized treadmill (HP Cosmos, Germany). The speed lactate test was conducted at a 1% gradient and consisted of 3-minute stages with an initial running speed of 9 km·h -1 . The treadmill speed was increased by 1 km·h -1 at the end of each 3-minute stage. During the final minute of each stage, expired air was collected using a Douglas Bag (Plysu Protection Systems, Milton Keynes, U.K.) for determination of oxygen consumption and carbon dioxide production. Heart rate (Polar, Finland) and rating of perceived exertion (RPE) [20] were also recorded in the final minute of each stage. At the end of each 3-minute stage, a finger prick blood sample was taken in order to analyze blood lactate concentration (Biosen, Cardiff, Wales). The test concluded when lactate concentrations were equal to, or in excess of 1 mmol·L -1 higher than the preceding sample. On test completion, the running speed at each stage was plotted against oxygen consumption (mL·kg· -1 min -1 ) to determine the sub-maximal relationship between running speed and oxygen consumption. The participant then rested for a 10-minute period prior to the commencement of the VO 2 max test [21].
The speed at which the VO 2 max test was conducted was defined as the speed before the lactate increase was 1 mmol·L -1 higher than the preceding sample in the speed lactate test. The VO 2 max test began at 0% gradient and was increased by 1% each minute until volitional fatigue [19]. Expired air was collected via a Douglas Bag during the final minute of the test. On completion of the test, maximum heart rate was recorded, and the expired air sample was analyzed for oxygen consumption, carbon dioxide production and absolute volume. Subsequently, maximal oxygen uptake was determined.
During the pre-season period, participants completed the 1200m shuttle test to estimate MAS [22]. Poles were set at the start point, 20m, 40m and 60m (see Figure 1). Players were instructed to run from the start point to 20m, turn and return to the start point, then to run to the 40m cone, turn and return to the start point, before running to the 60m cone, turn and return to the start point. This sequence was repeated as quickly as possible five times until the distance of 1200m had been achieved [22]. Players were informed how much time was remaining at 1-minute intervals until the test was complete to ensure players were performing maximally [23]. This verbal encouragement has been shown to be a motivational requirement for laboratory assessments of time to exhaustion and central fatigue [24]. Due to the constant change of direction within the test, as previously mentioned, a corrective equation was used, 1200/(Time - 20.3-s (0.7-s for each turn) = MAS (m/s) 9 .
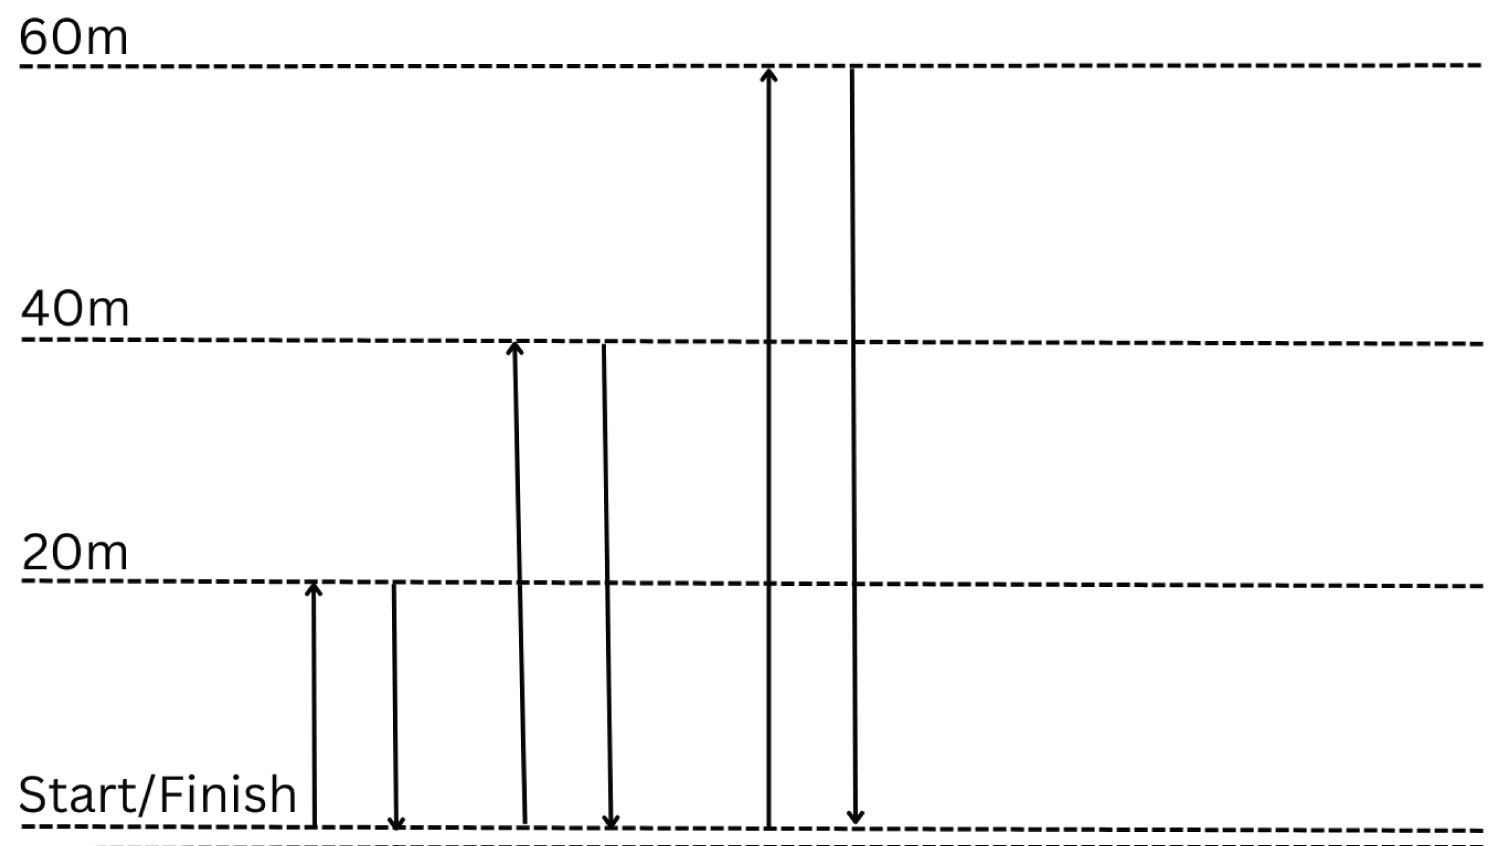 Figure 1: Shows the 1200m shuttle test.
View Figure 1
Figure 1: Shows the 1200m shuttle test.
View Figure 1
Physical data was consistently monitored across the study season during all training sessions and match-play using a 18 Hz Global Positioning System (GPS) technology tracking system (Apex Pod, version 4.03, 50 g, 88 × 33 mm; STATSports; Northern Ireland, UK) that has been previously validated in a student population for tracking distance covered and peak velocity during simulated team sports and linear sprinting [25]. All devices were activated 30-minutes before data collection to allow the acquisition of satellite signals and to synchronise the GPS clock with the satellite’s atomic clock [26]. Quantifying the devices’ accuracy indicated a 2.5% estimation error in distance covered, with accuracy improving as the distance covered increased and the speed of movement decreased [27]. To avoid inter-unit error, each player wore the same device during the study period [28,29], although the present GPS system has previously reported excellent inter-unit reliability [30].
Furthermore, the Apex units have shown good levels of accuracy in sport specific metrics in addition to non-significant and trivial differences when measuring peak velocity against the gold standard measure (Stalker ATS 2,34.7 GHz, United States) [25]. Specifically designed vests were used to hold the devices, located on the player’s upper torso, and anatomically adjusted to each player, as previously described [31]. To avoid potential inter-unit variation players wore the same GPS unit for each training session and match [31]. The GPS signal quality and horizontal dilution of position was connected to a mean number of 21 ± 3 satellites, range 18-23, while HDOP was 0.9. On completion of each session, GPS data were extracted using proprietary software (Apex version 4.3.8, STATSports; Northern Ireland, UK) as software-derived data is a more simple and efficient way for practitioners to obtain data in an applied environment, with no differences reported between processing methods (software-derived to raw processed) [32]. The dwell time (minimum effort duration) was set at 0.5-s to detect high-intensity running and 1-s to detect sprint distance efforts, in-line with manufacturer recommendations and default settings to maintain consistent data processing [31]. Furthermore, the internal processing of the GPS units utilized the Doppler shift method to calculate both distance and velocity data which is shown to display a higher level of precision and less error compared with data calculated via positional differentiation [33].
During the pre-season period a linear speed phase consisting of twice weekly PS exposures were conducted. This protocol consisted of a standing start 10m acceleration zone followed by a 30m sprint with a 10m deceleration zone. Following this, each player’s PS reached during this period was established. The researchers decided to utilize the PS attained during this period, as an average PS per session may be influenced by session content and positional demands and therefore may not reflect a valid PS capacity for each player. All PS were validated visually using STAT Sports (APEX, 1.7) software to ensure no anomalies were included in the analysis.
Using the MAS and PS scores, each athlete’s theoretical ASR was calculated and defined as the difference between the MAS and PS score and reported in m.s -1 [34]. The MAS and PS protocols have previously been utilized by Mendez-Villanueva, Buchheit, Simpson and Bourdon [35] and Hunter, et al. [36] to determine a football player’s MAS and PS. The present study utilized the following calculation to determine ASR:
ASR(m/s) = PS(m/s) - MAS(m/s) 34
In order to determine the relationship between MAS measured in laboratory settings and the MAS measured using the 1200m shuttle field-based fitness test and other related factors, a multiple linear regression model was constructed. The model’s dependent variable was set as VO 2 max, as recorded during the laboratory-based testing protocol. The models’ covariates included the MAS, Lean Mass, PS and ASR. The covariates were identified manually through a backward stepwise procedure. Further case wise diagnostics were conducted to identify outliers using a Cook’s distance > 1.0 [37]. Hypothesis testing was conducted to determine if significant differences existed between the constructed model and a model which makes random predictions. Significance was set at an a = 0.05. Model coefficients are approximated with bootstrap resampling and reported in unstandardized form alongside 95% confidence intervals [38]. The normality of the residuals was assessed using a combination of residual and Q-Q plots. Descriptive statistics are reported as mean plus standard deviation unless otherwise stated. All analysis was conducted in the JASP statistical software (version 0.17.1).
The mean, standard deviation, minimum and maximum dependent, and covariate values are presented in Table 1.
Table 1: Participant descriptive statistics. View Table 1
Table 2 presents the summary information for a null model (H₀) that includes an intercept term b 0 and no covariates. The alternative model (H 1 ) includes the full set of covariates. The alternative model has an adjusted R 2 = 0.431, thus describing 43.1% of the variation in the dependent variable VO 2 max. The model predicts VO 2 max with a mean error of 2.91 kg·min -1 .
Table 2: Model summary. View Table 2
The analysis of variance (ANOVA) test results is presented in Table 3. The results suggest that the model is a significantly better predictor than a model that constantly predicts the mean VO 2 max value (F = 3.422, p = 0.041).
Table 3: ANOVA. View Table 3
The bootstrapped model coefficients are presented in Table 4. The results suggest that while the model is a significantly better predictor than a random or naive model, it is uncertain how the covariates contribute to the model. Individual t-tests produced no significant results and the 95% confidence intervals cross zero in all cases, implying that a covariate may have a positive or negative effect on the models’ predictions. Examining the standardised (scaled) coefficients we observe that ASR (7.373) has the largest effect on the VO 2 max followed by PS (-5.568), MAS (3.604), Body Fat (-0.285) and Lean Mass (-0.185).
Table 4: Bootstrapped coefficients. View Table 4
To check the normality of the residuals, the standardized residuals as a function of the theoretical quantiles are presented using a Q-Q plot, displayed in Figure 1. The residuals track the regression line reasonably well suggesting that the assumptions of normality and linearity are not violated. Examining the residual plot in Figure 2. It can be observed that the residuals are reasonably dispersed around the baseline suggesting that the assumption of homoscedasticity has not been violated.
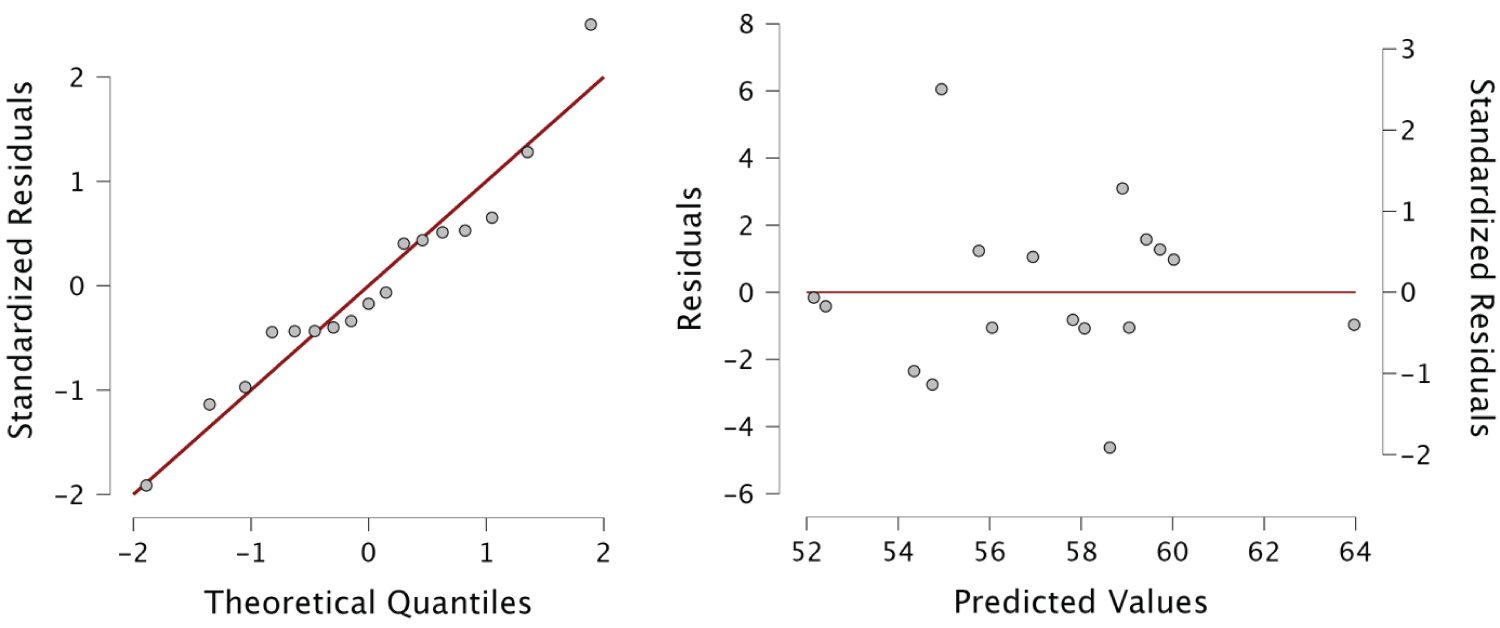 Figure 2: Q-Q Plot Standardised Residuals and Residuals vs. Predicted.
View Figure 2
Figure 2: Q-Q Plot Standardised Residuals and Residuals vs. Predicted.
View Figure 2
The aim of this study was to compare vVO 2 max achieved in a laboratory setting with the MAS achieved in the 1200m shuttle test. A key finding of the present study was the similarity between the MAS and VO 2 max values. The mean vVO 2 max was 4.54 m/s and the mean speed from the 1200m shuttle test was 4.74m/s, thus potentially providing a more accurate value of high-intensity distances than the widely employed generic threshold of 5.5 m/s. This is in agreement with the work of Abt and Lovell [39] who found that high-intensity running speeds based on second ventilator threshold are substantially lower than the default setting of 5.5 m/s. This in turn results in substantially higher high-speed running distances from training and matches that can influence injury risk and performance [40-42]. Although generic speed thresholds have a number of advantages and enable both within and between player and team contrasts, this approach may mask important information [36]. Recent research [43] indicated that field test estimations of MAS are not an appropriate method to determine MAS in well-trained Tier 2 level football players [44], however the 1200m shuttle test has previously shown to have a strong correlation with other MAS tests [9,22] following the application of a correction calculation to account for the repeated accelerating and decelerating during the numerous turns [22].
The findings of the present research suggest that the MAS obtained from the 1200m shuttle test may be a more appropriate threshold than the generic and widely employed 5.5 m/s. As previously stated, this supports previous research of Kavanagh and Carling [45]; and Hunter, et al. [36]. Utilising this MAS may allow practitioners to accurately monitor individual players distance and time covered above physiologically based thresholds, which may provide more detailed information regarding injury prevention strategies and performance markers. Furthermore, by applying individualized thresholds it is arguably more precise for practitioners to design sessions with a planned physiological outcome and may result in prescribing exercise volumes and intensities which are more appropriate to develop the aerobic capacities of the individual. Indeed time spent above the MAS has been shown to correlate (r = 0.77) with improvements in aerobic fitness in youth football players [11], although further research is warranted to quantify the exact amount of time above MAS that is required and any differences in senior professional players.
Previous authors reported that both the Université de Montreal Track Test and a 1500m-time trial were not appropriate methods to determine the MAS in 13 professional football players [43], however the present study found contrasting results. Indeed previous research has found a strong positive relationship between MAS and vVO 2 max [36]. This may partly be explained by the different tests applied and the varying sample sizes. Although, the present study was conducted in the real-world environment of elite professional football and this has previously been noted as potentially a restriction when conducting scientific research, however the findings are noteworthy and key messages can be extrapolated and practically applied. Nonetheless, more research is warranted to confirm the results of these investigations.
In this regard, the assessment to accurately determine MAS is still not consistent in the existing literature. For instance, there is no specific guideline to justify the use of one field-based or treadmill protocol [43]. Previous authors suggested that protocols with pauses of 0.5min to collect blood lactate can be a major limitation due to intermittent short recovery and thus prolonging the point of exhaustion and achieving the final VO 2 max [46]. Furthermore, Thron, et al. [43] reported a range of 3.66-4.7 m/s for MAS, while the current study observed a similar but narrower range of 4.4-5.05 m/s. This may partly be explained by the different level of athlete in both studies. Elite level academy football players, as in the present study findings, may be classified as Tier 4 athletes, while the athletes examined by Thron, et al. [43] were classified as Tier 2 [44]. Therefore, other valid and reliable MAS protocols with a similar study design to the present research should be examined to fully understand the accuracy and appropriateness for coaches and performance staff. The main limitation of the present study was related to the limited sample size of the analyzed players, although this is evidence of applied research in a real-world practical setting of elite professional football [47] . However, this can consequently contribute to restricting the generalisation of such results. Another limitation highlighted was the cross-sectional design which is common place in the existing literature [8]. Furthermore, physical fitness and physiological performance may fluctuate across the season [28], thus a longitudinal study approach may provide more useable, practically applicable findings. Finally, analyzing players from varying playing positions may also highlight differing results and therefore may provide practically applicable additional information . Future research should aim to replicate the design of the present study with larger sample sizes implementing a standard protocol of the 1200m shuttle test within the present study and other tests, such as the Yo-Yo intermittent recovery test, VAMEVAl, and the 30-15 intermittent running test [48,49]. Furthermore, a more granular analysis of playing position may also be considered worthwhile. Other contextual variables to consider that may influence future results are the competitive level [50,51], the country and league in which players are recruited [52], and the temperature of the testing environment [53]. To conclude, this study highlighted similar speed values between the MAS scores achieved from two different tests, a laboratory treadmill test and a field-based 1200m shuttle test. This may suggest that the MAS value obtained from the 1200m shuttle test may be an appropriate score to consider when monitoring and individualizing high-intensity performance rather than the generic threshold of 5.5 m/s. Thus, providing a meaningful practical application for coaches and performance staff.
The authors report no conflict of interest.