Purpose: To evaluate the radiographic findings of anatomical structures, qualitative radiomorphometric indices, soft tissue calcifications, and fractal dimension in panoramic radiographs of HIV-positive (test group) compared with HIV-negative individuals (control group).
Methods: This cross-sectional study analyzed 200 panoramic radiographs, of which 103 were from test and 97 control groups. The images were obtained from the same center and analyzed by six specialists, who assessed the visibility of structures such as the mandibular canals, mental foramina, and maxillary sinus cortices on both the right and left sides. The visibility was classified as fully visible, partially visible, or not visible. The mandibular cortical index was categorized as C1, C2, or C3, and the thickness of the mandibular cortices was measured. The presence of soft tissue calcifications, including tonsilloliths, sialoliths, and atheromas, was also evaluated in the images. Additionally, fractal analysis using the box-counting method was performed.
Results: When comparing the visibility of anatomical structures, mandibular cortical index, soft tissue calcifications, and estimation of mandibular cortical thickness, no statistically significant difference was observed between the groups (p > 0.05). A statistically significant difference was found only in the mandibular angle region when comparing the fractal analysis regions of interest between the test and control groups.
Conclusion: The radiomorphometric indices showed no significant differences between HIV-positive and HIV-negative individuals, indicating that the bone architecture of the two groups is similar.
HIV, Panoramic radiography, Fractals, Bone density
The human immunodeficiency virus (HIV) is a retrovirus that infects immune system cells, primarily CD4+ T cells, leading to their destruction or functional impairment [1]. This process results in the progressive weakening of the immune system, ultimately causing immunodeficiency and increasing the individual's susceptibility to opportunistic infections [2].
Among the metabolic changes associated with HIV and antiretroviral therapy (ART), the reduction in bone quality (osteopenia or osteoporosis) is particularly significant. Such changes can compromise bone microarchitecture, increase bone fragility, and elevate fracture risk [3], with long-term effects that contribute to higher morbidity in individuals with HIV [4]. It is now recognized that multiple factors, including smoking, low body mass index, and alcohol abuse, contribute to the lower bone mineral density observed in individuals with HIV [5].
The monitoring and screening of bone health with HIV are essential, not only due to the high prevalence of osteopenia and osteoporosis in this population but also because of the additional complications that can result from fractures and other bone injuries. Early identification of these changes can enable preventive and more effective interventions, ultimately improving overall health outcomes for these individuals [4,6].
Dual-Energy X-ray Absorptiometry (DEXA) is the gold standard for diagnosing osteoporosis or osteopenia. As a systemic bone disease, osteoporosis also affects the bone density and structure of the jaws [7]. Consequently, some authors suggest using panoramic radiographs as an auxiliary diagnostic tool for osteoporosis by analyzing jawbone patterns and their radiomorphometric indices [8,9].
Among the radiomorphometric indices frequently cited as indicators of decreased bone density is the Mandibular Cortical Index (MCI), derived from the Klemetti method, which assesses the resorption level of the mandibular cortical bone [10]. Additionally, the measurement of mandibular cortical thickness (Mental Index) and the visualization of specific anatomical structures in the facial bones also serve as indicators.
Fractal analysis has become widely used in image studies. Unlike conventional geometry, this mathematical method evaluates shapes that exhibit self-similarity across different scales and is applied to analyze irregular and complex structures [11]. In dentistry, fractal analysis has been employed to measure bone mineral density and to evaluate bone patterns in the jaws, showing potential as a non-invasive and quantitative method for predicting bone changes, such as osteopenia and osteoporosis [12].
Radiomorphometric indices and fractal analysis offer a complementary, low-cost alternative to DEXA, particularly where access is limited or rapid assessment is needed. Although no prior studies have examined their use in HIV-positive populations, this study evaluated panoramic radiographs of HIV-positive and HIV-negative individuals, focusing on bone alterations, qualitative indices, soft tissue calcifications, and fractal dimension.
This study was approved by the Research Ethics Committee of the Faculty of Dentistry at the Federal University of Bahia (Date: 12/18/2016 / No: 43201115.0.0000.5024), in accordance with the ethical standards of the 1964 Helsinki Declaration and its later amendments. It was a retrospective, cross-sectional, quantitative study. The initial sample consisted of 210 panoramic radiographs from HIV-positive (test group) and HIV-negative (control group) individuals. A sample size calculation was undertaken by using software (version: 7.2.4.0; Statcalc, Epi InfoTM, Division of Health Informatics & Surveillance [DHIS], Center for Surveillance, Epidemiology & Laboratory Services [CSELS]). On the basis of a population size of 125 subjects, an expected frequency of 50%, acceptable margin of error of 5% and 95% confidence level, this calculation showed that 94 subjects were necessary for the study. Inclusion criteria required that the panoramic radiographs provided clear visualization of all regions of interest, including the full extent and anatomical structures of the maxilla and mandible. Consequently, images lacking the necessary regions, images with mandibular lesions, or individuals with a history of systemic diseases that could affect analysis were excluded. The final sample comprised 200 panoramic radiographs, with 103 in the test group (51.5%) and 97 in the control group (48.5%).
The images were acquired using the same device at a single imaging center (CS 8000, Carestream Dental, Rochester, NY, USA), with settings of 76 kV and 10 mA and an exposure time of 12.3 seconds. To standardize image quality and minimize potential distortions, patients were carefully positioned in the device, and acquisition planes were set (Frankfurt Plane parallel to the Horizontal Plane; Mid-Sagittal Plane perpendicular to the Horizontal Plane).
The images were analyzed in a blinded manner by six observers with expertise in Oral and Maxillofacial Radiology. The visibility of specific anatomical structures in the craniofacial region, including the mandibular canals, mental foramina, and cortical bones of the maxillary sinuses, was evaluated on both sides. Visibility was categorized as fully visible, partially visible, or not visible (Figure 1).
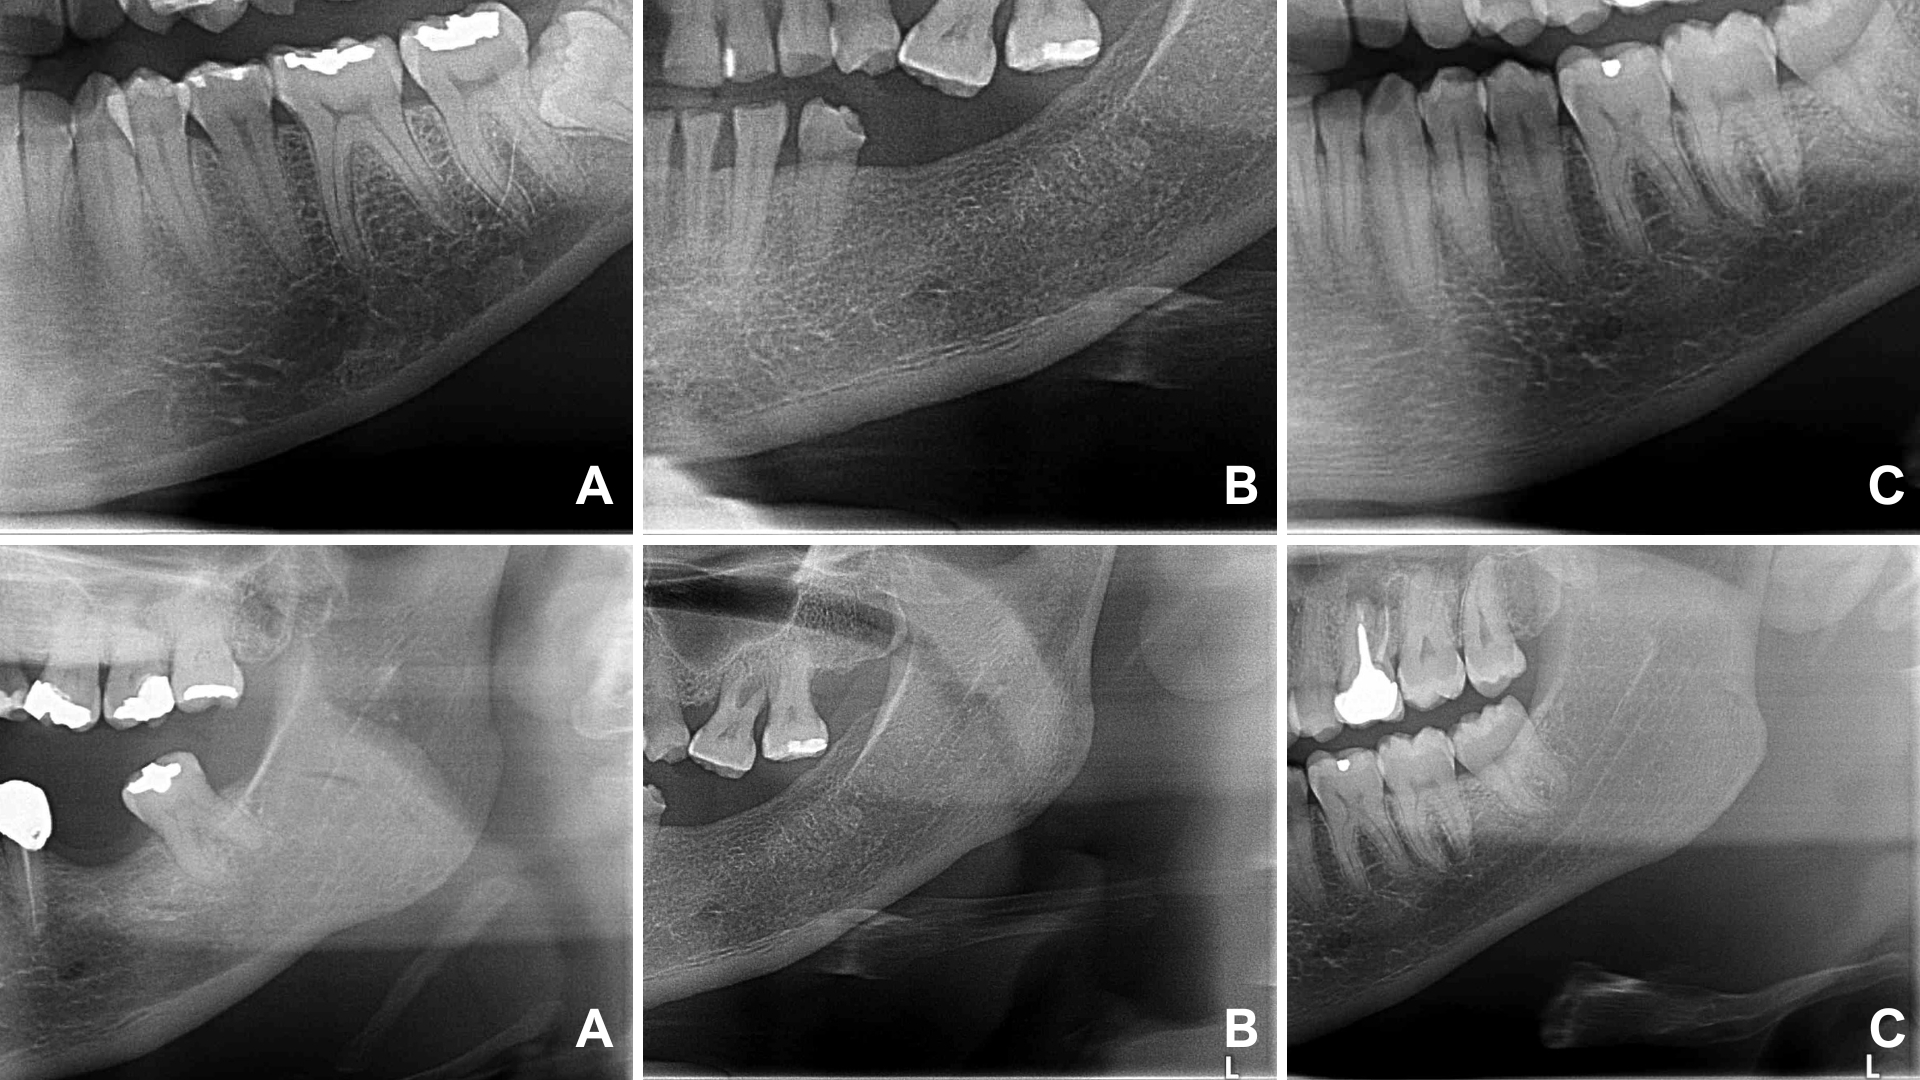 Figure 1: Visibility of the mental foramen and mandibular canal. A) not visible; B) partially visible; C) fully visible.
View Figure 1
Figure 1: Visibility of the mental foramen and mandibular canal. A) not visible; B) partially visible; C) fully visible.
View Figure 1
For the Mandibular Cortical Index, three classifications were considered: C1 (the endosteal margin of the mandibular cortex appeared visibly smooth), C2 (the endosteal margin exhibited semilunar defects or lacunar resorption), and C3 (the cortical bone showed evident endosteal residues and appeared porous) (Figure 2). Additionally, the thickness of the mandibular cortices (Mental Index) on both sides was measured using Studio 3 Software (Radio Memory, Belo Horizonte, Brazil). Images were imported into the software in digital format to maintain original quality and resolution. Linear measurements were conducted using the software's calibrated virtual rulers. These measurements were taken by measuring the distance from a line drawn through the center of the mental foramen to a perpendicular line intersecting the mandibular border (Figure 3).
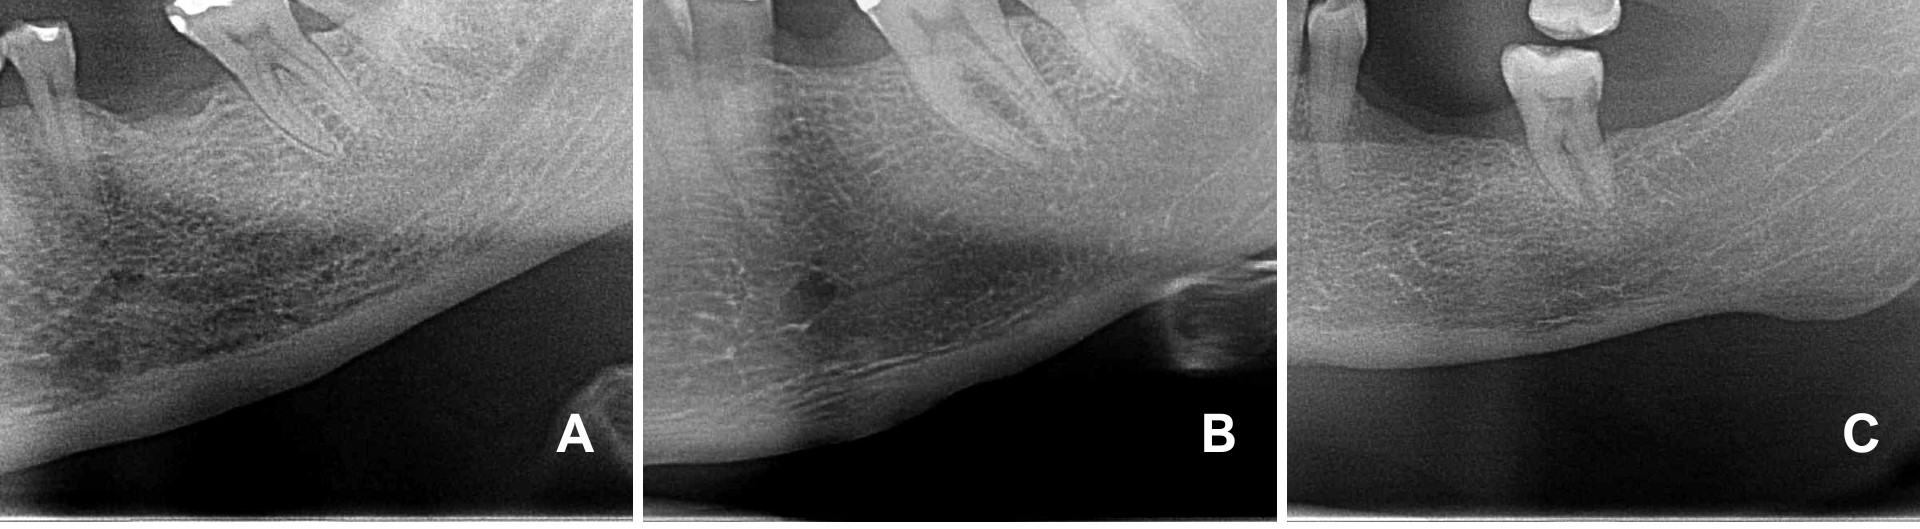 Figure 2: Klemetti's classification for the analysis of the mandibular cortical index. A) C1 (endosteal margin of the mandibular cortex was visibly flat); B) C2 (the endosteal margin displayed semilunar defects or lacunars resorption); C) C3 (the cortical bone showed noticeable endosteal residues and was porous).
View Figure 2
Figure 2: Klemetti's classification for the analysis of the mandibular cortical index. A) C1 (endosteal margin of the mandibular cortex was visibly flat); B) C2 (the endosteal margin displayed semilunar defects or lacunars resorption); C) C3 (the cortical bone showed noticeable endosteal residues and was porous).
View Figure 2
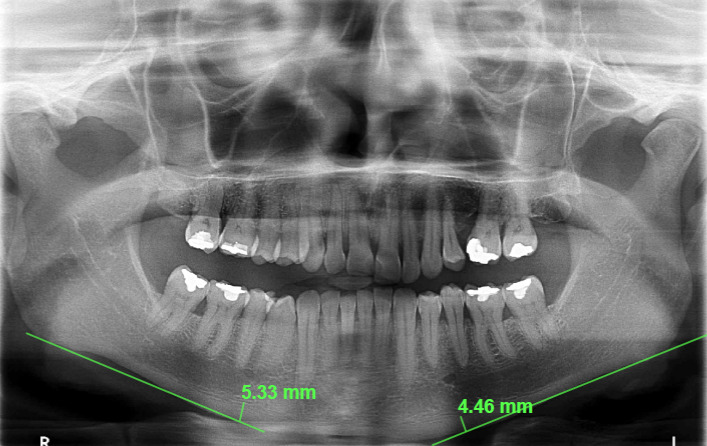 Figure 3: Mental Index measurement on panoramic radiograph. The measurement was made by drawing a line through the center of the mental foramen to a perpendicular line that intersected the edge of the mandible.
View Figure 3
Figure 3: Mental Index measurement on panoramic radiograph. The measurement was made by drawing a line through the center of the mental foramen to a perpendicular line that intersected the edge of the mandible.
View Figure 3
In terms of soft tissue calcifications, the presence or absence of tonsilloliths, sialoliths, atheromas, mineralization of the stylohyoid ligament, and elongation of the styloid process were evaluated bilaterally in the images.
For fractal analysis, following the study by Demiralp, et al. four regions of interest were defined in the mandible, both on the right and left sides: 1) subcortical area in the condyle; 2) supracortical area above the mandibular angle; 3) area above the mandibular canal (distal to the second molar); and 4) area anterior to the mental foramen [13].
After defining the regions of interest (ROI), each corresponding to a square area of 40 × 40 pixels [14], fractal dimension analysis was conducted following the method used in the studies by White and Rudolph [15] and Kis [16]. This analysis was performed with Image J software (National Institute of Health, Bethesda, MD, USA) on a MacBook Pro (Apple, California, USA) with a 13.3-inch liquid crystal display and a resolution of 1280 × 800 pixels, in a darkened room. The images were duplicated and blurred using a Gaussian filter (Sigma (Radius): 35). Soft tissues were removed using Gaussian filter density correction, which eliminated all structures with low and medium density, retaining only higher-density structures.
The processed images were subtracted from the originals, and a gray value of 128 was added to each pixel. The images were then binarized (converted to black and white), eroded (each pixel assumes the minimum value of its neighboring pixels), dilated (each pixel assumes the maximum value of its neighboring pixels), inverted (similar to a negative filter), and finally skeletonized to retain only a central line of pixels (with bone trabeculae in black and the background in white) (Figure 4). The box-counting algorithm was applied, and pixel sizes for each square were calculated. A logarithmic scale graph was generated, and the fractal dimension value was determined from the line constructed on the graph.
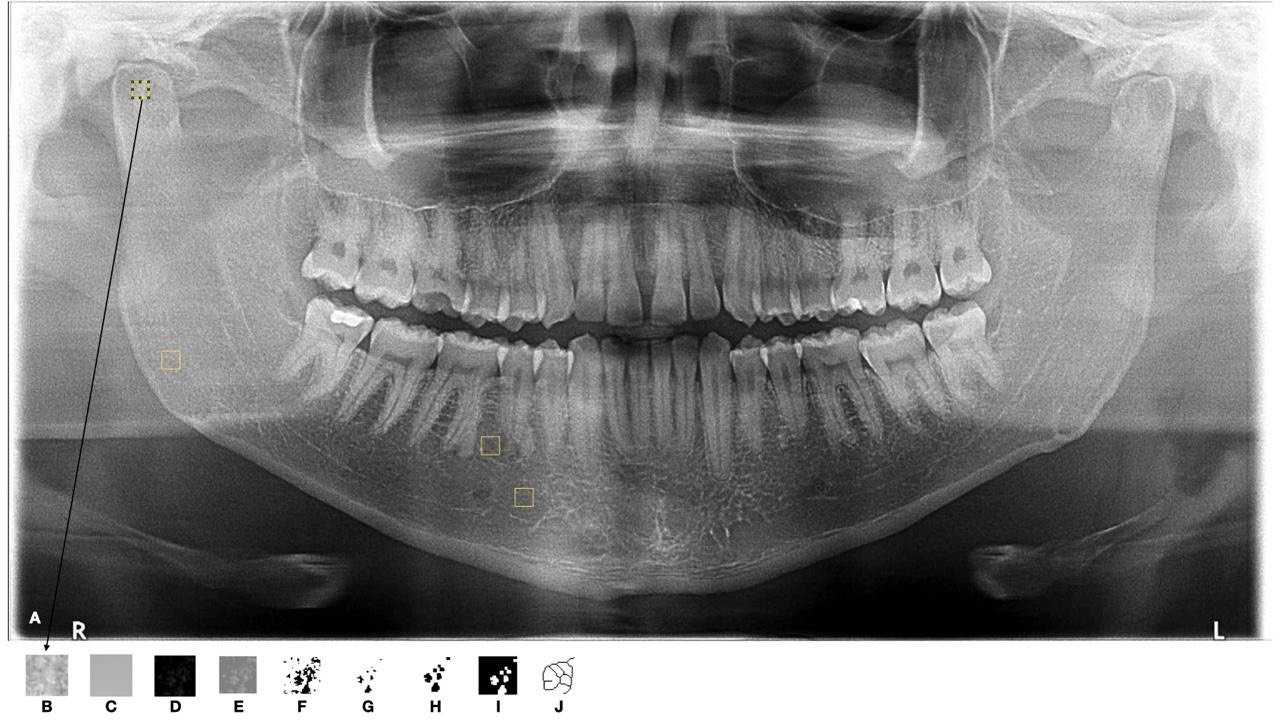 Figure 4: Fractal Dimension steps: A) Panoramic Radiograph; B) Duplication of the Selected ROI; C) Application of Gaussian Filter for Image Blurring; D) Subtraction of the ROI from the Original Image; E) Addition of 128 to the Gray Value for Each Pixel Location; F) Binarization; G) Erosion; H) Dilation; I) Image Inversion; J) Skeletonization.
View Figure 4
Figure 4: Fractal Dimension steps: A) Panoramic Radiograph; B) Duplication of the Selected ROI; C) Application of Gaussian Filter for Image Blurring; D) Subtraction of the ROI from the Original Image; E) Addition of 128 to the Gray Value for Each Pixel Location; F) Binarization; G) Erosion; H) Dilation; I) Image Inversion; J) Skeletonization.
View Figure 4
The data obtained were transcribed into Microsoft Excel spreadsheets and analyzed using IBM SPSS Statistics 10.0 software (SPSS Inc., Chicago, IL, USA). The chi-square test was applied to compare soft tissue calcifications, visibility of anatomical structures, and mandibular calcifications between the test and control groups, assessing whether a significant association existed between these variables and HIV status. The Student's t-test was used to compare the mean values of mandibular cortical thickness and fractal dimension measurements between groups. For intra-examiner reliability, 20% of the sample was re-evaluated. Kappa values for the qualitative variables ranged from 0.70 to 1.00. For the quantitative variables, the Intraclass Correlation Coefficient (ICC) was applied, with the following classification: values below 0.5 indicate poor reproducibility, from 0.51 to 0.75 indicate moderate reproducibility, from 0.76 to 0.9 indicate good reproducibility, and values above 0.91 indicate excellent reproducibility [17]. The ICC values showed an overall excellent intra-examiner reproducibility of 0.98 for the analyzed measurements. The significance level was set at 5%.The significance level was set at 5%.
The age of the individuals ranged from 23 to 69 years, with an average age of 42 years. Regarding gender, 76 individuals (38%) were female, and 124 (62%) were male.
No statistically significant difference was found when comparing the visibility of the mandibular canal, mental foramen, and maxillary sinus between the test and control groups (p > 0.05). In both groups, the mandibular canals were most frequently partially visible, while the mental foramina and maxillary sinus cortices were typically fully visible (Table 1).
Table 1: Comparison of anatomical structure visibility between test and control groups. View Table 1
The most common soft tissue calcification was stylohyoid ligament mineralization, followed by elongation of the styloid process. Only three cases of atheroma were observed, and no cases of sialoliths were found. However, no statistically significant difference was observed between the control and test groups concerning calcifications (p > 0.05) (Table 2).
Table 2: Comparison of soft tissue calcifications between the test and control groups. View Table 2
For the Mandibular Cortical Index (MCI), the comparison between test and control groups showed no statistically significant difference (p = 0.39), with a similar distribution. The C1 index had the highest frequency in both the test (139 cases) and control (137 cases) groups. Only one C3 case was noted in the test group, and three in the control group (Table 3).
Table 3: Comparison of mandibular cortical index between the test and control groups. View Table 3
No statistically significant difference was found between the test and control groups regarding mandibular cortical thickness. The thickness was slightly higher in the control group, with an average of 3.85 mm, compared to 3.68 mm in the test group; however, this difference was not statistically significant (p > 0.05) (Table 4).
Table 4: Comparison of mandibular cortical thickness between the test and control groups. View Table 4
In analyzing the ROIs for fractal dimension, a statistically significant difference was identified only in the mandibular angle region (p = 0.030), with a slightly higher value in the control group (FD: 1.35) compared to the test group (FD: 1.34). No significant differences in fractal dimension were found between the test and control groups in the condyle region (p = 0.151), the premolar region (p = 0.345), or the area anterior to the mental foramen (p = 0.280) (Table 5).
Table 5: Comparison of fractal dimension between the test and control groups in different ROIs. View Table 5
Studies indicate that panoramic radiography is a valuable auxiliary tool for diagnosing osteoporosis [11,12,18]. Panoramic radiographs are used to detect low bone density because they provide a comprehensive view of the jaw and surrounding structures, enabling the identification of bone density changes in a non-invasive, cost-effective, and accessible manner. Our study evaluated the radiographic characteristics of anatomical structures, bone changes, qualitative radiomorphometric indices, soft tissue calcifications, and fractal dimension analysis in panoramic radiographs of HIV-positive individuals in comparison with HIV-negative individuals.
HIV infection is recognized as a significant risk factor for reduced bone mineral density, with a high incidence of osteoporosis. In addition to general risk factors such as smoking and alcohol use, the viral infection itself and antiretroviral therapy are suggested to contribute to the pathogenesis of osteoporosis due to the immunological dysregulation associated with HIV and its inflammatory processes [4,19]. Furthermore, viral load is directly related to RANKL, a molecule involved in osteoclast activation and subsequent bone matrix degradation. Pro-inflammatory cytokines, such as Tumor Necrosis Factor-α (TNF-α) and Interleukin-6 (IL-6), indirectly increase RANKL levels, while regulatory molecules like Interferon-γ (IFN-γ) and osteopontin decrease. These changes are mediated by the parathyroid hormone pathway, which promotes osteoclastogenesis [20-22].
Although the literature on the analysis of bone architecture in HIV-positive individuals using panoramic radiomorphometric indices is limited, existing studies with varied sample populations indicate that these indices and fractal analysis have been utilized to assess bone mineral density and detect potential structural changes [9,10,23]. Moreover, they suggest that indices evaluating mandibular cortical thickness and bone trabeculation offer a non-invasive and cost-effective method for monitoring bone changes over time [24].
The analysis of anatomical structure visibility revealed no significant difference between the test and control groups. In individuals using antiresorptive medications, such as bisphosphonates, these agents may affect bone density and cortical structure, resulting in dense bone sclerosis and increased cortical definition in anatomical structures [25]. In contrast, HIV infection and antiretroviral therapies are associated with an elevated risk of reduced bone mineral density, which can lead to decreased bone quality [26] and, consequently, to the softening of cortical boundaries in specific structures.
The absence of a statistically significant difference between HIV-positive and HIV-negative individuals may be attributed to the distinct factors affecting bone density and quality within each group, which influence bone architecture in varied ways. As a result, these variations may counterbalance each other, leading to a lack of statistically significant differences in the study findings.
In this study, the Mandibular Cortical Index (MCI) was used to qualitatively classify three degrees of resorption at the lower mandibular border. A higher prevalence of index C1, characterized by a regular endosteal margin of the cortex, was observed, with no significant difference between the test and control groups. Drozdzowska, et al. [27] also found no statistically significant differences in MCI when evaluating panoramic radiographs of normal and osteopenic/osteoporotic postmenopausal edentulous women. This finding suggests that HIV-positive individuals may not exhibit a greater tendency for developing bone changes detectable on panoramic radiographs.
It is important to note, however, that differences between the results of this study and those demonstrating statistical differences in bone architecture among groups predisposed to osteopenia and osteoporosis may be explained by variations in study conditions, including the age range of participants [28]. Additionally, since the MCI is a measure with low sensitivity and specificity, based on a qualitative classification of the mandibular cortex, subjectivity may influence its assessment [29].
Soft tissue calcifications, or calcinoses, are frequently observed incidentally on routine panoramic radiographs. This condition is marked by the deposition of calcium in soft tissues, including the skin, subcutaneous layers, muscles, and organs [30]. In HIV-positive individuals, due to the direct effects of the virus and the inflammatory impact of the disease, bone resorption and formation processes become unbalanced, with increased osteoclast activity and suppressed osteoblast function [6,31]. This study found no statistically significant differences between groups regarding any of the soft tissue calcifications analyzed.
Among the calcifications analyzed, mineralization of the stylohyoid ligament was the most prevalent finding. However, it is important to recognize that, although common, this calcification is often incidental and is not always directly associated with painful symptoms [32,33].
In a study involving individuals with cancer undergoing antiresorptive therapy, Gaêta-Araújo, et al. concluded that, despite the therapy's impact on bone metabolism-similar to the effects of HIV and ART-a higher prevalence of soft tissue calcifications is not expected in normoreactive individuals [25]. The absence of a statistically significant difference in soft tissue calcification prevalence between HIV-positive and HIV-negative individuals suggests that factors beyond immunological or virological status may play a more prominent role in its development.
As previously discussed, HIV infection exerts systemic effects, and consequently, the mandible and maxilla are not exempt from skeletal changes associated with this viral infection and ART. The mandible, while characterized by a well-defined cortical bone, undergoes increased bone remodeling rates and an imbalance in bone formation and resorption processes, leading to a reduction in cortical thickness [34]. In this study, comparisons of cortical bone width between the test and control groups did not reveal a statistically significant difference. Research suggests that bone mineral density and cortical thickness can be influenced by various factors beyond HIV, including age, sex, dietary habits, and physical activity levels. Additionally, individual factors such as treatment adherence, duration of infection, nutritional status, and the presence of comorbidities may have contributed to the lack of significant differences observed between groups [35].
In this study, fractal dimension - a mathematical method for analyzing complex shapes [36] - was used to evaluate trabecular bone in individuals with HIV, comparing their bone architecture to those without this systemic condition. Following the methodology outlined by White and Rudolph and implemented by Demiralp, et al. the fractal dimension was calculated to illustrate changes in bone architecture and density [13,15]. Higher fractal dimension values indicate a denser and more complex bone structure with reduced trabeculation. The box-counting method, commonly used for fractal dimension calculations, was employed in this study to assess bone architecture [37].
The most appropriate region for evaluating fractal dimension in panoramic radiographs is located above the mandibular canal, specifically in the distal region of the second premolar, as muscle insertions exert less influence in this area [13]. A statistically significant difference was found only in the mandibular angle, where the control group showed slightly higher values. This may be due to anatomical overlap and the influence of the masseter muscle in this region, potentially affecting fractal value accuracy.
In this study, all HIV-positive participants were undergoing highly active antiretroviral therapy (HAART), which combines multiple antiviral medications. Typically, three agents are administered together, with integrase and fusion inhibitors being the most common choices currently. However, these medications may contribute to reduced bone mineral density. In men, this reduction is associated with testosterone deficiency and elevated parathyroid hormone levels, while in women, it is linked to advanced age and menopause [38,39]. Bedimo, et al. identified an association between the cumulative use of antiretroviral agents, especially tenofovir and protease inhibitors, and an increased risk of osteoporotic fractures [40]. Thus, both antiretroviral therapy and HIV contribute to bone demineralization, raising the risk of fractures. Bone loss is most pronounced within the first two years of therapy and generally stabilizes thereafter. Due to the complexity of interactions between antiretroviral agents and HIV in reducing bone density, optimizing therapy and implementing preventive strategies for bone loss is essential [41]. However, in the present study, these parameters could not be adequately evaluated due to a lack of information on the timing of HIV diagnosis and treatment initiation, total duration of antiretroviral therapy, medication regimen used, treatment interruptions, and any potential associated comorbidities.
Monitoring CD4+ T lymphocytes is crucial, as reductions in these cells lead to immunosuppression, increasing susceptibility to various diseases. CD4+ values below 500 cells/mm ³ are considered abnormal, and levels under 200 cells/mm ³ elevate the risk of opportunistic infections. This parameter can also inform antiretroviral therapy decisions, as initiating treatment at higher CD4+ levels may reduce the incidence of osteoporosis and fractures [42]. In this study, it was not possible to assess this parameter and its potential influence due to the absence of such data in the collected records.
This study had some limitations. The sample was non-homogeneous and cross-sectional, limiting the generalizability of results compared to a longitudinal design. The absence of standardized antiretroviral therapy may have influenced outcomes. Additionally, the lack of data on viral load and lifestyle factors, which affect bone health, represents a significant limitation. Future studies should use more homogeneous samples and include detailed information on viral load, antiretroviral regimens, and lifestyle to improve accuracy and applicability.
In conclusion, the analysis of radiomorphometric indices revealed no significant differences between HIV-positive and HIV-negative individuals. This suggests that, despite the systemic changes associated with HIV, bone structure in both groups appears to be similar.
The authors declare no conflict of interest. This study is funded by FAPESB-Research Support Foundation of the State of Bahia
This study is funded by FAPESB-Research Support Foundation of the State of Bahia.
All authors contributed to the study conception and design. Material preparation, data collection and analysis were performed by all authors. The first draft of the manuscript was written by Arthur Soares de Oliveira and all authors commented on previous versions of the manuscript. All authors read and approved the final manuscript.