This study aimed to the Snellen whether measurements of distance visual acuity using Snellen Chart displayed on iPad tablet is comparable with traditional light-box Snellen Chart among patients in Ophthalmology Outpatient Department by using Snellen iPad application (Eye Chart HD iOS application) as a visual acuity assessment tool. It utilized a cross sectional study design among 100 new patients identified through purposive sampling. Only those who met the criteria (new patients, male or female and aged 8-years-old and above) were included in the study while patients who had a visual acuity of less than 6/30 were not included. Visual acuity was assessed through two testing modalities: (1) The traditional Snellen Light-Box Chart and (2) An iPad Mini 2 with Eye Chart HD iOS application. Findings showed that results of the Snellen iPad application (Eye Chart HD iOS application) and traditional light-box Snellen Chart are comparable with each other. Confounders were also identified such as patient-related factors wherein participants may have memorized the traditional Snellen Chart prior to their eye examination, thereby invalidating the accuracy of the results from the first testing modality employed. Recommendations for future studies include using a larger sample size, exploring the use a paid apps, and controlling the luminous intensity of the iPad Mini 2 and the traditional light-box Snellen Chart to ensure that luminous intensity of each test modality does not affect the validity of the outcome or results of the study.
Health technology, Mobile applications, Snellen chart, Visual acuity, Ipad app, Eye chart
Despite the popularity of the Snellen Wall Chart, there are several circumstances in which its application is deemed impractical particularly due to its required viewing distance of six (6) meters (20 feet). On the other hand, the smaller Snellen charts have been designed to be viewed at shorter distances, with three (3) meter charts commonly seen in primary care settings. This, however, can still pose problems as the charts themselves are large, bulky and often lack mobility due to wall fixation. In areas such as hospital wards and primary care settings, there is often limited access to a Snellen chart and available space for adequate viewing distances. As a result, visual acuity is crudely assessed or often omitted during complete physical examination despite being clinically indicated.
With the emergence of mobile technology devices, a rapid explosion in the use of medical mobile applications has been observed with these tools being available for little to no cost to anyone with a compatible device [1]. A very high proportion of medical students and doctors have access and willingness to use such devices [2]. It has also been suggested that these apps will revolutionize point-of-care medicine, patient education, self-management of disease and remote monitoring. While the standardization of visual acuity testing requires optimal conditions, practitioners assessing visual acuity in the non-standard setting have access to a large number of visual acuities apps [3]. Currently, in the Philippines App Store for Apple, there are more than 50 iOS supported apps available when searching using the keyword "visual acuity". Similar results are returned when searching for Android applications at the Google Playstore, hence, a plethora of options is readily available to healthcare professionals when considering the use of mobile technology in the assessment of visual acuity.
There are only three published studies to date comparing the use of the Snellen Wall Chart with mobile applications and devices [4-6]. These studies, however, were all conducted in optometry clinics and in university environments rather than at bedside, at a primary care setting or at an outpatient department. The aim of this study is to assess the suitability of portable tablet devices for visual acuity assessment in patients, specifically at Outpatient Department.
The main objective of the study is to assess whether measurements of distance visual acuity using Snellen Charts displayed on iPad tablets is in agreement with traditional light-box Snellen Chart among patients in Outpatient Department by testing the validity of the Snellen iPad application (Eye Chart HD iOS application) as a visual acuity assessment tool.
The findings of this study will rebound to the benefit of society given that the early testing and detection of vision problems can prevent eye issues from getting worse and from further complications. Specifically, it will benefit:
1. General practitioners and ophthalmologists: These findings would provide both General Practitioners and Ophthalmologists evidence-based data that would substantiate the use of the Snellen Applications in an iPad to test the visual acuity of their patients. Since this device is portable, handy, and convenient to use, they can easily bring it across remote and far-flung areas in the Philippines for patient screening.
2. People who own iPads such as parents and school teachers: Considering that a lot of Filipinos already own an iPad, they can easily install the application, follow the instructions provided and be able to check visual acuity at the comfort of their own homes or workplace before they proceed to further consultation with their physicians.
3. Department of Health (DOH): The findings from this study would also assist the DOH in decreasing the prevalence of avoidable blindness in the Philippines through the provision of quality eye care and early visual acuity assessment; and
4. Local Government Unit (LGU) and Communities: If findings from this study would prove the validity of the mobile application, this shall enable the LGUs and communities to take proactive roles in the promotion of eye health and prevention of blindness.
This study focused on the validity of the Snellen iPad application against the Traditional Light-Box Snellen Chart. It was conducted at Ophthalmology Outpatient Department on new patients ages 8-years-old and above, male or female, and with visual acuity better than 6/30. The patients were screened using two visual acuity assessment tools namely (1) The traditional light-box Snellen Chart and (2) The Snellen iPad application (Eye Chart HD iOS application) using an iPad Mini 2 with Retina Display. The study was conducted from November 6 to December 5, 2017.
The following terms have been defined for clarity and better understanding of this study:
Visual acuity - refers to the "spatial resolving capacity" of the eye or the size of an object that can be resolved with an eye. It can be measured by identifying the angle subtended at the eye by the smallest recognizable optotype. In this study, this refers to the measurement of eye function through the utilization of the Standard Snellen Chart and Eye Chart HD iOS application.
Traditional lightbox snellen chart - refers to the conventional eye chart used by eye care professionals to measure visual acuity. It is printed with eleven lines of block letters. The first line consists of one very large letter, which may be one of several letters, for example E. Subsequent rows have increasing numbers of letters that decrease in size. In this study, this refers to the visual acuity assessment tool in OPD that will be used to test the patients included in the study.
Eye chart HD - this refers to the free iOS application available at the iOS App Store. It uses an iPad to display the Snellen Chart. The letters can be randomized to avoid memorization. In this study, this refers to the iPad app used to assess the visual acuity of the patients.
Traditionally, visual acuity testing is conducted using a Snellen Wall Chart which was originally designed and used by Dutch Professor of Ophthalmology named Herman Snellen in 1862. The Snellen Chart is one of the oldest standards for visual acuity testing. Prior to the late 1800s, vision testing was not standardized. Snellen sought to correct this by defining the symbols or optotypes shown and the distance from which the reading should be made. Snellen began with shapes and signs but later decided that letters would work best.
Snellen also defined a system for measuring visual acuity. The Snellen Fraction, known to many as fractions of 20 (20/20, 20/25, 20/30, etc.) is defined as the testing distance over the distance at which the smallest letter read by the patient subtends an angle of 5 minutes of arc. This can either be measured in feet (where the distance employed for the test is most commonly 20 feet), in meters (where 6 meters is the common testing distance), or in any other equivalent unit of measure.
In 1999, the World Health Organization, together with more than 20 international non-governmental organizations involved in eye care and prevention and management of blindness that comprise the International Agency for the Prevention of Blindness (IAPB), launched VISION 2020: The Right to Sight. This global initiative aims to intensify and accelerate prevention of blindness activities, thereby eliminating avoidable blindness by the year 2020. It shall address the main causes of all preventable and treatable blindness as a public health issue by the year 2020 [7-10]. The most recent Global Action Plan (GAP) "Universal Eye Health: A Global Action Plan 2014-2019) unanimously adopted by all member states at the World Health Assembly last 2013 included a further dimension encompassing "universal access to comprehensive eye care services" [11]. Based on the GAP, there is ample evidence that comprehensive eye care services need to become an integral part of both primary health care and health systems development, hence the urgent need to train more personnel to respond to the growing needs of the population, and to explore cost-efficient and convenient alternatives for eye testing facilities, especially in low-budget settings and remote areas.
The identified limitations of the Snellen Chart have largely been overcome by the development of alternatives such as the LogMAR (Logarithm of the Minimum Angle of Resolution) acuity charts which enabled more accurate estimates of visual acuity compared to the Snellen Chart and is now more frequently used in clinical research, and the Early Treatment of Diabetic Retinopathy Study (ETDRS) test [5]. Notwithstanding these developments, however, the Snellen Chart still remains as the dominant method for visual acuity testing in clinical practice, which may be due to factors including familiarity and simplicity.
Another potential alternative is brought about by recent developments in mobile phone technology. In 2015 alone, smartphone ownership has been on the rise, with substantial increased occurring in emerging economies like Lebanon (+28 percentage points), Jordan (+25) and the Philippines (+22) [12]. Indeed, mobile technology in the medical community has the power to significantly improve both healthcare professional (HCP) and patient experience through improved healthcare information delivery, real-time patient monitoring, research data collection, efficient HCP collaboration, and mobile telemedicine.
Bastawrous, et al. [5] demonstrated in their study conducted in one hundred twenty patients who underwent visual acuity test with an iPad2 and conventional light-box chart. While the LogMAR visual acuity results from the iPad were significantly higher than those from the light box (P < 0.001), VA from iPad is reliable only when Snellen VA is better than 0.1 (20/200). Perera, et al. also stated that smartphone applications must be rigorously validated before they are accepted into clinical practice [6].
On the other hand, a study conducted by Black, et al. [3] revealed that iPad tablet visual acuity measurements were significantly poorer (approximately 2 LogMAR lines) than those made using ETDRS charts due to glaring effect. Fitting the iPad with antiglare screen, however, resulted in acuity measurements that were equivalent those made using gold standard charts. Furthermore, there was no variation in visual acuity measurement and luminance of the iPad screen whether the available battery charge ranges from 5% to 100% [3,4].
The study utilized a cross sectional study design that was carried out from November 6 to December 5, 2017. Cross sectional studies are usually conducted to estimate the prevalence of the outcome of interest for a given population, commonly for the purposes of public health planning.
The study was conducted at Ophthalmology Outpatient Department (OPD).
The study population included new patients in the Ophthalmology OPD. The sample size recommended by Martin Bland for Bland-Altman analysis was 100 which gives an acceptable standard error at 95% [8]. Random sampling was used to eliminate bias in the study.
Considering the nature of the study, the respondents were identified through purposive sampling. Only those who met the criteria (new patients, male or female and aged 8-years-old and above) were included in the study.
Patients who had a visual acuity of less than 6/30 were not included.
The data gathering instrument used was an iPad Mini 2 with Retina Display (Screen Resolution 2048 × 1536, Screen size 7.9 inches, Pixel Density 326 PPI and Screen Type LCD Active, Color, Backlit). The latest version of the Eye Chart HD iOS application was installed from the iTunes App Store. The brightness was set to 75% and the battery life was also standardized at 80% and above. After testing the visual acuity in traditional light-box Snellen Chart, the patients were then screened using iPad chart. All assessments were performed by the same researcher to eliminate intertester variability issues [4] (Figure 1).
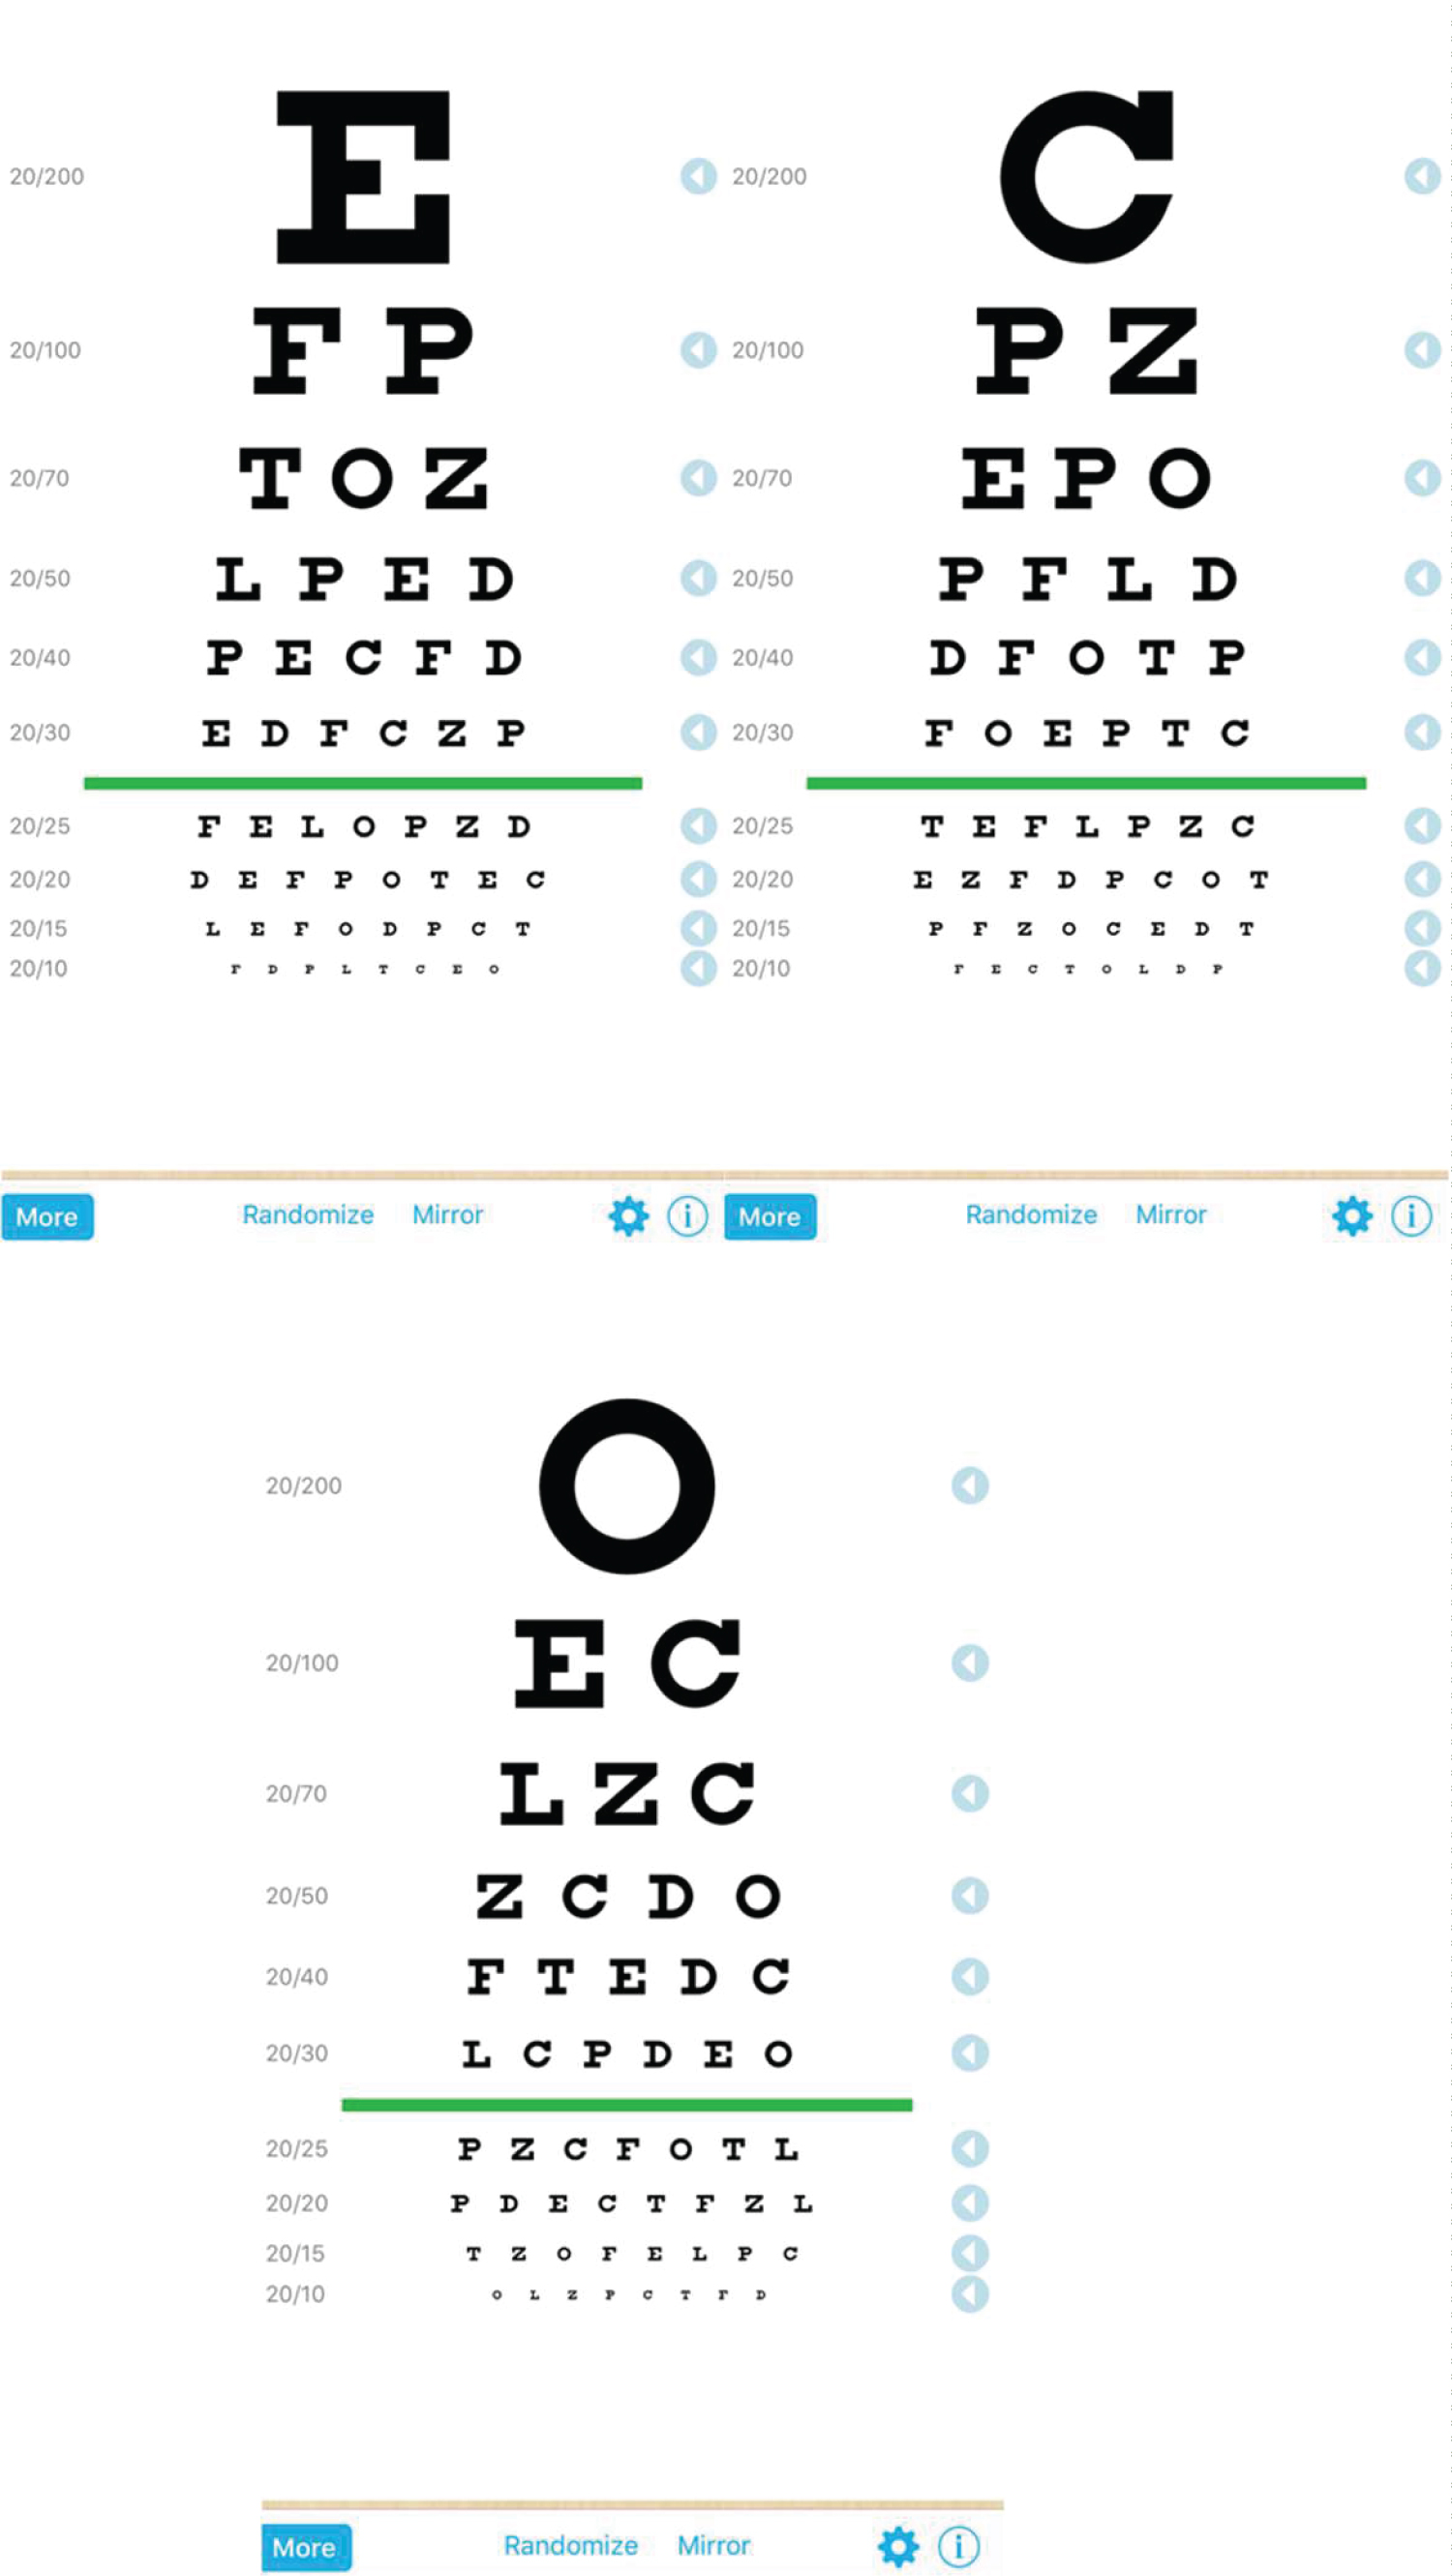 Figure 1: Screen captures of the EYE CHART HD iOS application.
View Figure 1
Figure 1: Screen captures of the EYE CHART HD iOS application.
View Figure 1
Assessment of visual acuity was taken once in each modality:
1. Traditional Snellen Light-Box Chart- illuminated and placed at 6 meters.
2. iPad Mini 2 with Eye Chart HD iOS application – placed at 2 meters.
Testing was undertaken at the OPD in a quiet room with ambient lighting that is typically seen at any OPD of different medical institutions. Lux measurements at the traditional Snellen Light-Box Chart and the iPad Mini 2 were at 280 lx and 256 lx, respectively. Brightness settings on the iPad Mini 2 was set at 75%. The Snellen Light-Box Chart was hung at approximate eye height (0.8 meters above the ground level) and markings were made on the ground at 3 meters from the wall to the mirror placed in front of the patient making a distance of traditional Snellen Light-Box Chart of 6 meters, and 2 meters for the iPad Mini 2 testing distance.
Participants were instructed to sit on the testing area facing the mirror for the traditional Snellen Light-Box Chart. The patients were also instructed to face the iPad Mini 2 directly at a distance of 2 meters. Each eye was assessed with the contralateral eye covered, and participants were asked to read from the top line downwards to the smallest line they could read. The contralateral eye was tested in a similar fashion.
The same procedure was done when participants is with pinhole. This was repeated for the iPad Mini 2 app, with the researcher holding the iPad Mini 2 at 2 meters which was the recommended distance for viewing the app. The letters that appeared at the iPad app were interchangeable to prevent memorization. No time restrictions were placed on participants. All assessments were performed by the same researcher to eliminate intertester variability issues.
The Bland Altman Analysis was utilized for the assessment of the agreement between the two methods of clinical measurement utilized. An important requirement of the Bland-Altman Method for measuring agreement is that the two methods for measuring the same characteristic must use the same scale of measurement. Thus, all results from both tests were converted to Logarithm of the Minimum Angle of Resolution (LogMAR) Visual Acuity wherein LogMAR VA = log (1/Snellen Visual Acuity) for Bland Altman statistical analysis. Further, all data were computer generated and when plotted, the points should line up along the line y = x (line of identity).
The graph displays a scatter diagram of the differences plotted against the averages of the two measurements. Horizontal lines were drawn at the mean difference, and at the limits of agreement. The limits of agreement (LoA) are defined as the mean difference ± 1.96 SD of differences. If these limits do not exceed the maximum allowed difference between the two methods Δ (the differences within mean ± 1.96 SD are not clinically important), the two methods agree and may be used interchangeably.
Proper interpretation considers the 95% Confidence Interval (CI) of the LoA. To be 95% certain that the methods do not disagree, Δ must be higher than the upper 95 CI limit of the higher LoA and Δ must be less than the lower 95 CI limit of the lower LoA (Figure 2).
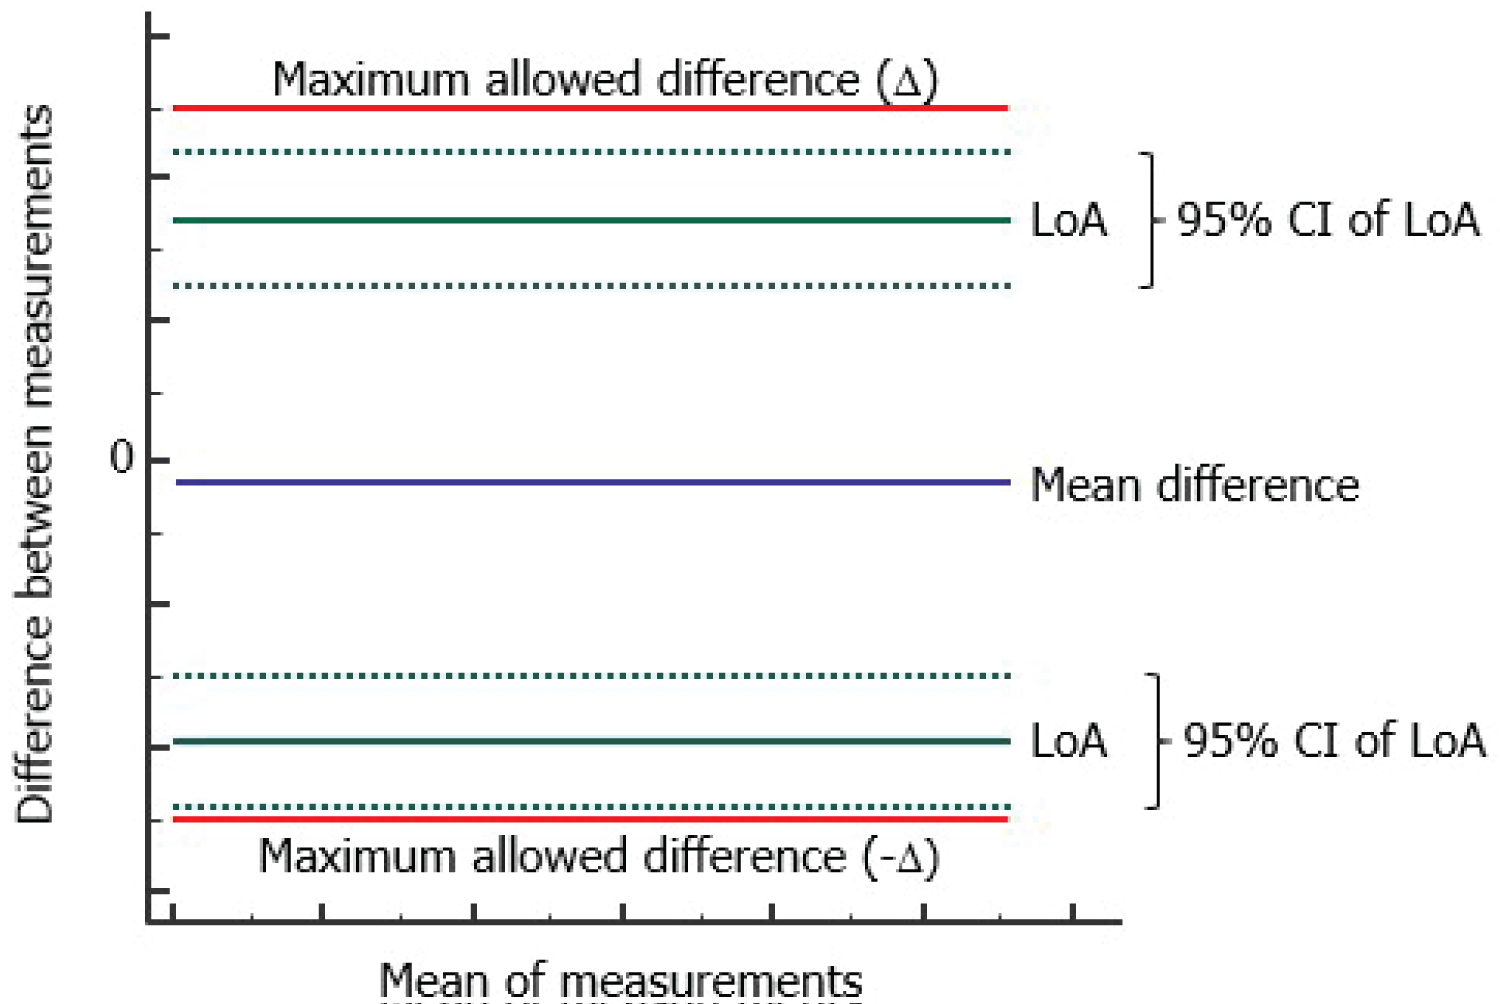 Figure 2: Bland altman analysis graph interpretation.
View Figure 2
Figure 2: Bland altman analysis graph interpretation.
View Figure 2
A total of one hundred patients participated in the study with ages ranging from 19 to 79-years-old with a mean age of 39. Out of the 100 participants, 41 are male and 59 are female (Figure 3). Their visual acuity was assessed twice which corresponds to one per each test modality. This resulted to a total of 200 eyes assessed in each test modality, giving an overall total of 400 eyes assessed.
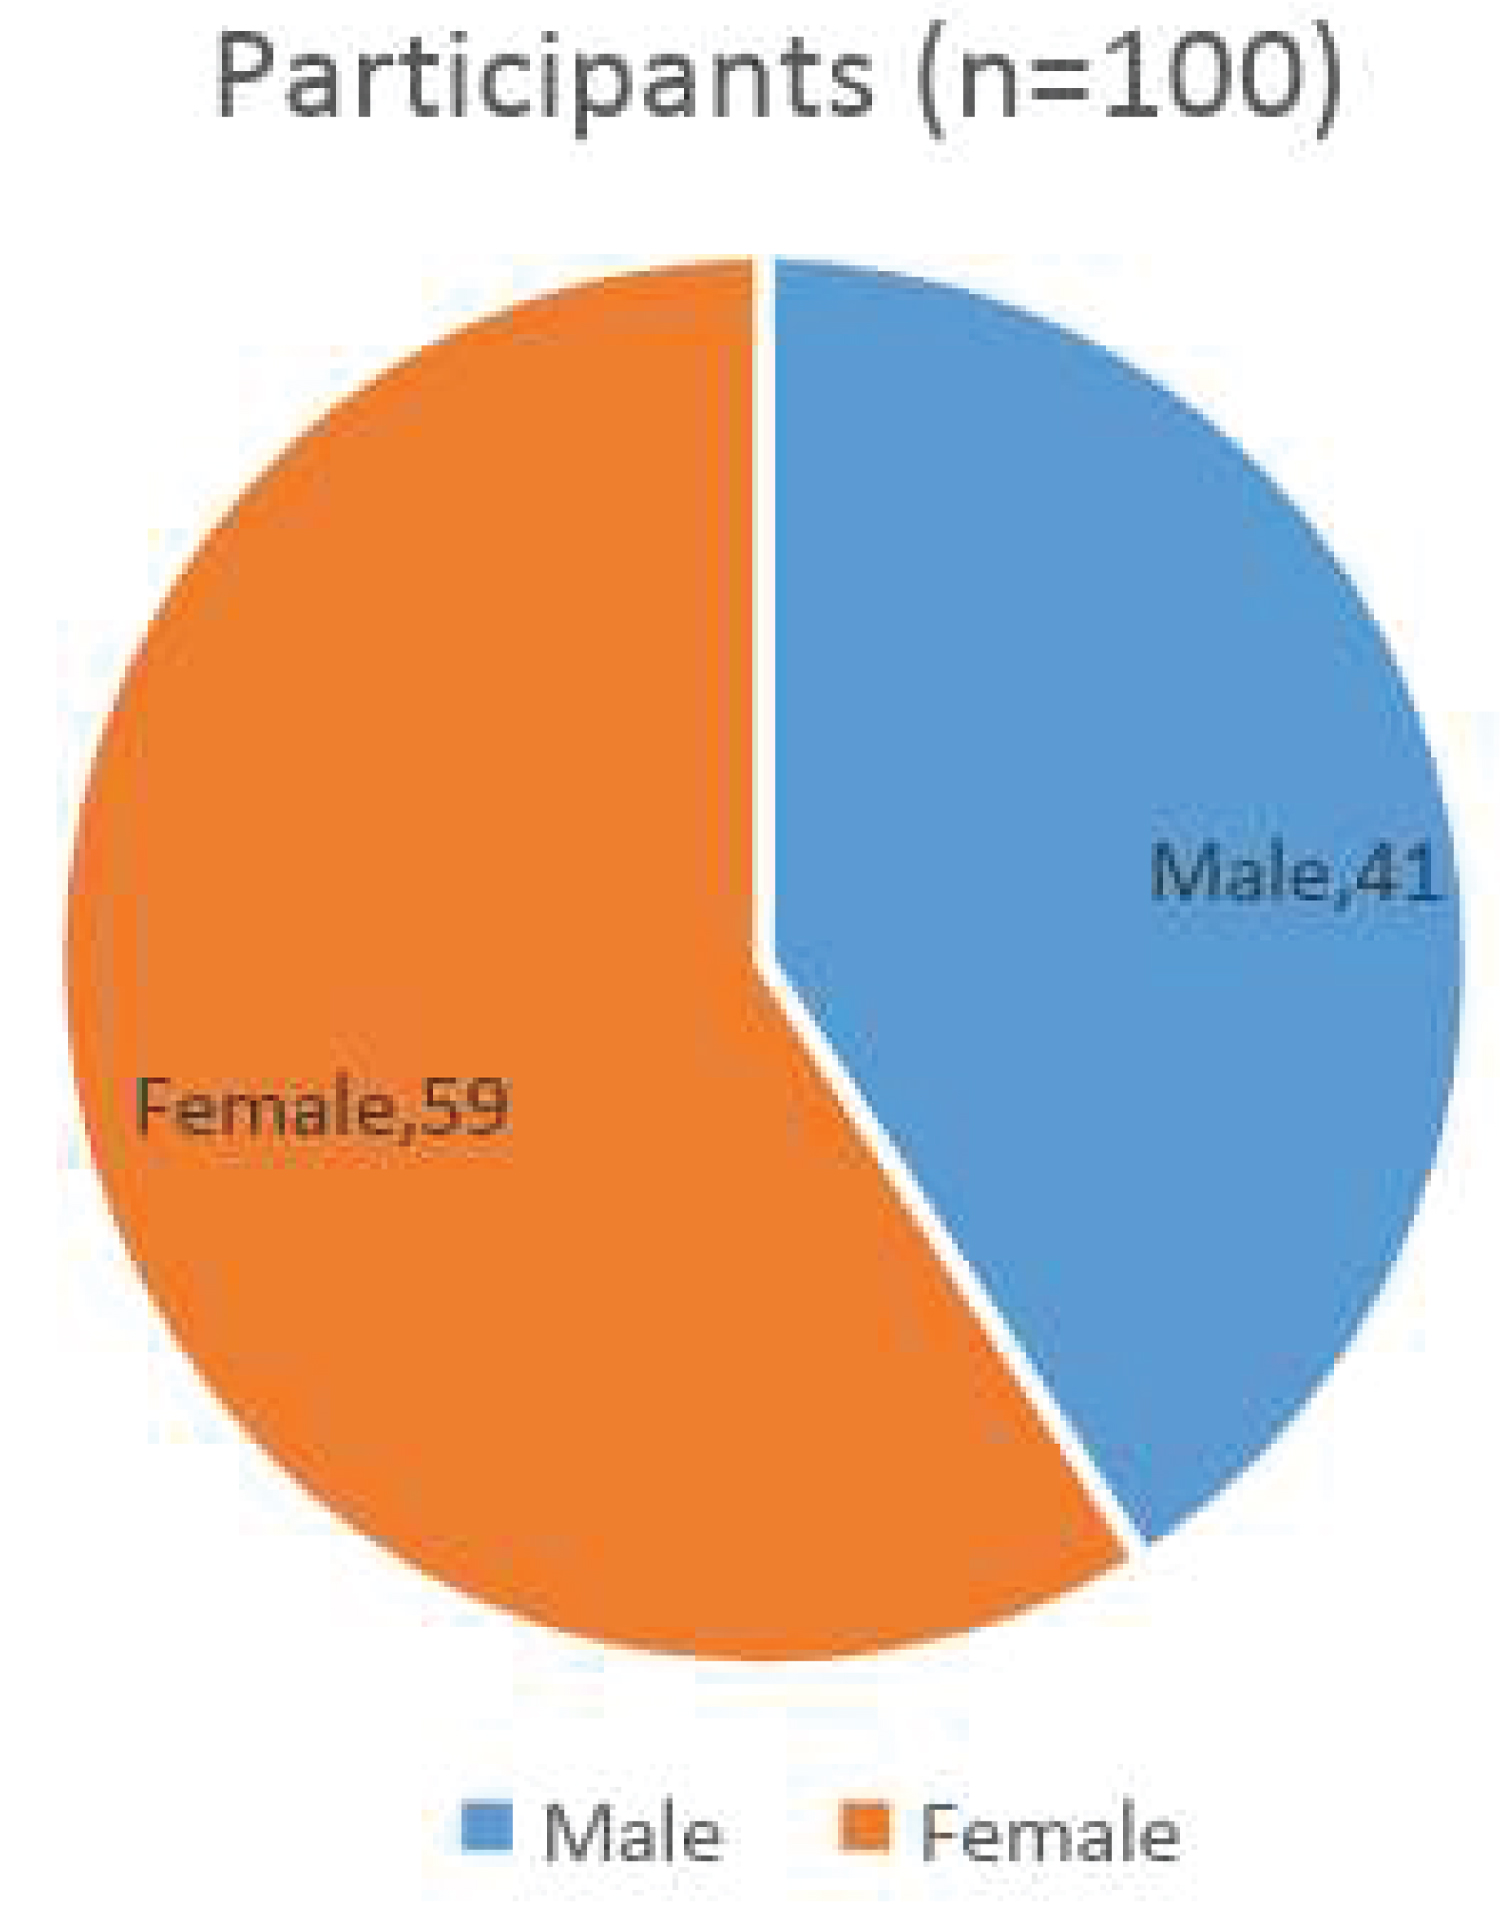 Figure 3: Sex distribution of study participants.
View Figure 3
Figure 3: Sex distribution of study participants.
View Figure 3
The Snellen VA of each participant which were tested two modalities were converted to LogMAR scores using the formula:
The results summarized in Table 1, showed that 25 out of 100 participants underwent pinhole visual acuity in the right eye which were classified under Pair 3 while 27 underwent the same for the left eye and were classified under Pair 4. The observed mean scores for each group are closer to each other (Range: 0.09-0.25) while the computed standard deviations scores are also closer to each other and ranges from 0.13 to 0.26. The Standard Error Mean for all pairs was equal to 0.02, hence, the results from each group of participants tested using two modalities yielded close values to one another.
Table 1: Summary of results for groups tested using the Snellen Chart (Snellen VA) and the iPad mini 2 app (iPad VA) including the mean, number of participants, standard deviation and the standard error mean. View Table 1
Table 2, on the other hand, demonstrates that when the participants of each modality were paired with each other in Snellen VA OD and iPad VA OD, the confidence interval of the difference resulted to a lower difference of 0.02 and an upper difference of 0.6. The mean difference in this group is 0.04. Further, the participants paired in Snellen VA OS and iPad VA OS showed a lower difference of 0.01 and an upper difference of 0.49 with a mean difference of 0.03 (Figure 4).
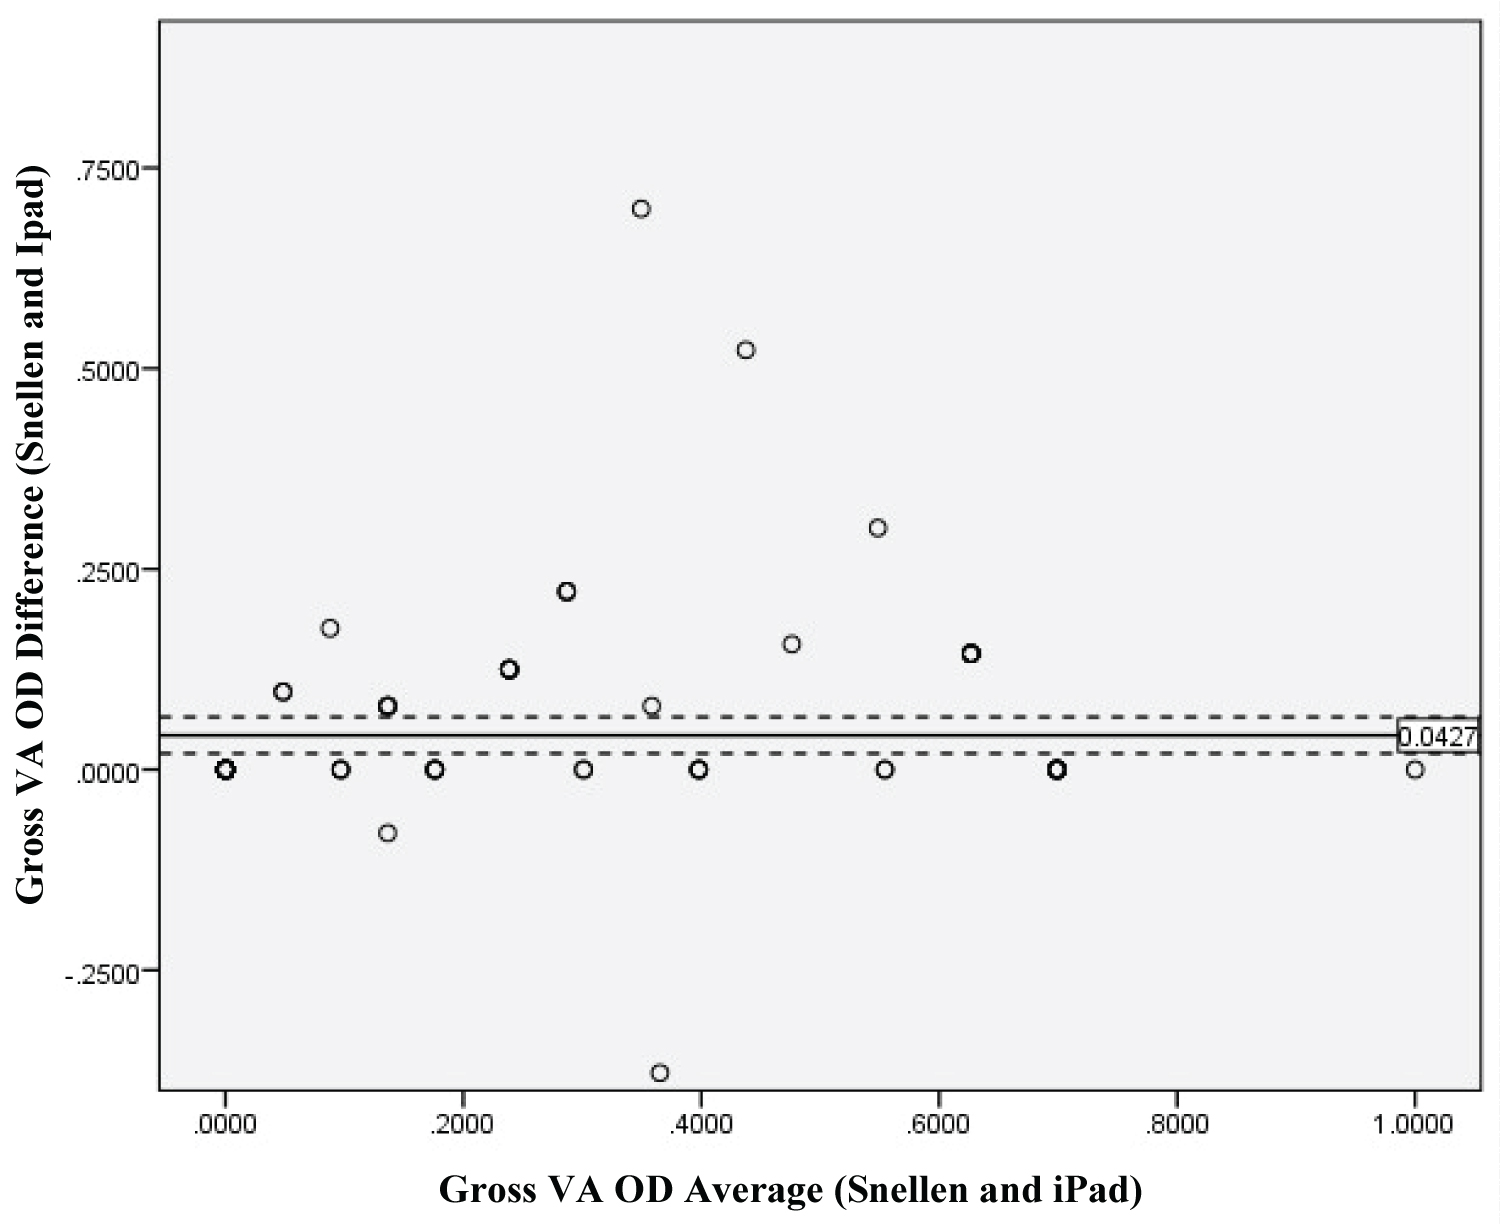 Figure 4: Gross VA OD Average and Difference between Snellen and iPad Mini 2 plotted in Bland Alman. The solid line refers to the main difference while the dotted lines represent the 95% CI lower limit and upper limit right of the mean difference. The light circle represents iPad VA and dark circles represents Snellen VA.
View Figure 4
Figure 4: Gross VA OD Average and Difference between Snellen and iPad Mini 2 plotted in Bland Alman. The solid line refers to the main difference while the dotted lines represent the 95% CI lower limit and upper limit right of the mean difference. The light circle represents iPad VA and dark circles represents Snellen VA.
View Figure 4
Table 2: Paired results from the two modalities. View Table 2
The results showed that the mean difference level of the CI between the two modalities tested in right eye is .0427. Thus, the iPad app when tested for visual acuity in the right eye is within agreement with traditional light-box Snellen Chart. As discussed, when the difference is not exceeded ± 1.96 SD the testing modality is within agreement (Figure 5).
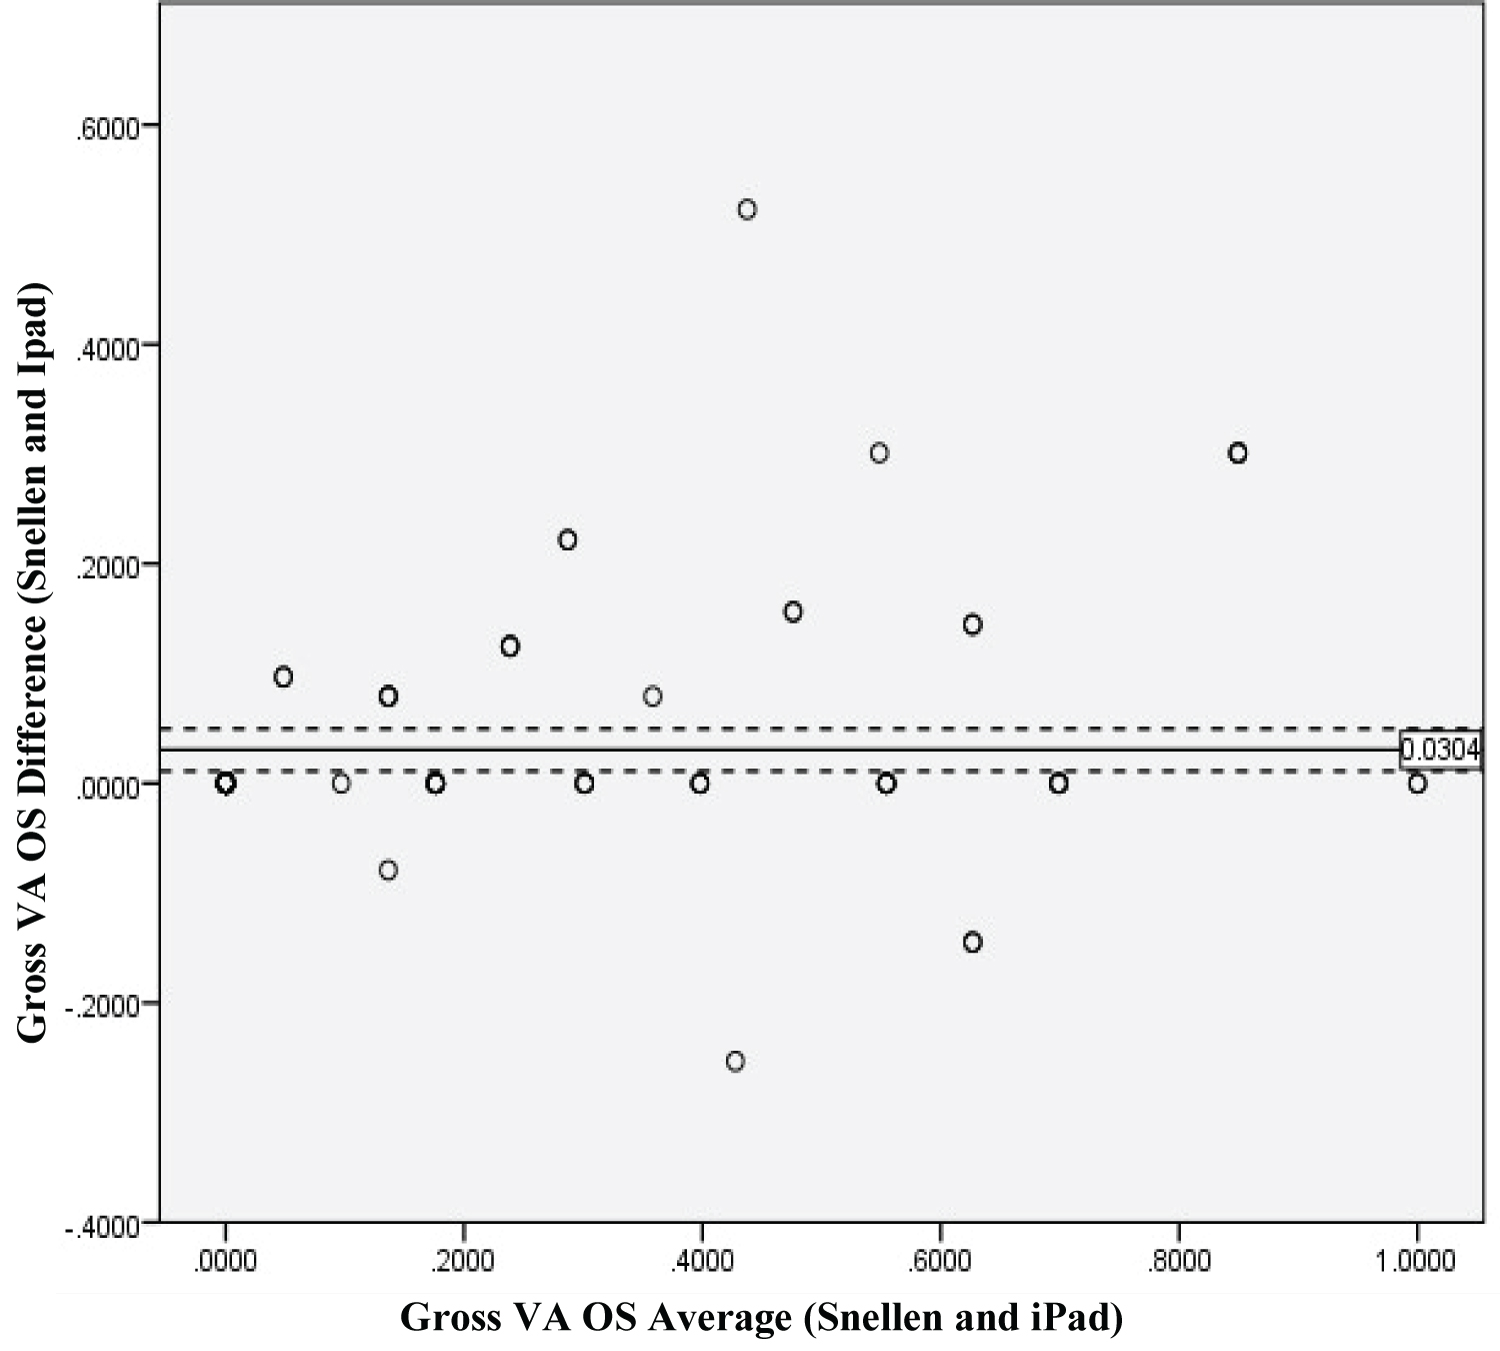 Figure 5: Gross VA OS Average and Difference between Snellen and iPad Mini 2 plotted in Bland Alman. The solid line refers to the main difference while the dotted lines represent the 95% CI lower limit and upper limit right of the mean difference. The light circle represents iPad VA and dark circles represents Snellen VA.
View Figure 5
Figure 5: Gross VA OS Average and Difference between Snellen and iPad Mini 2 plotted in Bland Alman. The solid line refers to the main difference while the dotted lines represent the 95% CI lower limit and upper limit right of the mean difference. The light circle represents iPad VA and dark circles represents Snellen VA.
View Figure 5
Results showed that the mean difference level of the CI between two modalities tested in left eye is 0.0304, hence, the iPad Mini 2 app when tested in the left eye for visual acuity is within agreement with traditional light-box Snellen Chart. As stated, when the difference does not exceeded ± 1.96 SD the two testing modalities are within agreement with each other (Figure 6).
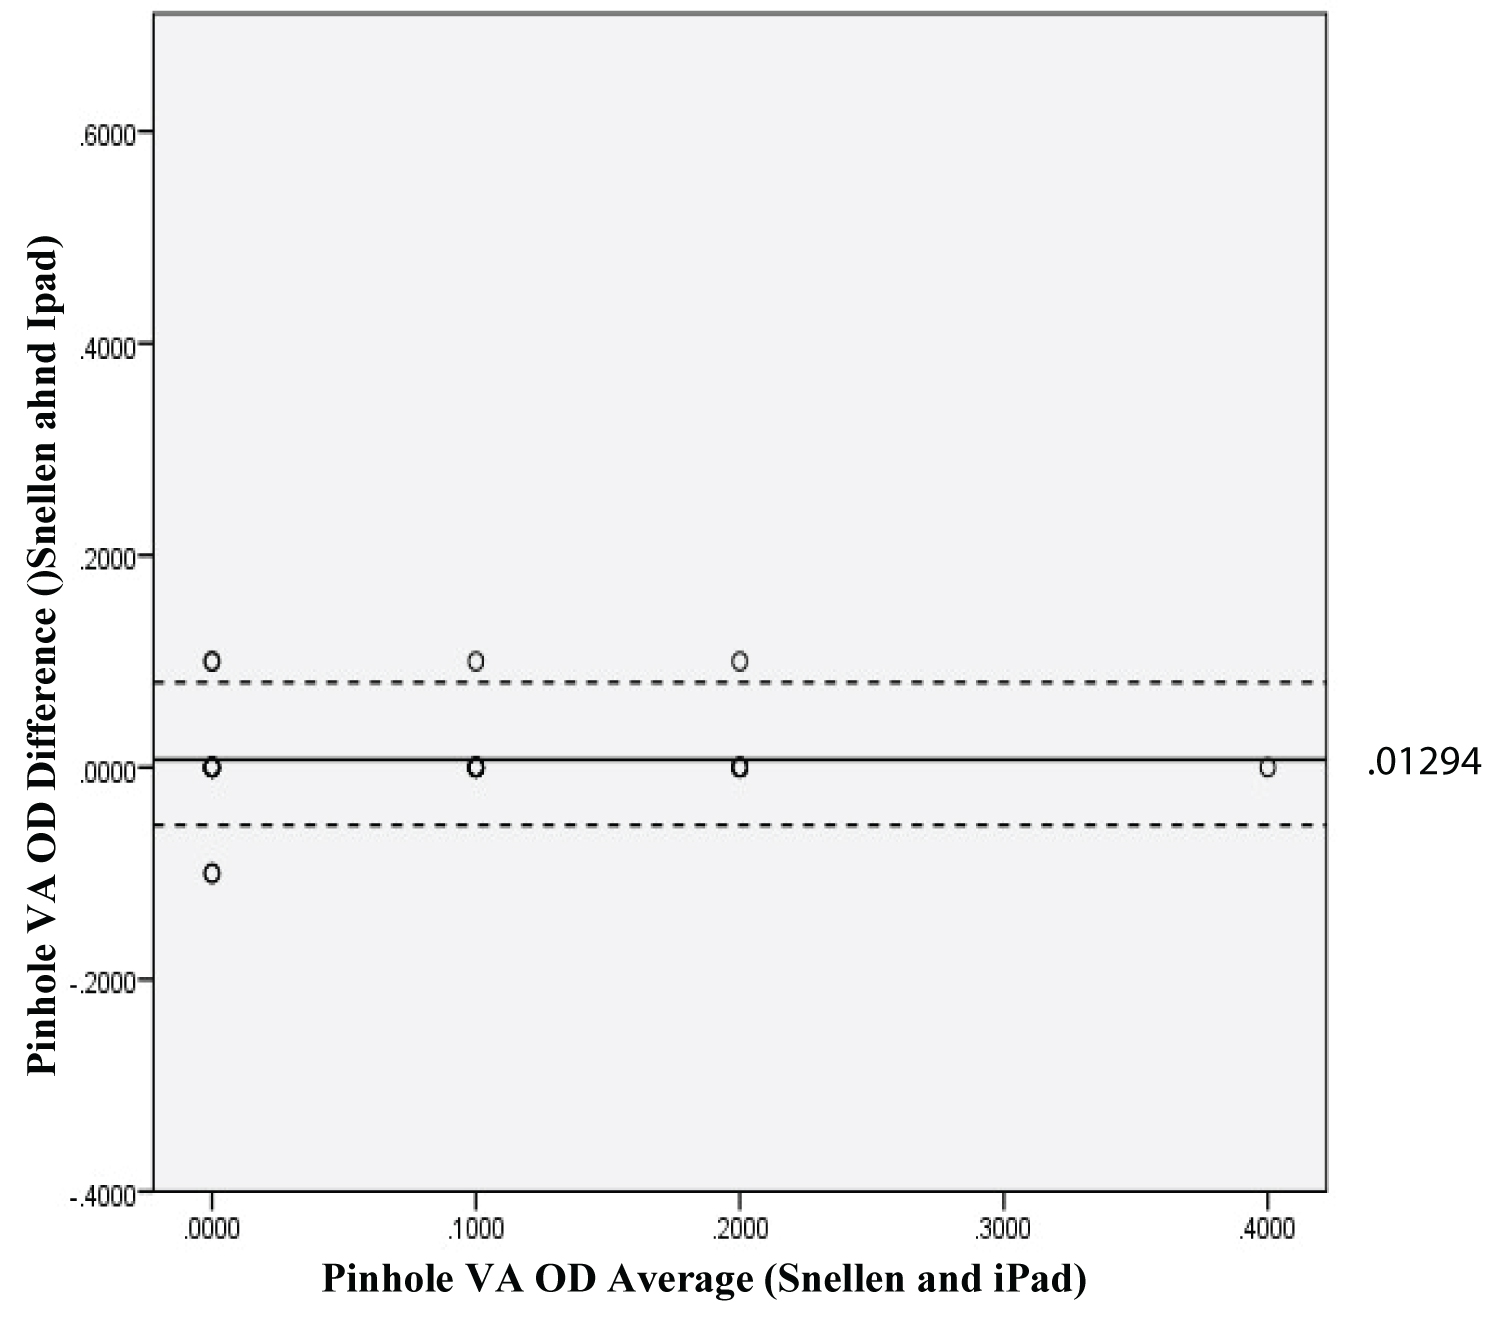 Figure 6: Pinhole VA OD Average and Difference between Snellen and iPad Mini 2 plotted in Bland Alman. The solid line refers to the main difference while the dotted lines represent the 95% CI lower limit and upper limit right of the mean difference. The light circle represents iPad VA and dark circles represents Snellen VA.
View Figure 6
Figure 6: Pinhole VA OD Average and Difference between Snellen and iPad Mini 2 plotted in Bland Alman. The solid line refers to the main difference while the dotted lines represent the 95% CI lower limit and upper limit right of the mean difference. The light circle represents iPad VA and dark circles represents Snellen VA.
View Figure 6
Results showed that the mean difference level of the CI between the two modalities tested in right eye using pinhole is 0.0129. Thus, the iPad Mini 2 app when tested in right eye for visual acuity using pinhole is within agreement with traditional light-box Snellen Chart. As stated, when the difference does not exceeded ± 1.96 SD the two testing modalities are within agreement with each other (Figure 7).
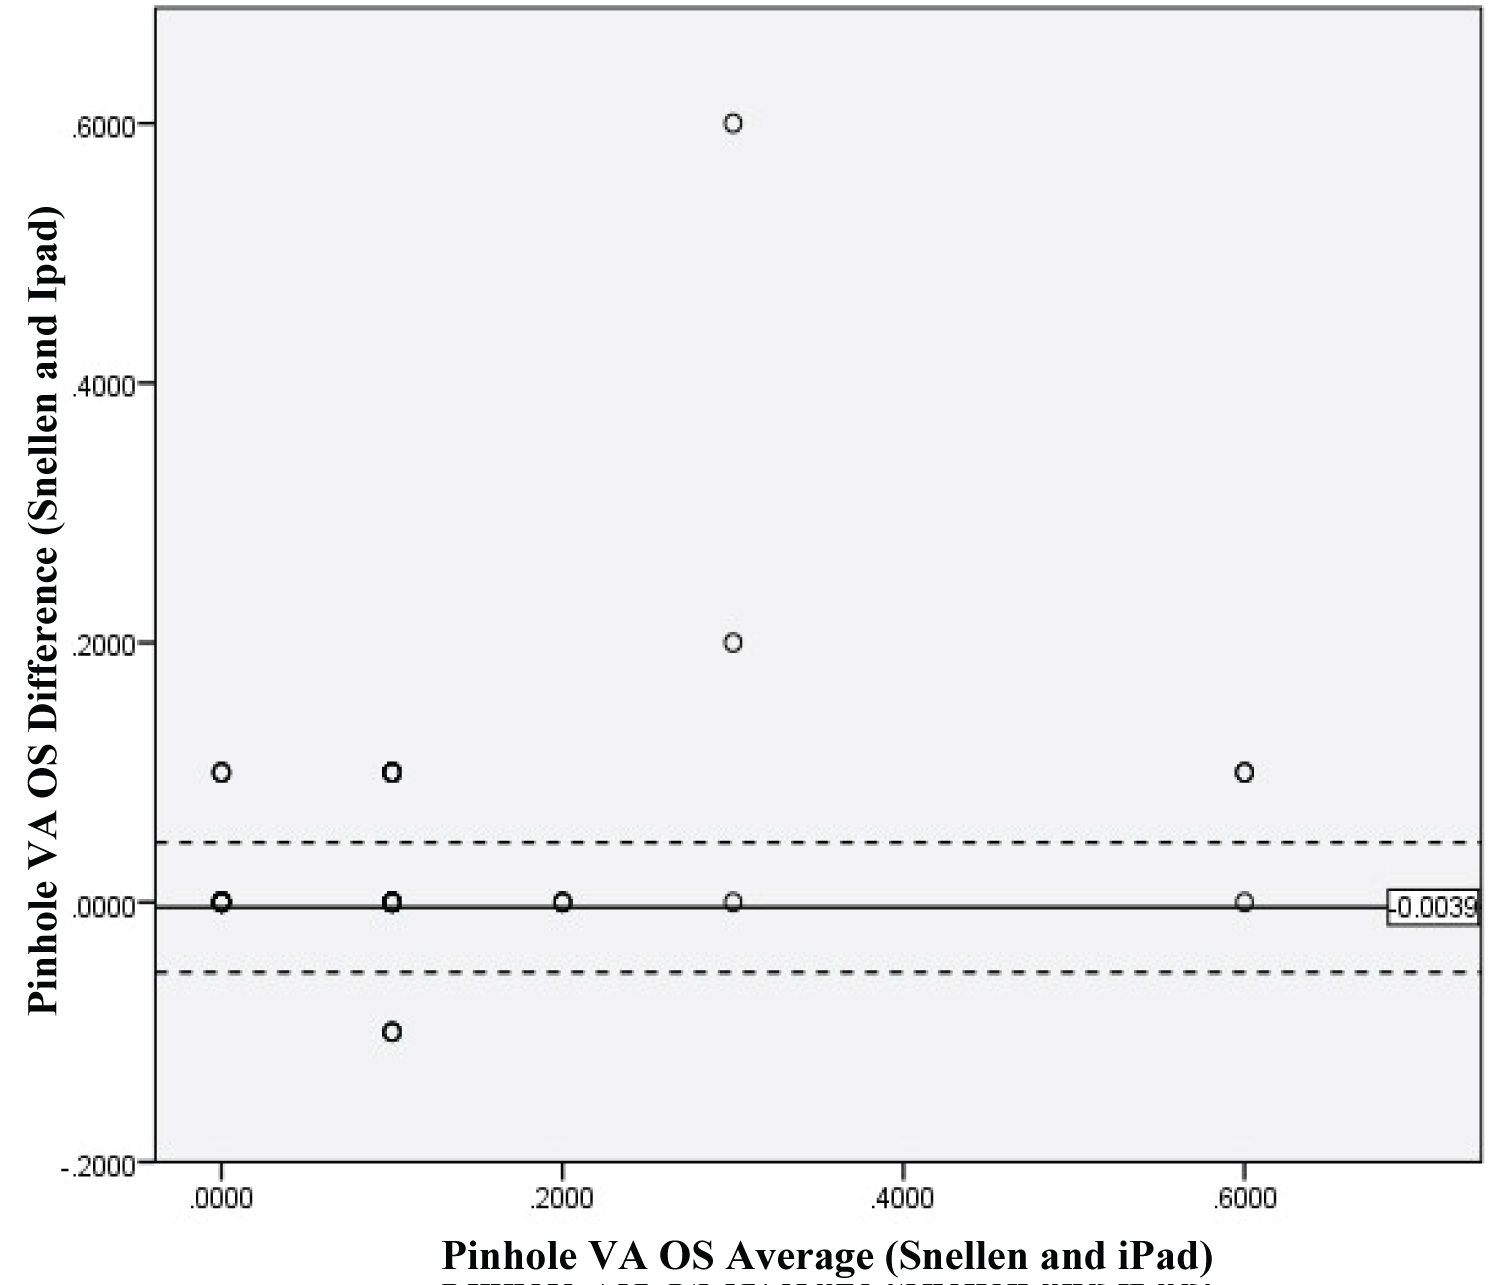 Figure 7: Pinhole VA OS Average and Difference between Snellen and iPad Mini 2 plotted in Bland Alman. The solid line refers to the main difference while the dotted lines represent the 95% CI lower limit and upper limit right of the mean difference. The light circle represents iPad VA and dark circles represents Snellen VA.
View Figure 7
Figure 7: Pinhole VA OS Average and Difference between Snellen and iPad Mini 2 plotted in Bland Alman. The solid line refers to the main difference while the dotted lines represent the 95% CI lower limit and upper limit right of the mean difference. The light circle represents iPad VA and dark circles represents Snellen VA.
View Figure 7
Results showed that the mean difference level of the CI between the two modalities tested in left eye using pinhole is -0.0039. Thus, the iPad Mini 2 app when tested in left eye with pinhole for visual acuity is within agreement with traditional light-box Snellen Chart. As stated, when the difference does not exceeded ± 1.96 SD the two testing modalities are within agreement with each other.
The assessment of visual acuity in the Outpatient Department using a traditional light-box Snellen Chart as compared to the Eye Chart HD app in an iPad Mini 2 showed that the app was in agreement with the traditional light-box Snellen Chart when tested in 100 participants. Moreover, testing the gross visual acuity of the participants on both the right and left eye also demonstrated confounders that may have affected the results. The first of which would be a patient-related factor in which the participant may have already memorized the traditional light-box Snellen Chart prior to their examination because the widespread and general use of the Snellen Chart in health facilities in the country. In contrary, the Eye Chart HD app in the iPad Mini 2 app can randomize the letters used in the visual acuity test, thereby giving the participants no room for memorization.
Despite of these factors, however, statistical analysis still showed a high level of agreement between the two testing modalities when participants took their visual acuity through pinhole, suggesting that the iPad app can be used as a substitute to our traditional light-box Snellen Chart.
These findings agree with the three published studies that also assessed the agreement between the traditional testing modalities and the iPad app, although two of these studies posed certain limitations. Zhang, et al. [1] stated that the visual acuity agreement between modalities is only accurate when visual acuity is better than 20/200 (6/60) in the participants. This study did not test beyond this as none of or participants had visual acuity of worse than 20/100 (6/30).
Another study suggested that the assessments could agree on the condition that glare was eliminated from iPad screen [3]. The iPad brightness setting in their study was set to the maximum level (100%), and after the first round of testing and analysis, the researchers decided a glare filter was required. In this study, the brightness setting was set at 75%. Interestingly, none of the participants raised the issue of glaring, suggesting that the ambient lighting conditions in the study may have been more favorable than in the previous study. In the Gounder, et al. (2014) study, the brightness level was set at 75%, and a glare filter was not required to obtain accurate visual acuity measurements [10].
It should be noted, however, that the apps used in this study is different from the previous studies mentioned above. In this study, it utilizes Eye Chart HD which is free to download at iTunes Store. The Eye Chart HD was chosen for the following reasons; (1) It can be downloaded for free at the iTunes Store, (2) The letters in can be arranged in random, (3) The set testing distance is at 1.5m, and (4) Stated inaccuracy percent is only at 20.2% [6] as compared to other free apps with inaccuracy percent of more than 30%.
This study demonstrated whether the iPad app can become a substitute tool for the traditional light-box Snellen Chart in testing visual acuity of patients. It showed that the results from Eye Chart HD app used in an iPad Mini 2 agreed with the results of the traditional light-box Snellen Chart when used at the Outpatient Department. In this modern-day era and with the advent of technology and software programs that are available, our work is made much easier, faster and more people are able to benefit to early screening of visual acuity, hence, making people more aware of the importance of taking care of their eyesight and monitoring of its status on a regular basis. However, there is no substitute for formal eye check-up done by the certified ophthalmologists.
This study may serve as a springboard to other studies seeking to gain more knowledge on the use of modern-day technology to improve the efficiency and convenience of visual acuity testing. Moreover, we recommend the use of a greater number of participants, exploring the use of paid apps, and controlling the luminous intensity of the iPad Mini 2 and the traditional light-box Snellen Chart to ensure that luminous intensity of each test modality does not affect the validity of the outcome or results of the study.