Background: The right and left sides of the heart are very similar in terms of structural components; however, they vary in their size, thickness, function and response to acute pathologic processes.
Objectives: Emergency physicians should be able to differentiate the right ventricle (RV) and left ventricle (LV) based on anatomic differences regardless of probe indicator orientation, image settings on the machine or normal versus pathological state.
Discussion: Understanding of RV size, as well as septal and free wall motion can be beneficial in the diagnosis of pathologic process that affect RV pressure or volume and RV free wall thickness can give information about the chronicity of disease. Finally, TAPSE can give a quantitative measure to estimate RV function.
Conclusions: Although most efforts utilizing echocardiography in the emergency department setting focus on the pericardium and the function of the LV, understanding of the structure and function of the RV can give a more complete picture and only add to the emergency physicians understanding of the hemodynamics of the acutely ill, symptomatic patient in their care.
Bedside ultrasound, Echocardiography, Right ventricle, McConnell's Sign, TAPSE
The right and left sides of the heart are very similar in terms of structural components; however, they vary in their size, thickness, function and response to acute pathologic processes. Emergency physicians should be able to differentiate the right ventricle (RV) and left ventricle (LV) based on anatomic differences regardless of probe indicator orientation, image settings on the machine or normal versus pathological state.
Understanding of RV size, as well as septal and free wall motion can be beneficial in the diagnosis of pathologic process that affect RV pressure or volume and RV free wall thickness can give information about the chronicity of disease. Finally, TAPSE can give a quantitative measure to estimate RV function.
In this article, by explaining some simple to perform assessments of the RV, we hope to add to the emergency physicians understanding of the hemodynamics of the acutely ill, symptomatic patient in their care.
The right and left sides of the heart are very similar in terms of structural components. Both contain an atrioventricular valve, a semilunar outflow valve, and smooth and muscular parts. Echocardiographically, several differences can be noted, and these may be useful when differentiating the two sides of the heart in ambiguous cases (e.g., congenital heart disease, elevated right heart pressures). Furthermore, given differences in the orientation used in the sonographic settings of the cardiologists and some emergency medicine physicians, novice sonographers may be confused by which ventricle appears on which side of the screen. It is good practice to look for the differences in the ventricles that will be described every time an echocardiographic video clip is evaluated to avoid this confusion. The primary difference between the right and left sides of the heart is muscle wall thickness. The muscle of the left ventricle is 2-3 times thicker than that of the right, although the size of the cavities are approximately the same. This difference can be appreciated in all the cardiac sonographic windows. Even in cases of chronically elevated pulmonary artery pressures, hypertrophy of the right ventricle (RV) will not reach the wall thickness of the left ventricle (LV). Regarding ventricular size, the apical 4 chamber view is the view most commonly used to assess relative chamber volume. In this view, the right ventricular width should not be larger than 2/3 of the left ventricular width (Figure 1). In cases of elevated pulmonary artery pressures, the (RV) can dilate, in some cases, larger than the volume of the LV. For this reason, ventricular wall thickness as opposed to ventricular volume should be used for differentiation.
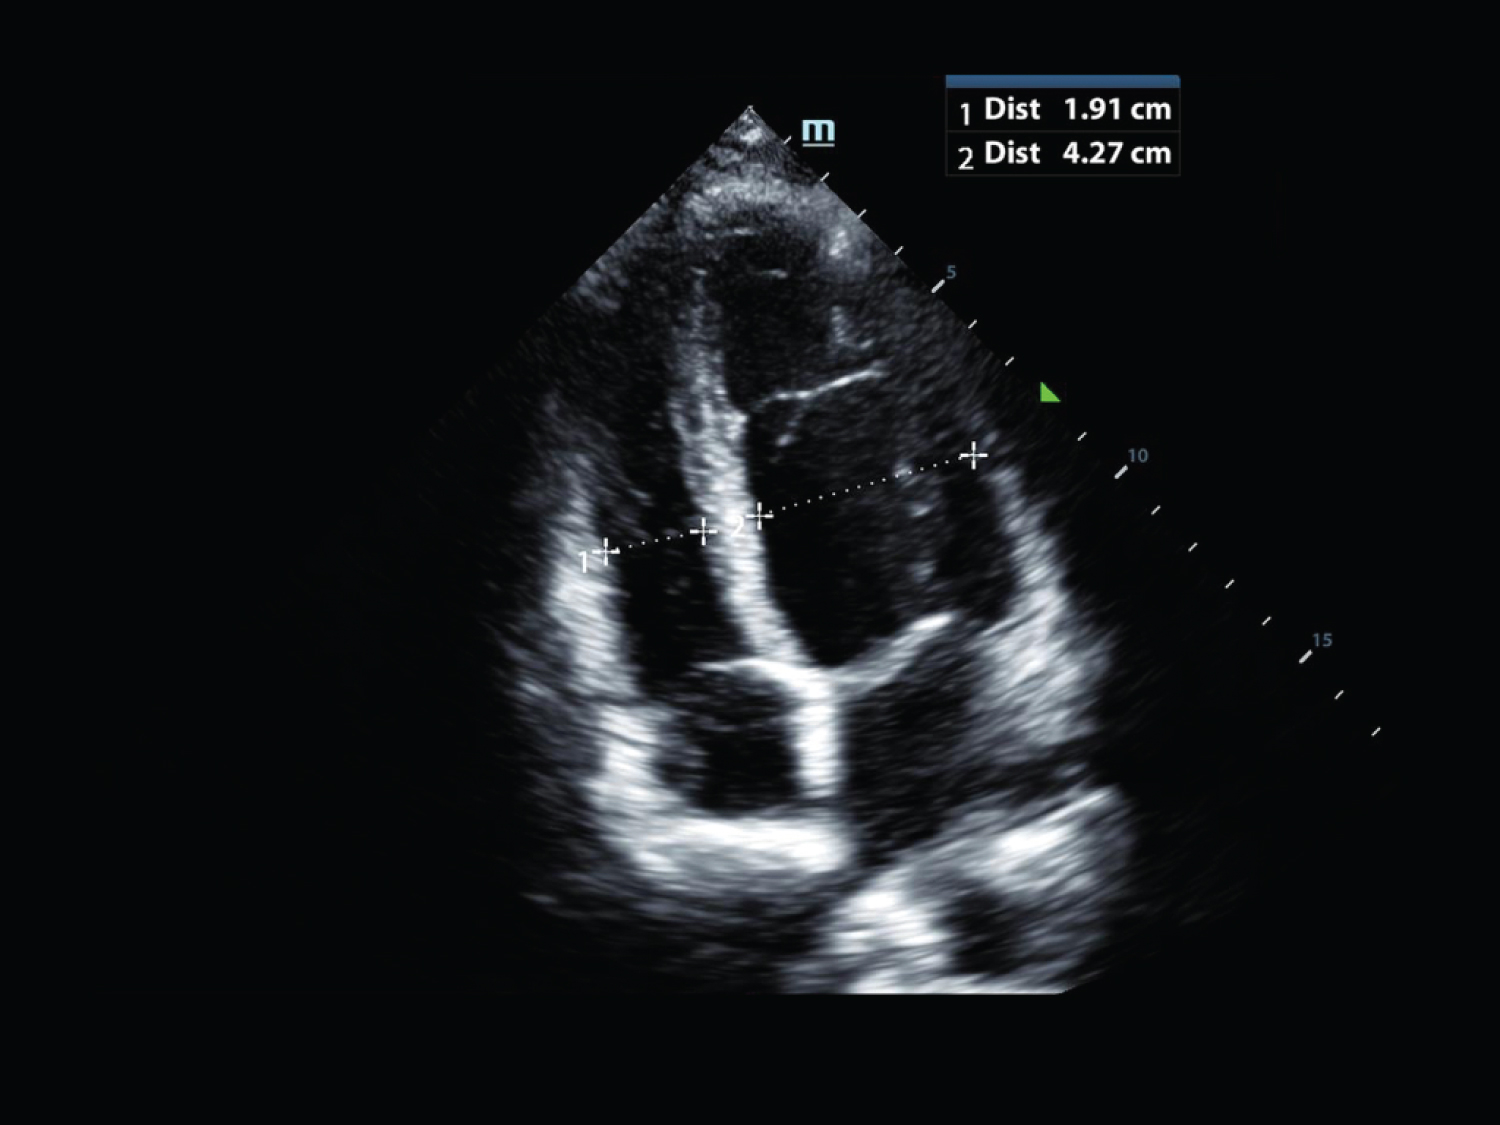 Figure 1: Apical 4 chamber image demonstrating that the width of the right ventricle should be approximately 2/3 of the width of the left ventricle. View Figure 1
Second, there is a difference in the position of the two atrioventricular valves. The tricuspid valve sits in the ventricle a few millimeters apical of the mitral valve. This is best appreciated in the apical 4 chamber view. (Figure 2). As a caveat, the congenital heart disease Ebstein's anomaly includes an abnormally formed tricuspid valve with the valve positioned more apically than normal in the RV. Although this defect is usually detected due to an auscultated murmur in infancy, some of the milder forms may not present with shortness of breath and fatigue until early adulthood.
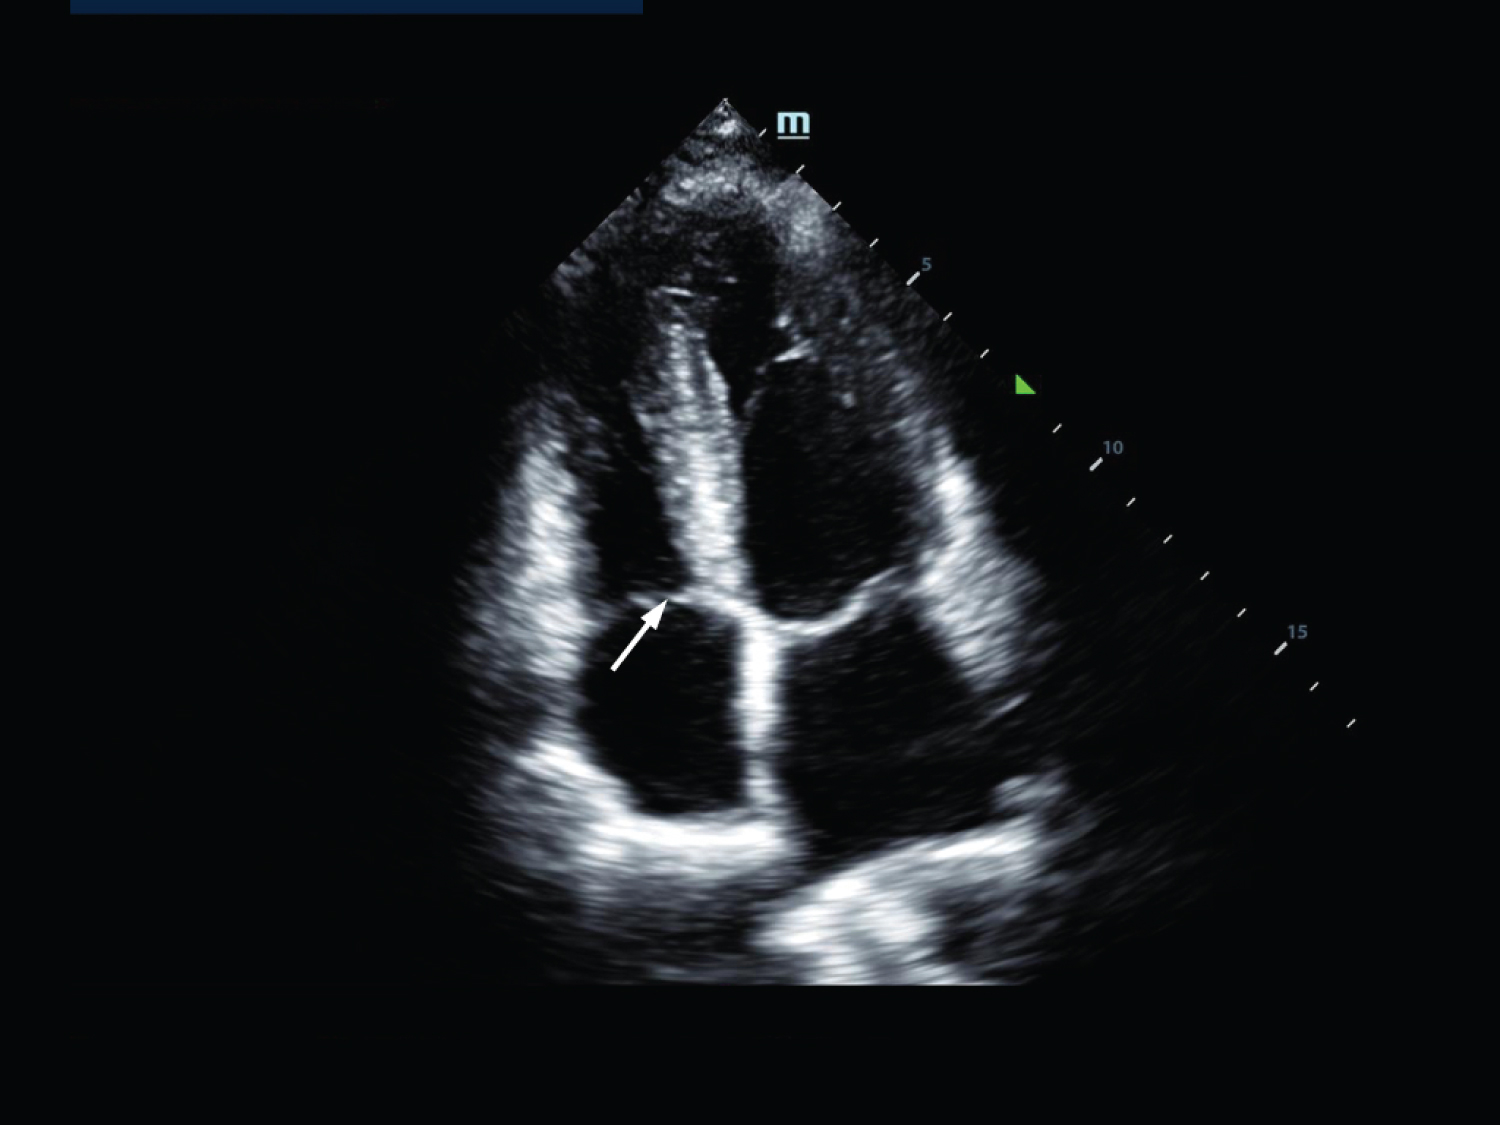 Figure 2: Apical 4 chamber view demonstrating that the tricuspid valve (arrow) sits in the ventricle a few millimeters apical of the mitral valve. View Figure 2
Third, RV contains the moderator band, also called the septomarginal trabecula. It connects the intraventricular septum to the anterior papillary muscle (Figure 3). It is visualized crossing the lower portion of the right ventricular chamber. It primarily acts as a conduction path to the right ventricular free wall from the right bundle branch of the ventricular conducting system.
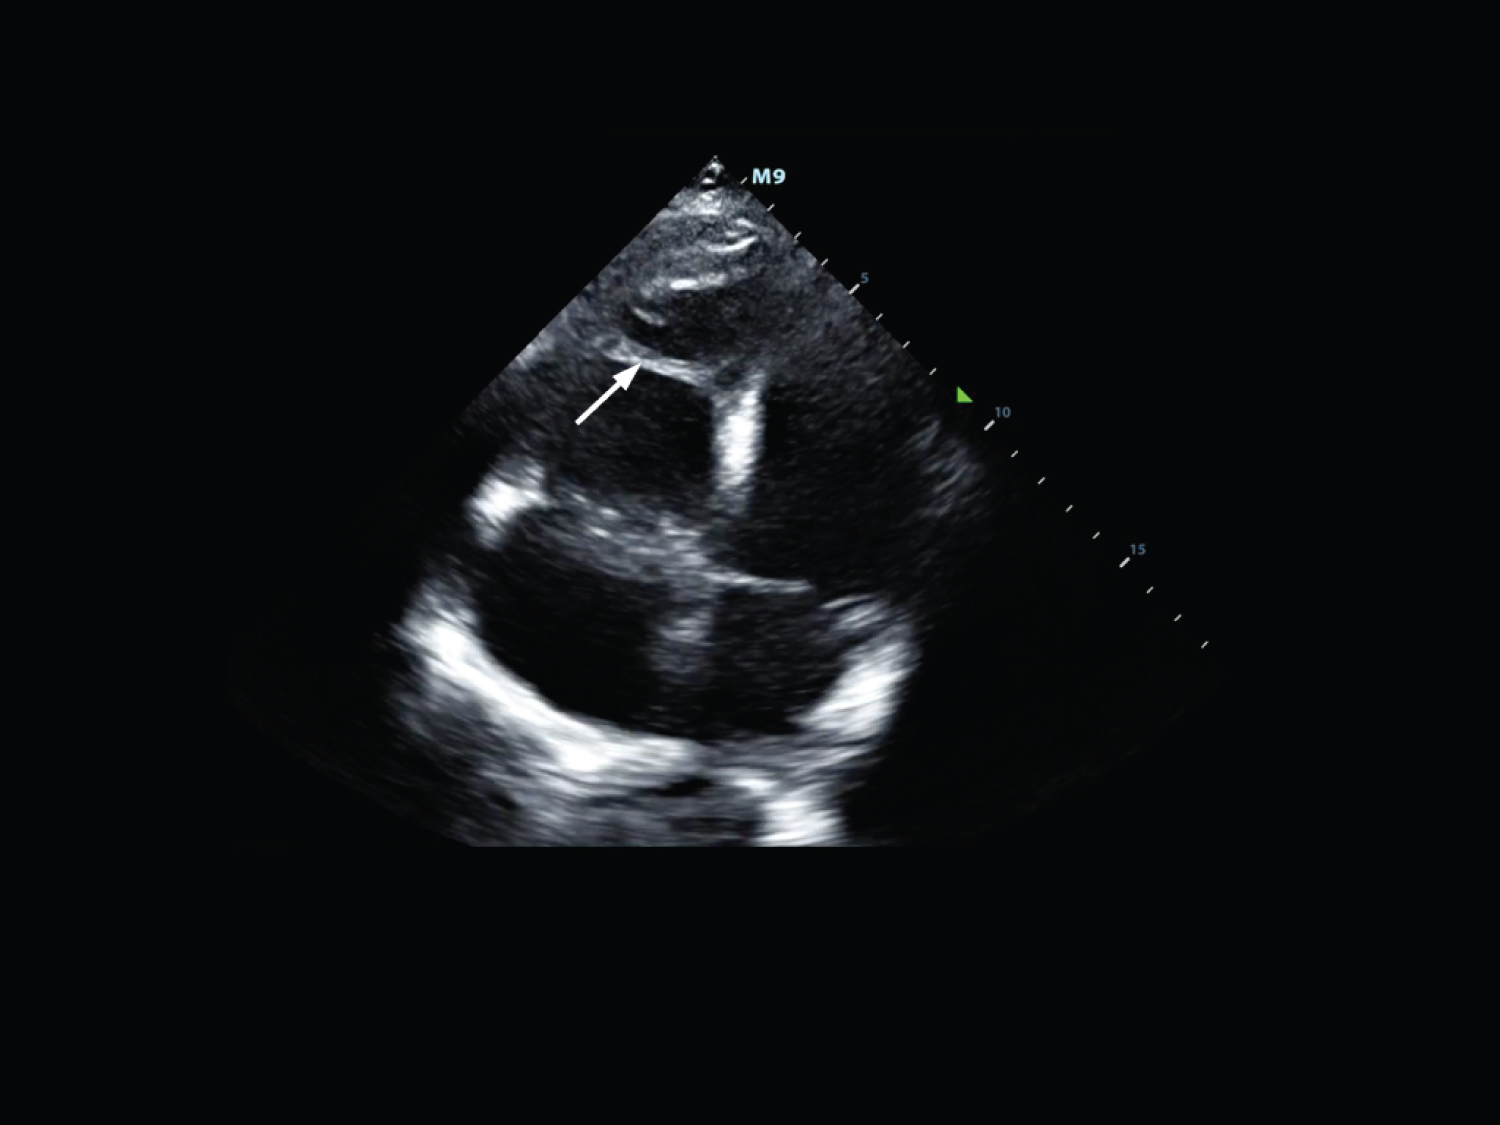 Figure 3: Apical 4 chamber view demonstrating the moderator band (arrow) contained within the right ventricle. View Figure 3
In addition to understanding the anatomy, mastering sonography of the RV requires a fundamental knowledge of its physiology. The RV functions to propel blood into the pulmonary circulation-a low-pressure system-and so, the interventricular septum is normally seen "bowing" with convexity into the RV during systole due to the inherently higher pressures of the LV.
Since the RV is intimately related to the impedance of the pulmonary vascular bed, acute pathologic increases in pulmonary vascular pressures can lead to rapid alterations of the normal pressure-volume relationship resulting in sonographic RV dilatation. As previously mentioned, the RV is smaller than the LV with a normal RV:LV size ratio no greater than 2/3. Despite a lack of substantial quantitative volume data, qualitatively, an RV:LV size ratio of 1:1 or higher signifies an abnormal increase in right sided heart pressures, such as from a pulmonary embolus (PE) or exacerbation of obstructive pulmonary disease (Figure 4).
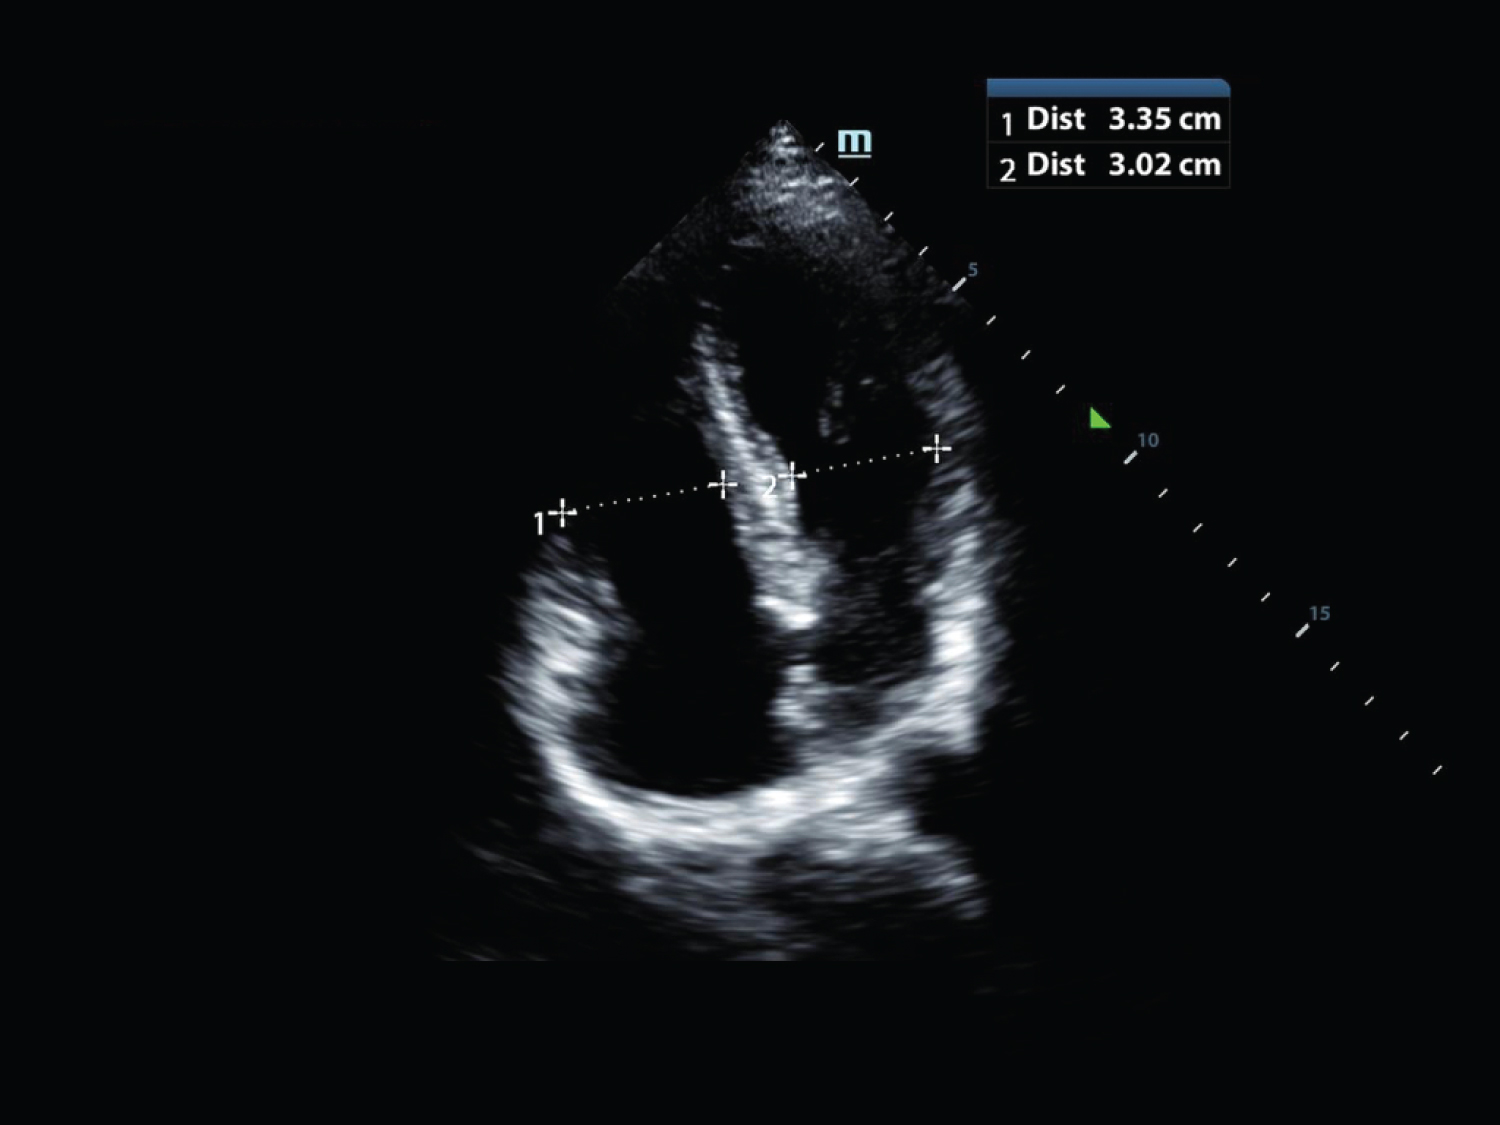 Figure 4: Apical 4 chamber view demonstrating an RV:LV size ratio of greater than 1:1 suggesting elevated right sided heart pressure. View Figure 4
In patients with a diagnosis of PE, the presence of RV dilatation on bedside echocardiography is correlated with increased morbidity due to RV dysfunction, RV failure, pulmonary hypertension, and likely recurrent emboli. Mortality from PE can occur swiftly-as in massive pulmonary embolism-or more gradually from chronic RV strain and failure as noted above. Thus, rapid assessment of RV:LV size using focused bedside echocardiography can be used by emergency physicians to guide the prompt administration of thrombolytics in patients with suspected massive PE or to assist in determining disposition level of care in patients with sub-massive PE, who demonstrate RV dilatation without clinical hemodynamic compromise.
In a recent study, 4 emergency sonographers with various training levels prospectively enrolled 146 patients with a high clinical suspicion for the diagnosis PE to assess the sonographic diagnostic characteristics of RV dilatation [1]. They used the apical 4 chamber view to qualitatively measure RV size and found that RV dilatation carried a sensitivity of 50%, specificity of 98%, a positive predictive value of 88% and negative predictive value of 88%. Positive and negative likelihood ratios were calculated as 29 and 0.51, respectively. The authors' conclusion was that for patients with a moderate to high pretest probability of PE, RV dilatation on bedside echocardiography should strongly lead the clinician to consider the initiation of anticoagulation prior to definitive testing when not contraindicated.
The shape and position of the interventricular septum throughout the cardiac cycle offers another valuable tool for the emergency physician when comparing the RV to the LV. Normally, the septum is concave, with its convexity directed towards the RV due to higher pressures in the LV both in systole and diastole. Therefore, as might be expected conditions that alter the pressure differential between the RV and LV, such as rapid elevations in the resistance of pulmonary circulation (e.g., PE, exacerbations of obstructive pulmonary disease) can result in displacement of the interventricular septum towards the LV as the pressure in the RV rises. This septal motion results in the characteristic septal flattening or "D sign" on the parasternal short axis view seen in conditions that elevate RV pressure or volume (Figure 5). Investigation of interventricular septal shape and motion throughout the cardiac cycle demonstrated a distinction between conditions of RV pressure versus volume overload. In volume overload with the absence of elevated right-sided systolic pressures, the interventricular septum will flatten only in diastole, whereas, in conditions of pressure overload (e.g. massive or sub-massive PE), it will remain displaced toward the left throughout the cardiac cycle.
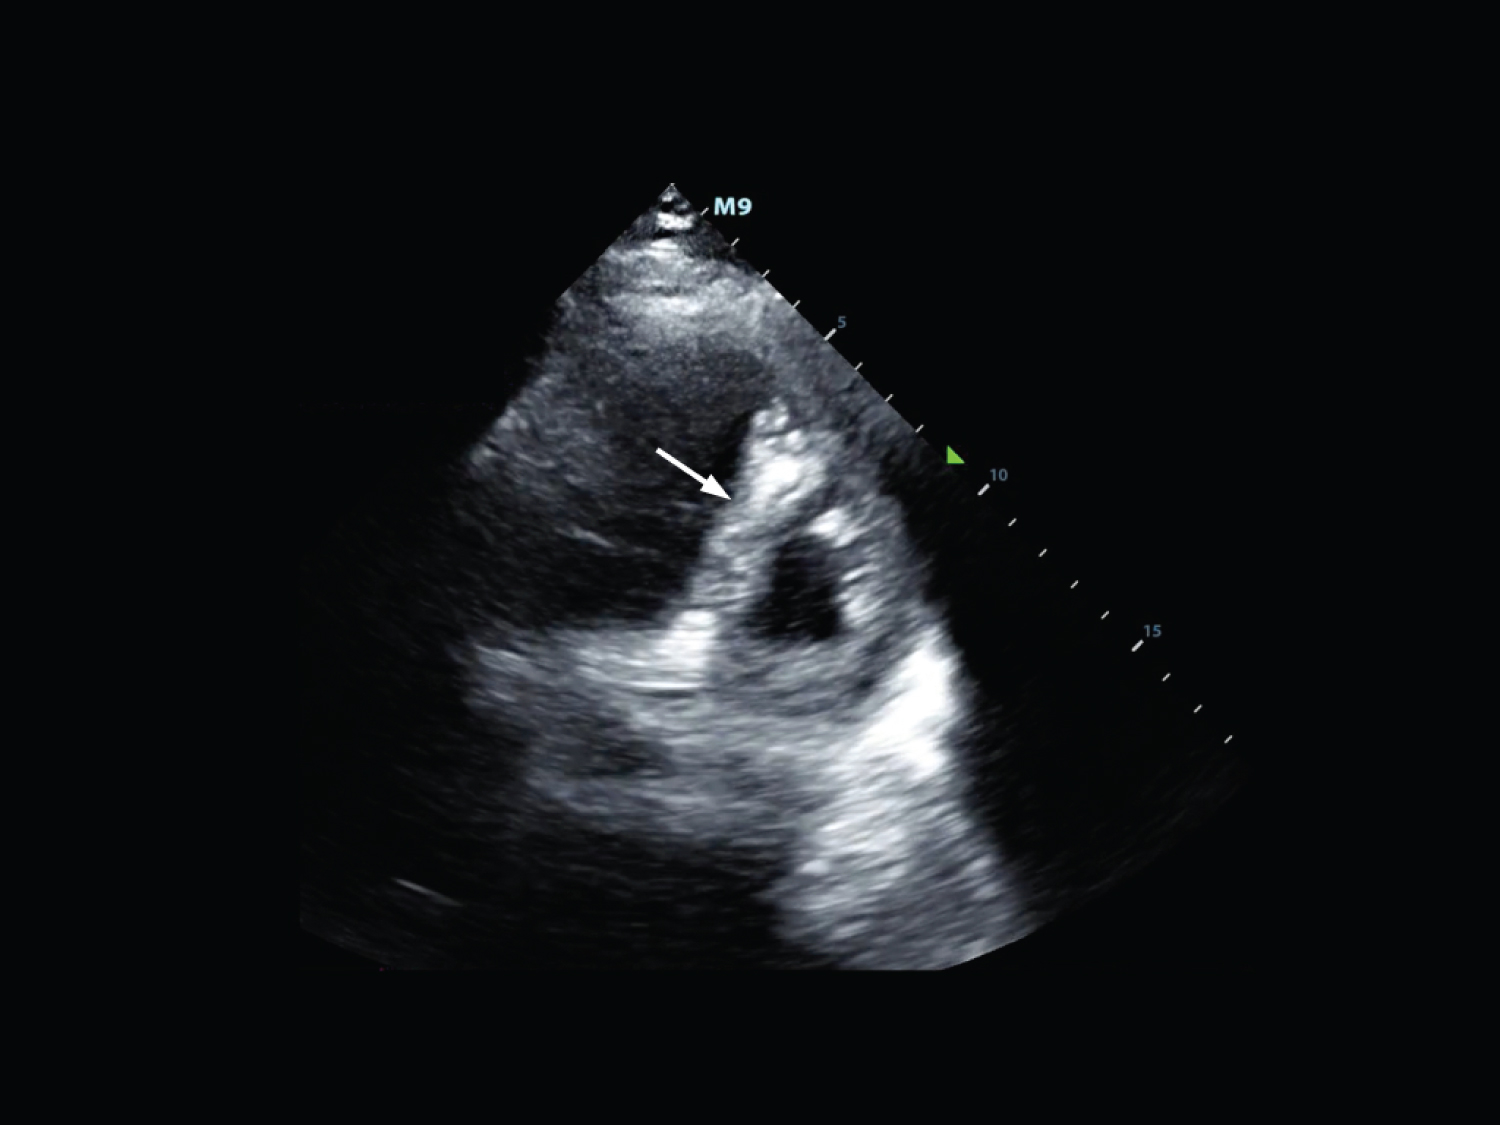 Figure 5: Parasternal short axis view demonstrating septal flattening (arrow) or the "D sign" seen in conditions that elevate right ventricular pressure or volume. View Figure 5
The size and shape of the RV are important in its evaluation, but an estimation of its function and contraction is invaluable to the treating provider. It should be noted that this type of evaluation of RV function is subjective and operator dependent and should be used in conjunction with other methods of RV evaluation. Qualitative evaluation of RV function when used alone has been shown to be insensitive when compared to magnetic resonance imaging (MRI) and to have poor inter-rater reliability [2,3].
The contraction pattern of the RV is simpler than the left ventricle as it mainly contracts in only the longitudinal plane from the base (adjacent to the tricuspid valve) towards the apex of the ventricle. Evaluation of the movement of the tricuspid valve annulus towards the apex of the right ventricle can be used to assess RV contractility. Gross visual estimation of this movement without measurement is possible but the process of quantifying this will be discussed in the next section.
McConnell's sign is described as a hypokinesis of the right ventricular free wall with sparing of RV apical function [4]. Several theories have been proposed as to why this phenomenon occurs. In one, the apex of the RV is thought to appear normokinetic because it is tethered to the apex of a normal or hyperdynamic left ventricle. A second theory is that the RV may change in shape to equalize regional wall stress caused by the increased pulmonary artery pressure. Third, PE may lead to preferential regional ischemia of the RV free wall compared to the apex for unclear reasons. McConnell's sign is not a sensitive finding for PE, but when visualized, was distinctive and strongly suggestive of massive pulmonary embolism [5].
Tricuspid regurgitation can occur with elevated pulmonary artery and/or right ventricular systolic pressures. In the apical four-chamber view, color doppler is placed over the tricuspid valve and allows visualization of a regurgitant jet if present. A regurgitant jet is required to calculate pulmonary artery systolic pressure. For this measurement, continuous wave Doppler is used to determine the peak tricuspid regurgitant velocity (V), then the modified Bernoulli equation (P = 4V2) can be applied to determine P (the pressure gradient between the right atrium and RV). An estimate of right atrial pressure is then added to calculate pulmonary artery systolic pressure. Of note, most estimates of right atrial pressure are performed utilizing the hemodynamics of the inferior vena cava (IVC) which is known to be error prone [6].
Although a complete discussion on the sonographic evaluation of the inferior vena cava would be outside of the scope of this article, it may be a useful adjunct for a gross estimation of RV function. If the IVC is found to be plethoric or have minimal variation in size with the respiratory cycle, this could be caused by right-sided heart failure. However, this can also be caused by any process that impedes venous return to the RV e.g. cardiac tamponade or tension pneumothorax.
Of note, visualization of a thrombus in transit has also been described. Clot locations may include the inferior vena cava, right atrium, right ventricle, or the pulmonary artery and its main branches. Lack of appreciation of a clot should not be used to rule out the diagnosis.
To date, three-dimensional echocardiography is not readily available in the emergency department setting. It has been used by cardiologists to evaluate RV function and when compared to MRI, has been shown to underestimate RV volume [7]. Despite its limitations, three-dimensional echocardiography may be a future tool for RV evaluation in the emergency department setting.
Measurement of RV free wall thickness can identify hypertrophy as a result of long standing elevated pulmonary vascular resistance or chronically increased afterload such is in left sided heart failure. RV wall thickness can also be increased in infiltrative and hypertrophic cardiomyopathies. This measurement is useful to distinguish acute RV strain from a chronic RV hypertrophy.
Normal RV wall thickness measures 5 mm or less. This measurement is obtained in the subcostal cardiac view at end-diastole (when the RV is most relaxed) at the level of the tip of anterior tricuspid valve leaflet (Figure 6). At this point the ultrasound beam is most perpendicular to the wall and will yield the most accurate measurement. It is important to exclude papillary muscles, trabeculations and epicardial fat when obtaining the measurement to avoid overestimation. Zooming in on the area of interest and using fundamental imaging without tissue harmonics can help improve accuracy. B-mode or M-mode imaging can be used. M-mode may assist by demonstrating when the anterior tricuspid leaflet is the most open (end-diastole) and the wall measurement can be taken at that point. If the subcostal view cannot be obtained, the parasternal long axis view may be used as an alternative.
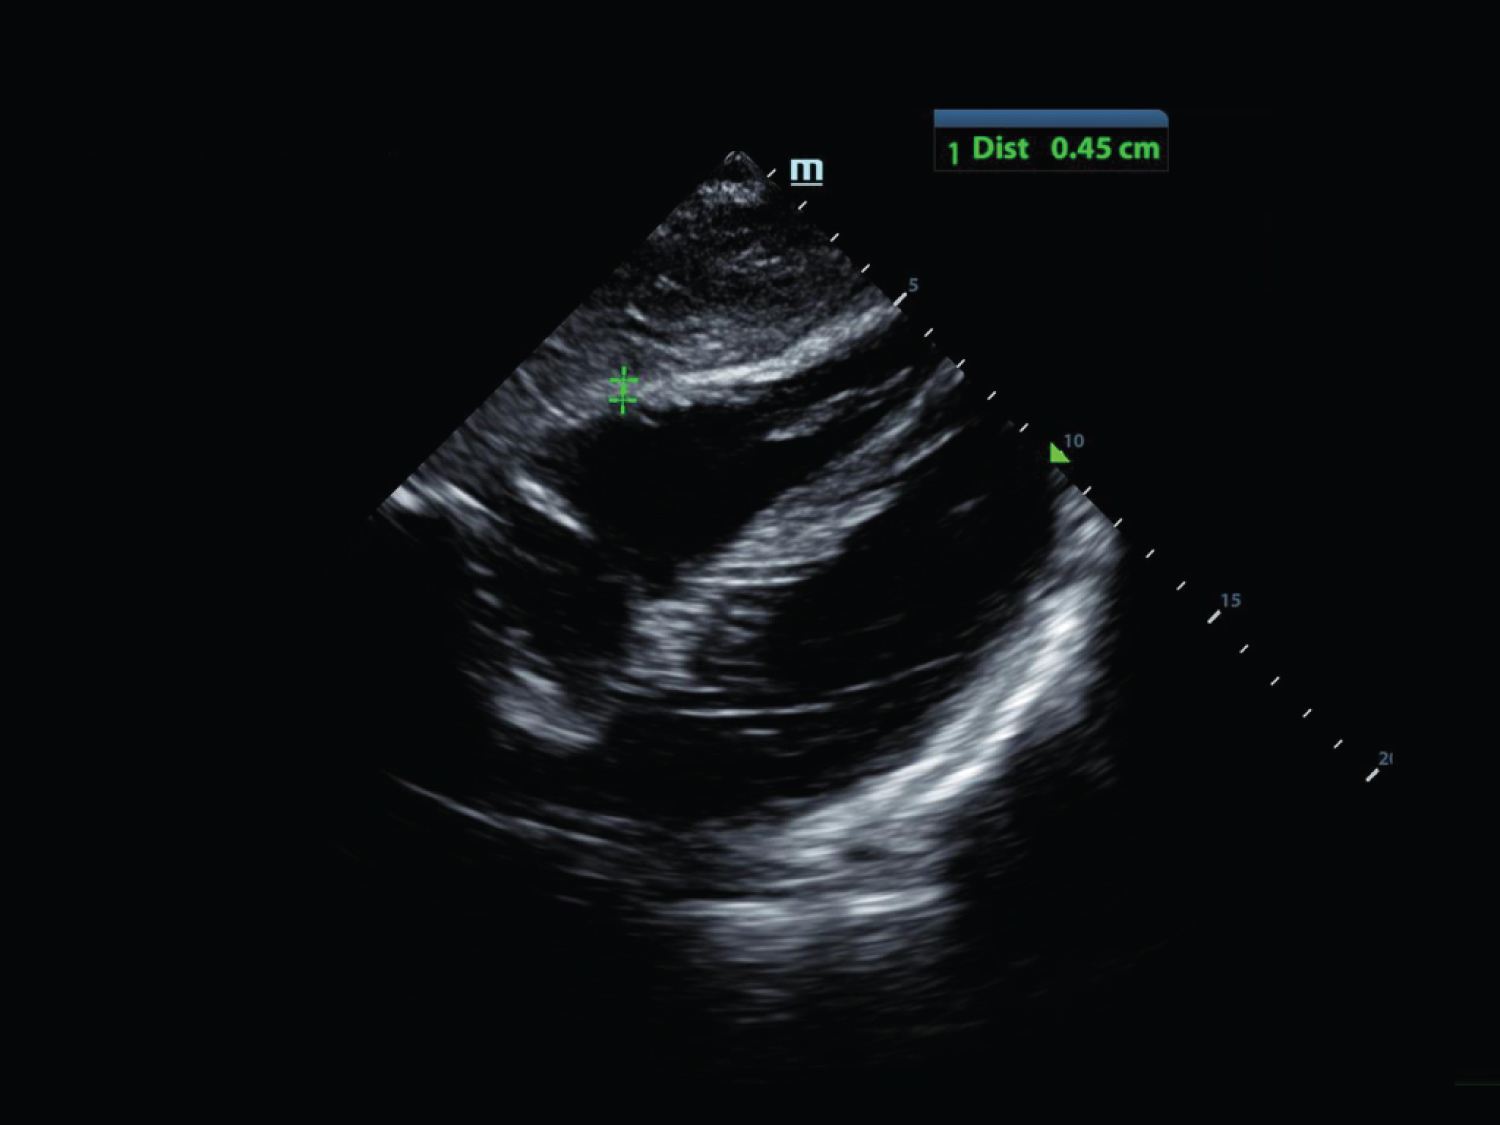 Figure 6: Subcostal cardiac view at end-diastole (when the RV is most relaxed) with measurement of the right ventricular free wall. View Figure 6
For the emergency physician, RV wall measurement is most helpful to differentiate states of acute right-heart strain from a chronic condition. In a normal heart, the RV has a thin wall relative to the LV and is compliant. It will initially respond to increased pulmonary artery pressures (such as in acute PE) by dilating. Thus in a previously healthy patient with acute sub-massive or massive pulmonary embolism, a dilated RV will be noted with an RV wall thickness at or < 5 mm. Eventually, if RV pressures remain elevated (e.g. pulmonary hypertension, chronic PE), hypertrophy develops.
RV free wall thickness does not have a minimum cut off value. There are certain conditions, such as Uhl anomaly and arrhythmogenic RV cardiomyopathy that are associated with RV free wall thinning.
Tricuspid annular plane systolic excursion (TAPSE) is another quantitative method for assessing RV systolic function. TAPSE has been shown to have a high correlation with RV ejection fraction on radionuclide angiography and cardiac MRI [8,9]. Although the RV is a geometrically complex structure, most of its systolic function comes from the longitudinal contraction of the base to the apex [10]. This allows RV systolic function to be accurately assessed by a single measurement, TAPSE.
TAPSE is measured by placing the M-Mode cursor over the lateral border of the tricuspid annulus in the apical four chamber view (Figure 7). M-Mode produces a tissue depth (y-axis) versus time (x-axis) tracing and TAPSE is the amplitude of this waveform (Figure 8). It is important to maintain a clear view of the RV free wall throughout the cardiac cycle. Dropout of the RV free wall can result in an incorrect TAPSE measurement and therefore an incorrect assessment of RV function. Historically, 17 mm has been used as the lower limit of normal for TAPSE and lower values indicate reduced RV systolic function [10].
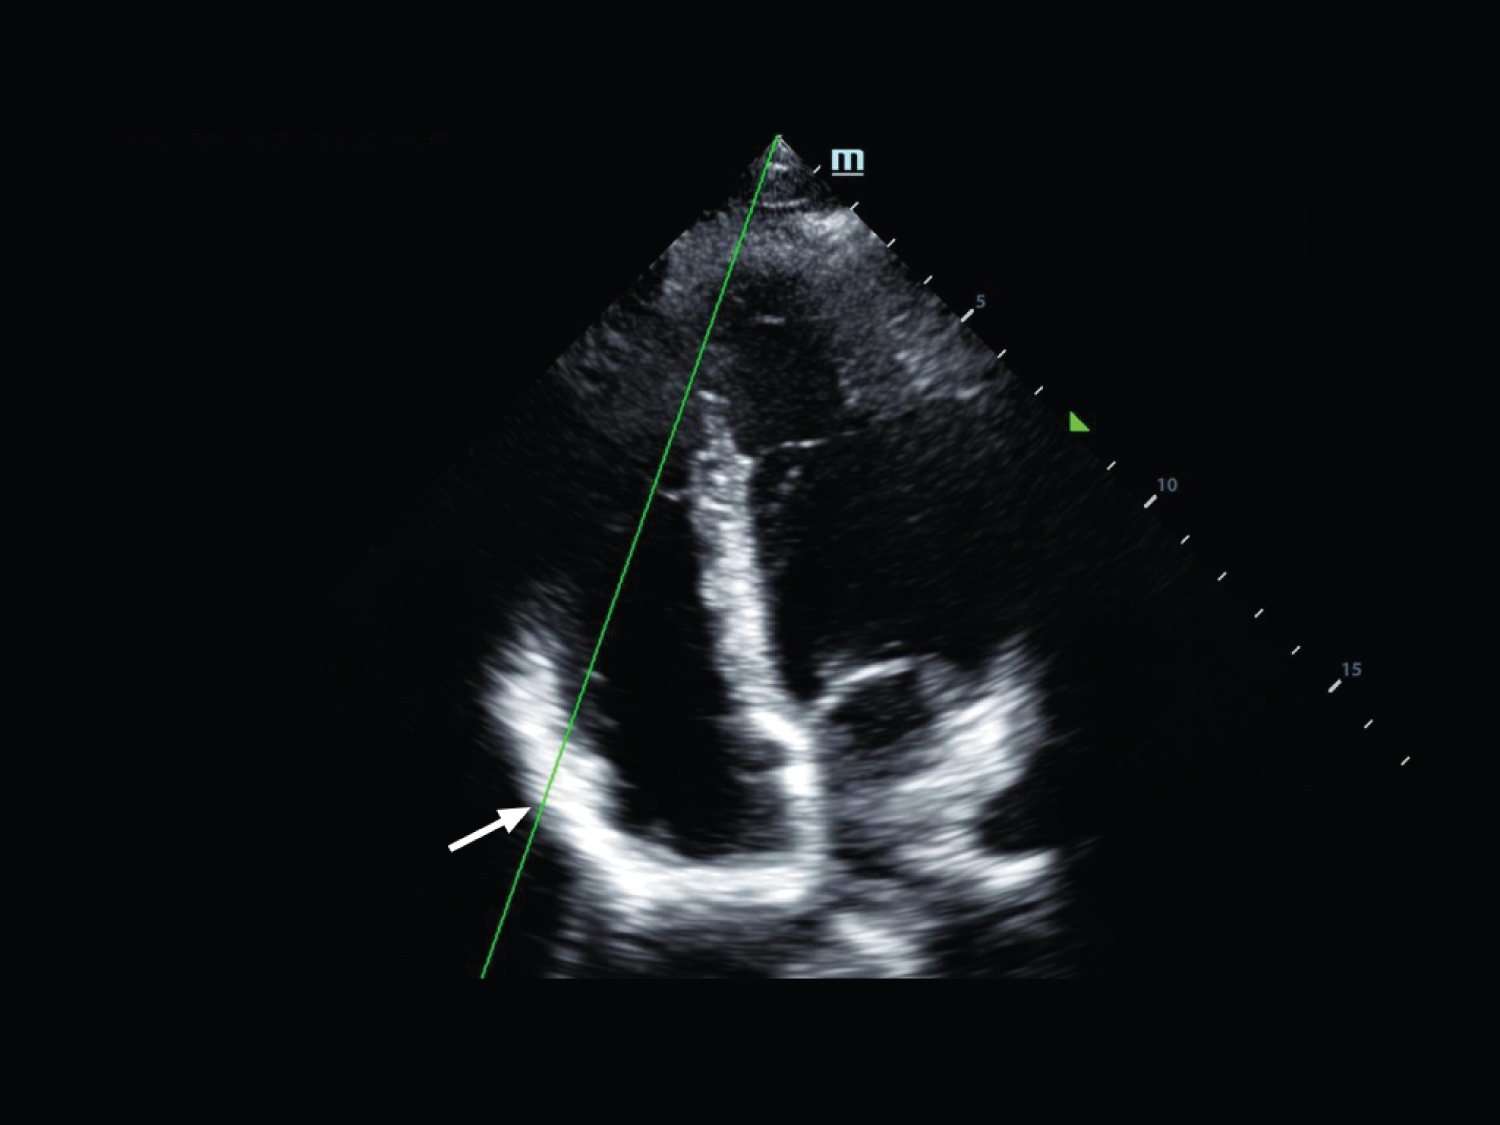 Figure 7: Apical 4 chamber view demonstrating placement of the M-Mode cursor over the lateral border of the tricuspid annulus (arrow). View Figure 7
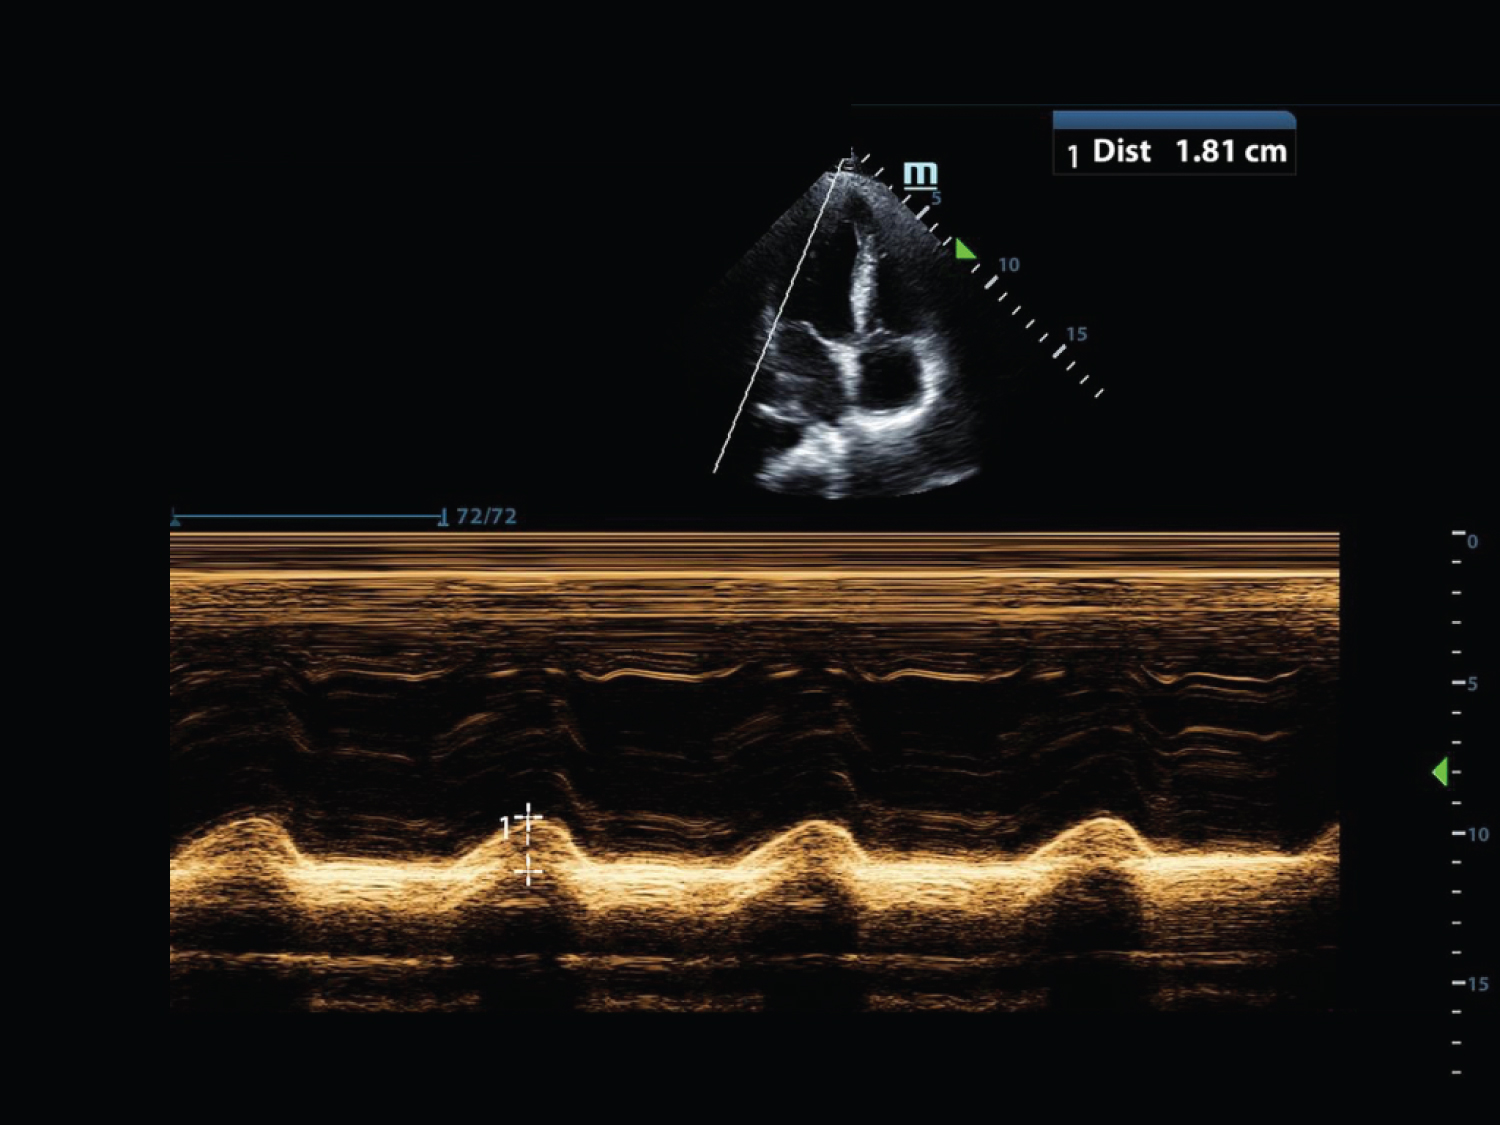 Figure 8: Apical 4 chamber view demonstrating M-Mode of a TAPSE measurement. View Figure 8
TAPSE is perhaps most useful in patients presenting with signs and symptoms concerning for either PE or RV myocardial infarction (MI). Up to 50% of patients ultimately diagnosed with PE do not have an identifiable risk factor for thrombosis making PE a difficult diagnosis [11]. The presentation of PE varies widely, from asymptomatic to asystole, depending on clot burden and cardiovascular reserve. Computerized tomography angiography is the mainstay for diagnosing PE in the emergency department setting, however, it is not ideal for hemodynamically unstable patients as they must leave the acute care area, those with contrast allergies, or in the pregnant patient. A recent prospective study of 150 emergency department patients showed that a TAPSE < 20 mm yielded a sensitivity of 94% for PE in the hemodynamically unstable patient. The same study also showed that TAPSE measurements by trained emergency physicians had a high interrater reliability [12].
RV MI is another disease process leading to poor RV systolic function. RV MI often occurs concomitantly with an inferior wall MI and is associated with higher morbidity and mortality compared with a left ventricular MI of similar size [13]. It is well established that wall motion abnormalities detected on echocardiography precede electrocardiographic changes and clinical symptoms in patients with MI [14,15]. One study showed that RV function measured by TAPSE accurately predicted RV MI even in the absence of a detectable wall motion abnormality, suggesting that TAPSE may be the earliest sign of RV MI [16].
It should be noted that the majority of the literature investigating TAPSE evaluates the prognosis of established disease (e.g. the sequelae of PE and RV MI) rather than the diagnosis of acute pathology. Although TAPSE measurements seem promising, future studies focused on patients in the emergency department setting are needed to clarify its role in the diagnosis of acute disease in the undifferentiated patient.
None.
The right and left sides of the heart are very similar in terms of structural components; however, they vary in their size, thickness, function and response to acute pathologic processes. Emergency physicians should be able to differentiate the RV and LV based on anatomic differences regardless of probe indicator orientation, image settings on the machine or normal versus pathological state. Understanding of RV size, as well as septal and free wall motion can be beneficial in the diagnosis of pathologic process that affect RV pressure or volume and RV free wall thickness can give information about the chronicity of disease. Finally, TAPSE can give a quantitative measure to estimate RV function. Although most efforts utilizing echocardiography in the emergency department setting focus on the pericardium and the function of the LV, understanding of the structure and function of the RV can give a more complete picture and only add to the emergency physicians understanding of the hemodynamics of the acutely ill, symptomatic patient in their care.
This has not been presented or submitted elsewhere.
There is no grant support involvement.