Multidrug-resistant (MDR) and virulent pathogenic strains of Pseudomonas aeruginosa (Pa) are among the most dangerous pathogens in healthcare-associated infections. In this study, a comparative analysis was performed on two clinical Pa strains from pneumonia patients, 1) An acute strain (CMC-115) and 2) A chronic multidrug- and carbapenem-resistant strain (CMC-097) with distinct phenotypic and genetic characteristics. A transcriptome analysis using both the Pseudomonas DNA GeneChip microarray and Illumina RNA-Seq technologies was carried out for both strains at early-stationary growth phase in laboratory culture. The comparative transcriptomic analysis identified 134 genes differentially expressed ≥ 4.0-fold by both technologies. Between the two strains, which included virulence genes such as flagellar, pili, pyoverdine, and phenazine genes, that were higher in the acute strain, CMC-115, and type 3 secretory system (T3SS) and pyochelin biosynthesis genes, which were higher in the chronic strain, CMC-097. In particular, the DNA microarrays suggested and the RNA-Seq analysis confirms the type 3 secretory system genes were completely missing from the acute strain, CMC-115. The combined analysis using the RNA-Seq and DNA microarray methods also identified important genes that were either missing or highly divergent from the Reference PAO1 genome used for the DNA microarray design. For example, the RNA-Seq data identified an operon containing several multidrug resistance genes: aacA27, β-lactamaseOXA-2 (blaOXA-2), qacEΔ1, sul1, and GNAT-N, in the chronic strain, CMC-097. This comparative analysis revealed several important differences in gene expression between the two strains that may lead to identification of targets for better therapy and hospital management.
Pseudomonas aeruginosa, Ventilator associated pneumonia, Transcriptome analysis, Acute and chronic infections
Pseudomonas aeruginosa (Pa) is an increasingly common opportunistic pathogen causing infection in immunocompromised and hospitalized patients, leading to hospital-acquired pneumonia (HAP). Patients on ventilators are particularly vulnerable, where Pa invades the lower respiratory tract leading to ventilator-associated pneumonia (VAP), increasing the risk of mortality as much as 30% in intensive-care units (ICUs) [1-4]. In addition, Pa has become increasingly resistant to carbapenems. A 2016 World Health Organization survey ranked carbapenem-resistant (CR) Pa as the second most critical-priority bacterium among 20 antimicrobial-resistant bacterial species [5].
P. aeruginosa has a broad arsenal of virulence factors involved during chronic and acute infections in HAP. Their production is finely coordinated by many cellular regulators in processes interconnected with various metabolic pathways. One example is quorum sensing (QS), which regulates at least 10% of Pa genes based on local bacterial density as well as other factors [6,7]. Apart from the transcriptomic expression, a subproteomic approach has led to identification and characterization of several periplasmic, membrane, or secreted Pa proteins as potential virulence factors [8-10]. One of the primary clinical challenges of managing Pa infections is that they exist in either acute and chronic forms, but in a chronically ill patient be very challenging to distinguish one from another [11,12]. Many proteins are involved in acute and chronic pathogenesis such as adhesion, secreted proteins, toxins, autoinducers, enzymes, and acquired antibiotic resistance genes. Additionally, in recent years, multidrug-resistant (MDR) Pa clones have caused outbreaks of HAP worldwide [13,14]. This leads to an interesting arrangement between intrinsic virulence factors and acquired MDR genes of strains causing acute and chronic infections [15,16]. The relationship between virulence and resistance in Pa remains poorly understood.
Acute infections caused by Pa often spread rapidly in host tissues, causing organ damage and sepsis with increased mortality rates. The major virulence determinants for acute infections are related to secreted toxins [17]. For example, the pyoverdine biosynthesis genes and receptors (pvdQ to pvdR locus and pvdA and fpvA) generate secreted sidephores that are able to strip iron from host cells and transport it back to the bacterial cell for utilization in multiple metabolic pathways [18-20]. Similarly, the phenazine operons (phzI and phzII) and genes (phzH, phzM, and phzS) encode precursor proteins involved in the formation of three phenazine compounds passively secreted by Pa and 1-hydroxyphenazine, and phenazine-1-carboxamide [21,22] that are responsible for increasing intracellular oxidative stress in the host tissue.
In contrast, chronic HAP is caused by Pa infections that fail to clear through the normal host innate and adaptive immune system or antibiotic treatment and often persist for months or even years without resolution. Chronic isolates typically overproduce alginate, which enhances adhesion to tracheal epithelial cells [23]. The alginate, an exopolysaccharide, inhibits opsonic phagocytosis [24] and promotes resistance to reactive oxygen molecules [25-27]. In addition, the long duration of the chronic infection increases the development of multidrug-resistance (MDR), including CR strains [28-32]. Earlier studies have identified important virulence factors for chronic Pa infections that are involved in bacterial attachment during colonization, nutrient acquisition, biofilm formation and resistance to the immune system and antimicrobials [33-35].
P. aeruginosa has incredible metabolic versatility, generally attributed to its genomic diversity [36,37]. In order to understand the pathogenesis of distinct strains of Pa that cause acute and chronic infections, it is essential to identify and characterize the genetic determinants associated with the differences in virulence factors, as well as to provide information on novel mechanisms of antibiotic resistance.
To investigate the genetic determinants for acute and chronic Pa infections, we have performed a comparative transcriptomic analysis of Pa isolates from patients with hospital-acquired acute and chronic pneumonia. In this study, we used both DNA microarrays and RNA-Seq for differential gene expression analysis of two clinical isolates; 1) CMC-115, a non-MDR strain collected from an acute pneumonia patient and 2) CMC-097, an MDR strain, including carbapenem-resistance (MDR-CR), from a chronic pneumonia patient. We found that many of the gene expression differences identified between the acute and chronic isolates by both DNA microarrays and RNA-Seq using the PAO1 (NC_002516.2) gene sequences as reference [38], were in good concordance and consistently revealed differential expression in at least 11 operons. These differentially expressed operons contained many interesting genes responsible for clinical differences in the acute or chronic isolates such as multidrug efflux, flagella, pyoverdine, phenazine, type 6 secretion system (T6SS), type 3 secretion system (T3SS), and metabolic genes such as glucose transporters and pyochelin biosynthesis genes.
The RNA-Seq data also provided additional insight into genetic and transcriptomic differences between the two strains. For example, the alignment of the RNA-Seq transcripts to the PAO1 genome revealed that some genes are completely missing from the genome of one strain or the other and a number of genes were found to have so many mutations relative to the PAO1 that their expression could not be reliably measured using either conventional DNA Microarray or RNA-Seq analysis. Moreover, the de novo assembly of the RNA-Seq reads that failed to align to the PAO1 reference genome readily identified additional genetic components in the clinical samples such as the presence of the carbapenemase producing β-lactamaseoxacillinase-2 (blaOXA-2) gene responsible for carbapenem resistance in the CMC-097 chronic isolate and its absence in the CMC-115 acute isolate.
The Carilion Clinic Institutional Review Board approved this prospective study, which was conducted during 2010-2012. In this study, two clinical strains of Pa from the Carilion Medical Center (CMC) were used. The two clinical non-mucoid strains were selected from 38 clinical strains, based on their phenotypic expression and clinical outcomes: 1) Pa CMC-115, non-multidrug-resistant, pyoverdine producing strain was collected from a patient with acute pneumonia who was on a ventilator; and 2) Carbapenem-resistant (CR) PaCMC-097, a broadly multidrug-resistant strain was collected from a patient on chronic ventilator support without symptoms of acute infection as described in Table 1. Clinical strains were collected from the Microbiology Laboratory at CMC, and each strain was grown on a blood agar (tryptic soy agar; TSA with 5% sheep blood) plate and transported to Carilion Basic Science Research Laboratory (CBSRL); glycerol stocks were stored at -70 °C freezer. Tests for biochemical properties of the isolates, including antimicrobial susceptibility, were performed using a VITEK®2 automated system (bioMerieux). Antimicrobial susceptibility readings were recorded according to Clinical and Laboratory Standards Institute (CLSI) guidelines (http://clsi.org/m100/).
Table 1: Clinical features and antimicrobial susceptibility of P. aeruginosa (Pa) strains. View Table 1
A single colony from CMC-115 and CMC-097 strain was inoculated in Lysogeny broth (LB) and incubated at 37 °C at 200 revolutions per minute (rpm) for 18 h, after which they were diluted 1:100 in 50 ml fresh LB medium in three replicates. Growth was then periodically measured at OD600. For RNA isolation, 10 ml of each bacterial sample from each replicate was collected at early stationary growth phase of 5-hour (1.618 OD600), indicated by asterisk in Figure 1. Bacterial cells were pelleted by centrifugation at 3220 × g for 15 min at 4 °C. For Western blot analysis, P. aeruginosa strains were grown for 11 h and samples were collected every hour from 5 h onward, normalizing the bacterial suspensions to an OD600 of 0.1 and processing always the same number of bacteria.
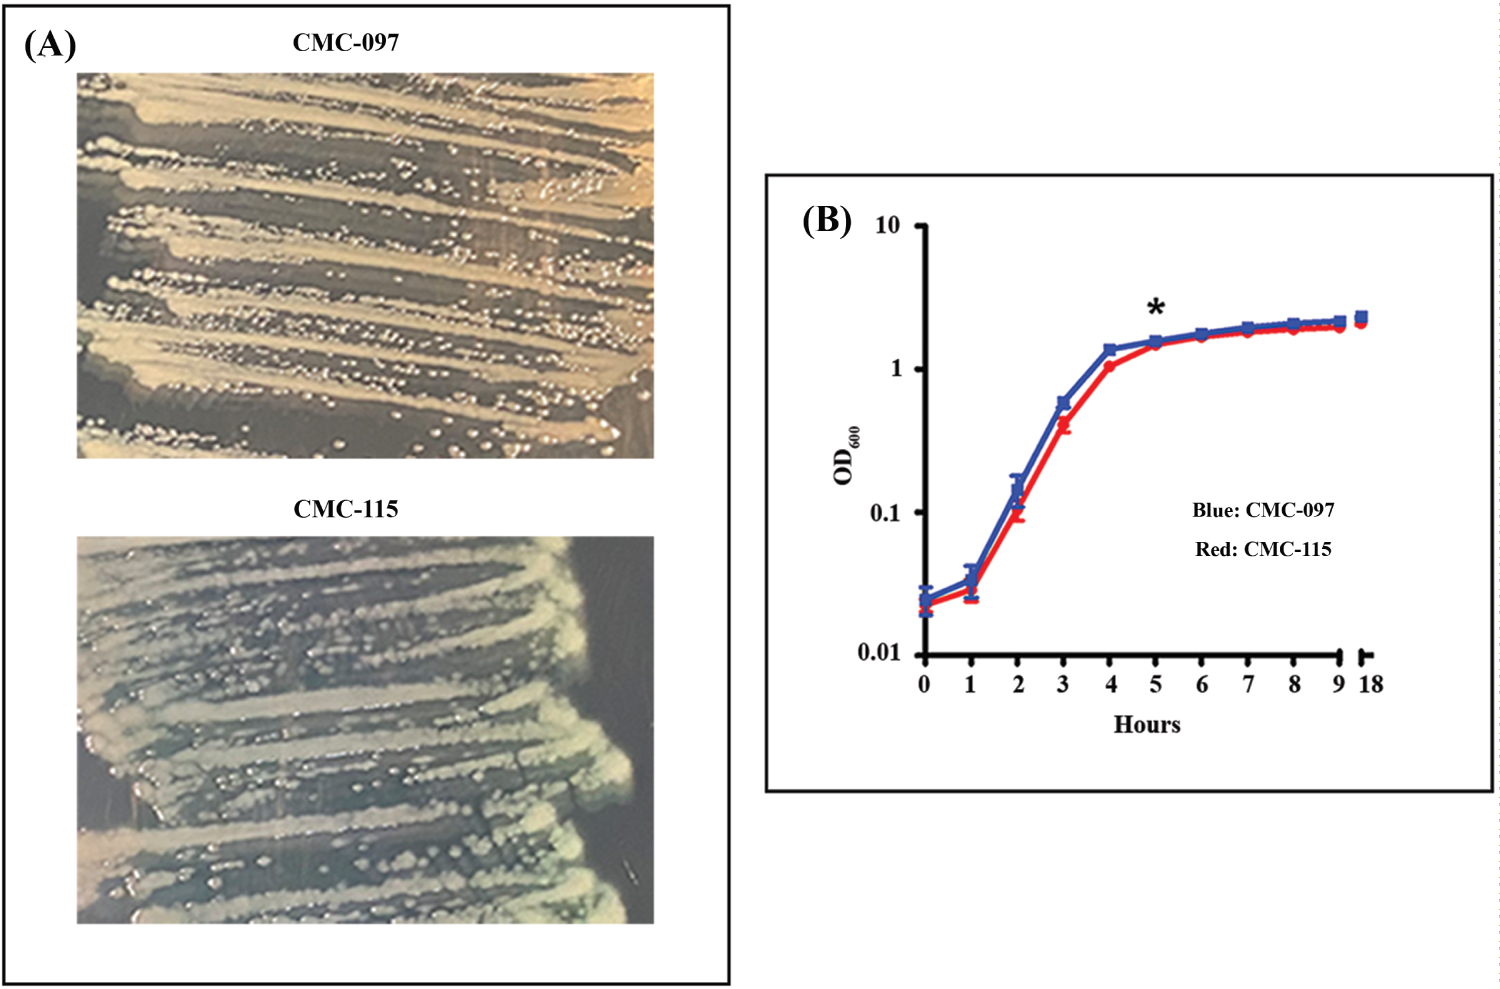 Figure 1: Phenotypic Characterization of CMC-097 and CMC-115. A) Representative figure shows each strain grown on trypticase soy agar. CMC-097 growing pale yellow non-mucoid colonies compared to the green non-mucoid colonies of CMC-115; B) CMC-115 (blue line) and CMC-115 (red line) grown in the same conditions in LB cultures. Both strains show similar growth curves as measured at OD600 during 1-9 and after 18 hours cultured at 37 °C at 200 rpm. The data shown are from two independent experiments with mean values and ± standard deviation.
View Figure 1
Figure 1: Phenotypic Characterization of CMC-097 and CMC-115. A) Representative figure shows each strain grown on trypticase soy agar. CMC-097 growing pale yellow non-mucoid colonies compared to the green non-mucoid colonies of CMC-115; B) CMC-115 (blue line) and CMC-115 (red line) grown in the same conditions in LB cultures. Both strains show similar growth curves as measured at OD600 during 1-9 and after 18 hours cultured at 37 °C at 200 rpm. The data shown are from two independent experiments with mean values and ± standard deviation.
View Figure 1
Minimal medium that contained peptone broth (10 g/liter peptone and 5 g/liter NaCl) with 0.6% agar were used in subsurface twitching motility assay [39]. Briefly, the clinical cultures of CMC-115 and CMC-097 strains were grown overnight in LB medium and transferred to twitching plates (0.6% agarose in LB medium). Plates were stabbed with a sterile blunt inoculum loop and incubated at 28 °C for 72 hours. Agar was removed with a sterile spatula and stained with 0.1% crystal violet (CV) on the plate and left to set for 5 minutes. Then, CV was washed with water several times and twitching zones were measured as radius of movement and expressed in millimeter (mm). Experiments were performed in triplicate.
For the pyoverdine assay, LB medium was inoculated with Pa strains CMC-115, CMC-097, and PAO1, a laboratory strain (each strain normalized to OD600 = 0.01) and incubated at 37 °C and 200 rpm 18 hours. Bacterial growth was measured at OD600 nm and cultures were centrifuged at 200 × g for 30 min at 4 °C. Supernatants were filtered (0.4 μm) to obtain sterile Pseudomonas culture free supernatants (PCFs), as described earlier [40]. Each group in this experiment contained at least three replicates. For all PCFs, pyoverdine production was measured at OD405 nm. Measurements were normalized to bacterial growth using the formula: Relative PYOV production = OD405/OD600.
Total RNA isolation: Total RNA was isolated using the Ribo Pure Bacterial (RNAwiz) kit (Ambion) and the contaminating DNA was removed with the DNA-free kit (Ambion) following the manufacturer's specification. RNA quality was assessed using Experion Automated Electrophoresis System (BioRad), and selected samples were also examined in a Nano RNA 600 Agilent chip in a BioAnalyzer 2100.
Microarray analysis: The P. aeruginosa Affymetrix GeneChip Pae_G1a microarray was used for differential gene expression analysis. Total RNA from 5-hour growth of CMC-115 and CMC-097 were run in duplicates following the manufacturer's protocol (https://www.affymetrix.com/analysis/netaffx/) at DNA Sciences Core Facility at the University of Virginia. Gene expression levels were determined using the RMA method in the "Oligo" package in R/Bio Conductor (https://www.bioconductor.org/). The averages of the logged expression values for the duplicate samples were computed using Microsoft Excel and the average fold change between CMC-115 and CMC-097 was determined for these two isolates along with student's t-test p-value for the differences.
RNA-sequencing and library preparation: A RIN (RNA Integrity Number) of 7.5 or above is required to qualify for RNA-Seq. An amount of 1-2 µg of total RNA is used for RNA-Seq library preparation. Sequencing libraries for the RNA-Seq were constructed following the instruction of the Illumina TrueSeq RNA sample preparation by the manufacturer. Briefly, the RNA was further purified, and then fragmented in a bead-bound reaction. This was followed by the first strand cDNA synthesis and second strand cDNA synthesis. The resulting cDNA was end-repaired and then adenylated. Ligation was then performed according to the choice of the protocols to the specified adapters. The ligation products, after purification, were then PCR amplified where the adaptor and indices were incorporated. The libraries were then validated for concentration and quality by Qubit fluorospectrometer and Agilent Bioanalyzer, respectively.
Next-Gen sequencing: Individually bar-coded sequencing libraries were first pooled in an equal-molar manner, which were then diluted to 10 nM and denatured in 0.1 sodium hydroxide and adjusted to 12 pM as final concentration for loading into a single lane of an Illumina NextSeq 150 V2 High Output flow cell. After that, the flow cell was transferred to the Illumina NextSeq 500 for a paired-end sequencing of 75 sequencing cycles, according to manufacturer's recommended protocol (https://icom.illumina.com/). The RNA-Seq analysis and data discussed in this publication have been deposited in the NCBI Gene Expression Omnibus (GEO; http://www.ncbi.nlm.nih.gov/geo/) and are accessible through GEO series accession number GSE180499.
Processing of Illumina data: The Illumina paired-end fastq files for the three replicate samples for each of the two strains were aligned to the annotated PAO1 reference genome (NC_002561) using the Geneious 11 software (Biomatters, Ltd) with the default "low sensitivity" setting, allowing 10% mismatch. The read counts aligning to each of the annotated genes were normalized by dividing by the number of mapped reads for each sample and multiplying by one million to compute the transcripts per million (TPM) expression levels.
SDS-PAGE and Western blot analysis: For SDS-PAGE and Western blotting analysis, normalized cells pellets were directly lysed in Laemmli buffer [41] and boiled for 10 minutes at 100 °C, and total proteins were separated on the 8-16% SDS-PAGE gels using the Criterion gel system (BioRad), as described elsewhere [7]. Blots were probed with anti-PcrV antibodies raised in rabbits (a kind gift from Arne Rietsch) was diluted at 1:3000 in killer filler (KF) reagent, as described elsewhere [7], and incubated overnight at 4 °C. Immunodetection was performed with secondary antibody HRP-conjugated goat anti-rabbit IgG at a dilution of 1:5000 in PBS-T. The blots were washed three times with PBS-T followed by PBS for five min each. Finally, reactivity was visualized using enhanced chemiluminescence (ECL Kit) according to the manufacturer's protocol (Amersham). Then, the same blot was stripped with stripping solution and re-probed with anti-RpoA mouse monoclonal antibody (BioLegend) in 1:5000 and detection performed with HRP-conjugated goat anti-mouse IgG at a dilution of 1:5000 and visualized as described earlier.
PCR was carried out using primers for pcrV gene and rahU gene used as comparative product by using genomic DNA (gDNA) as a template, as described earlier [42]. The PCR was set up as follows: 23 μl of platinum Taq PCR Supermix (Invitrogen) including 0.5 μl of forward and reverse primers for pcrV and rahU together, then 2 μl of DNA template from each strain was added to give a final volume of 25 μl. The negative control contained Supermix, no gDNA template, and 2 µl of sterile water. Reactions were performed in a thermocycler (Biorad) as follows: 94 °C, 2 min, followed by 36 cycles of 94 °C, 30 sec, 58 °C, 30 sec, 68 °C one min and a final extension step of 68 °C for seven min. PCR products were visualized on a 1% agarose gel, stained with 0.5 mg/ml of ethidium bromide and viewed under UV light in Bio-Imager (Biorad).
In this study, two P. aeruginosa (Pa) clinical isolates were collected from ICU patients with acute and chronic pneumonia. The acute strain, CMC-115, was collected from a patient on ventilator support with acute infection, while the chronic strain, CMC-097, was collected from a patient on ventilator support without symptoms of acute infection and who had been repeatedly culture positive for Pa. The clinical features of both strains are summarized in Table 1.
Figure 1A shows that both strains on TSA plates appeared to be non-mucoid but CMC-097 exhibited white colonies while the CMC-115 colonies showed a distinct greenish pigment. In LB culture, both strains had similar growth curves, shown in Figure 1B. In addition, Figure 2A showed that acute CMC-115 isolate exhibited a significant increase in twitching motility compared with the chronic CMC-097 strain (P = 0.0128). Moreover, Figure 2B shows that the relative production of pyoverdine (PYOV) in the culture supernatant was significantly higher in the acute CMC-115 strain than the chronic CMC-097 strain (P < 0.0001), which is consistent with color differences in the colonies in Figure 1A.
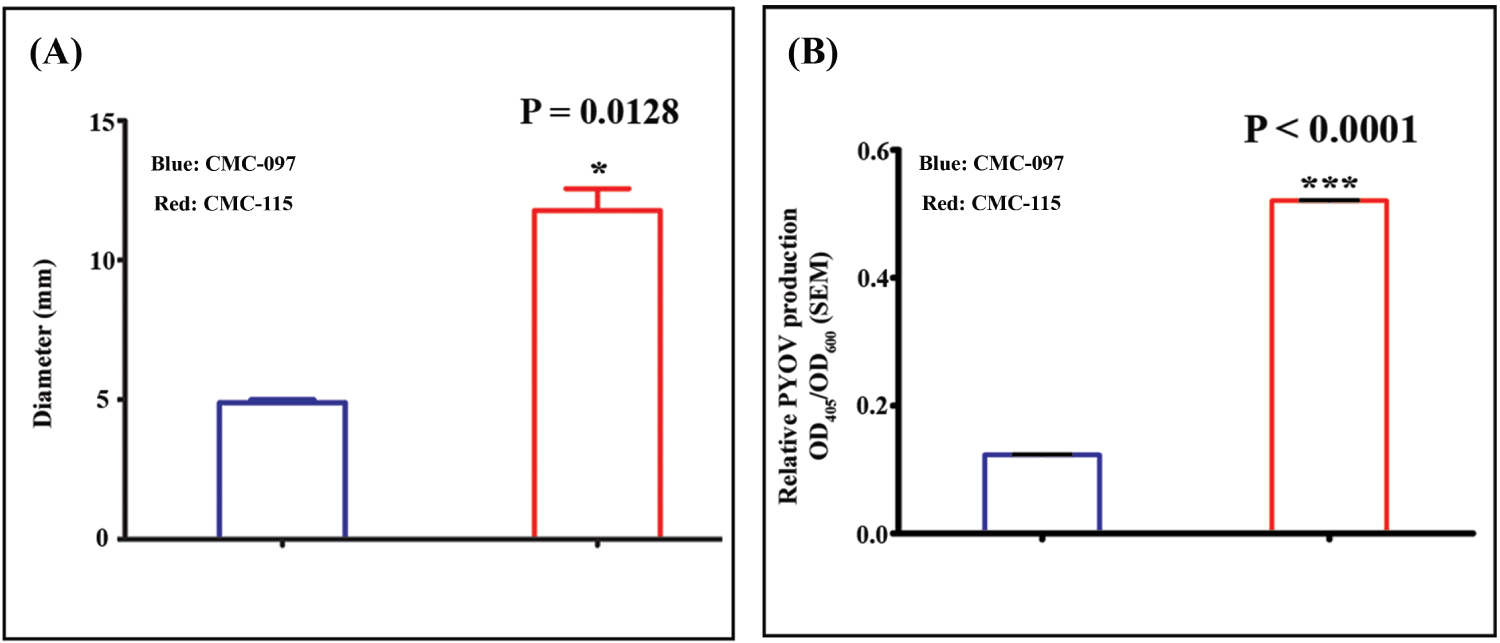 Figure 2: Twitching motility and pyoverdine production by CMC-115 and CMC-097. A) Representative bar presentation of CMC-097 and CMC-115 colony diameters are shown. CMC-115 showed increase twitching phenotype resulting in increased diameter on the plastic surface stained with 0.1% CV and measured by ruler. Three replicates of each were performed. Asterisk indicates P = 0.0128, decreased motility in CMC-097; B) Planktonic Pa culture filtrate (PCFs) and pyoverdine measurement. Bacterial growth was measured at OD600 nm in a spectrophotometer. Each group in this experiment contained at least 3 replicates. For all PCFs, pyoverdine production was measured at OD405 nm. Measurements were normalized to bacterial growth using the formula: Relative PYOV production = OD405/OD600. Each group in this experiment contained at least 3 replicates. Three asterisks indicate P < 0.0001, decrease in pyoverdine production in CMC-097.
View Figure 2
Figure 2: Twitching motility and pyoverdine production by CMC-115 and CMC-097. A) Representative bar presentation of CMC-097 and CMC-115 colony diameters are shown. CMC-115 showed increase twitching phenotype resulting in increased diameter on the plastic surface stained with 0.1% CV and measured by ruler. Three replicates of each were performed. Asterisk indicates P = 0.0128, decreased motility in CMC-097; B) Planktonic Pa culture filtrate (PCFs) and pyoverdine measurement. Bacterial growth was measured at OD600 nm in a spectrophotometer. Each group in this experiment contained at least 3 replicates. For all PCFs, pyoverdine production was measured at OD405 nm. Measurements were normalized to bacterial growth using the formula: Relative PYOV production = OD405/OD600. Each group in this experiment contained at least 3 replicates. Three asterisks indicate P < 0.0001, decrease in pyoverdine production in CMC-097.
View Figure 2
Another important difference between the two strains is that the chronic strain CMC-097 was found to be multidrug-resistant, including carbapenem-resistance (MDR-CR), while the acute strain Pa CMC-115 was non-MDR, as listed in Table 1. The antibiotic susceptibility was tested in vitro by VITEK2® automated system to determine the minimal inhibitory concentrations (MIC) for the CMC-097 and CMC-115 strains. The clinical isolate CMC-097 was resistant to carbapenems, according to the CLSI definition [43] with the respective CLSI breakpoint for imipenem and/or meropenem considered as ≥ 8 µg/mL [44].
To determine genome-wide transcriptional differences between the acute CMC-115 and chronic CMC-097 strains, we first performed microarray experiments on two replicate samples for each strain at early-stationary growth phase in culture (five-hour time point). The transcriptome analysis performed using the Affymetrix GeneChip microarray for P. aeruginosa, identified 151 gene probesets that were increased or decreased in the acute strain CMC-115 versus the chronic strain CMC-097 by more than four-fold out of a total of 5,549 gene probesets on the array (The full microarray analysis with fold changes and p-values is contained Supplementary Table S1).
Fifty-six of the four-fold differentially expressed genes were annotated only as encoding “hypothetical” proteins with no putative function and may be fruitful subjects for future laboratory studies of virulence factors in acute and chronic infections. Here we will focus on the remaining 95 transcripts with identified names, synonyms, and functions in the fully annotated PAO1 reference genome (NC_002516) or the Pseudomonas Genome Database. Table 2 shows that the 46 annotated transcripts more highly expressed 4-fold or more in the acute isolate, CMC-115, clearly group into five different virulence specific gene clusters as follows: 1) Multidrug efflux pump genes (mexG, mexH, mexI and opmD); 2) Genes involved in flagella (fliC, flaG, fliD and fliS); 3) Type 6 secretory system (T6SS) genes (hsiB3, hsiC3, hcP3 and hsiF3), 4) Phenazine biosynthesis genes (phzD2, phzE2 and phzF2); and 5) Pyoverdine biosynthesis genes (pvdQ, pvdM, pvdN and pvdO). Moreover, Table 3 shows that the 49 annotated transcripts highly expressed 4-fold or more in the chronic isolate, CMC-097, were grouped into six separate virulence and metabolic specific gene clusters as follows: 1) Glucose transporters (gltK, gltG, gltF, and gltB); 2) Metabolic enzymes (yhxC, glgP, yciG, katE, and glgA); 3) Heme biosynthesis/denitrification genes (nirG, nirC, nirM and nirS), 4) Pyochelin biosynthesis genes (pchD, pchC, pchB and pchA); and 5) Type 3 secretory system (T3SS) genes belonging to the translocation apparatus, including a needle-tip complex (pcrV), translocon (popB), chaperones (pcrG and pcrH), regulatory (exs) genes (e.g., exsC and exsE), and needle biogenesis encoded by the psc genes (e.g.,pscE and pscF); and 6) The T3SS effector toxin gene (exoS) and its chaperone (spcS). These variable expression patterns, encompassing entire biological pathways, indicate that these clinical strains for acute and chronic infections represent two disparate isolates from the same bacterial species.
Table 2: Up-regulated annotated genes in Pa CMC-115. View Table 2
Table 3: Up-regulated annotated genes in carbapenem resistant Pa CMC-097. View Table 3
RNA-Seq data was generated from three biological replicates for the two different clinical strains of P. aeruginosa, CMC-097 and CMC-115, at early-stationary growth phase in culture (five-hour time point). The fastq files containing the sequencing reads, along with quality scores for each nucleotide, were analyzed using the Geneious RNA-Seq data analysis pipeline. More than 125 million Illumina paired-end reads were generated for each of the six samples and greater than 98% of the reads were mapped by Geneious to the PAO1 reference genome (NC_002516) with at most 10% mismatch. Details of the sequencing results are provided in Table 4.
Table 4: RNA-Seq read counts. View Table 4
Geneious read alignments for each sample were used to determine the normalized gene expression levels in TPM using the "Calculate Expression Levels" command for the 5572 gene sequences annotated in the PAO1 reference genome. Then the expression fold-changes between the CMC-115 and CMC-097 samples were computed by taking the ratio of the averages of the TPM results for the three replicates. (The complete RNA-Seq analysis with fold changes and p-values is contained in Supplementary Table S2).
Due to the greater sensitivity and specificity of the RNA-Seq transcriptome analysis, many more genes were found to be differentially expressed 4-fold or more between the two strains. The RNA-Seq analysis identified 587 genes with 4-fold or greater changes in expression between the acute, CMC-115, and chronic, CMC-097 strains (Supplementary Table S3).
Of the 151 gene probesets found to be greater than 4-fold changed on the DNA microarrays, only 149 are still annotated in the current PAO1 genome (NC_002516). (PA2456 was discontinued and PA4527 is pseudogene). The RNA-Seq results confirmed 90% (134/149) of these 4-fold changes as shown in the Venn Diagram (Figure 3A) including 87 of the 95 annotated genes in Table 2 and Table 3.
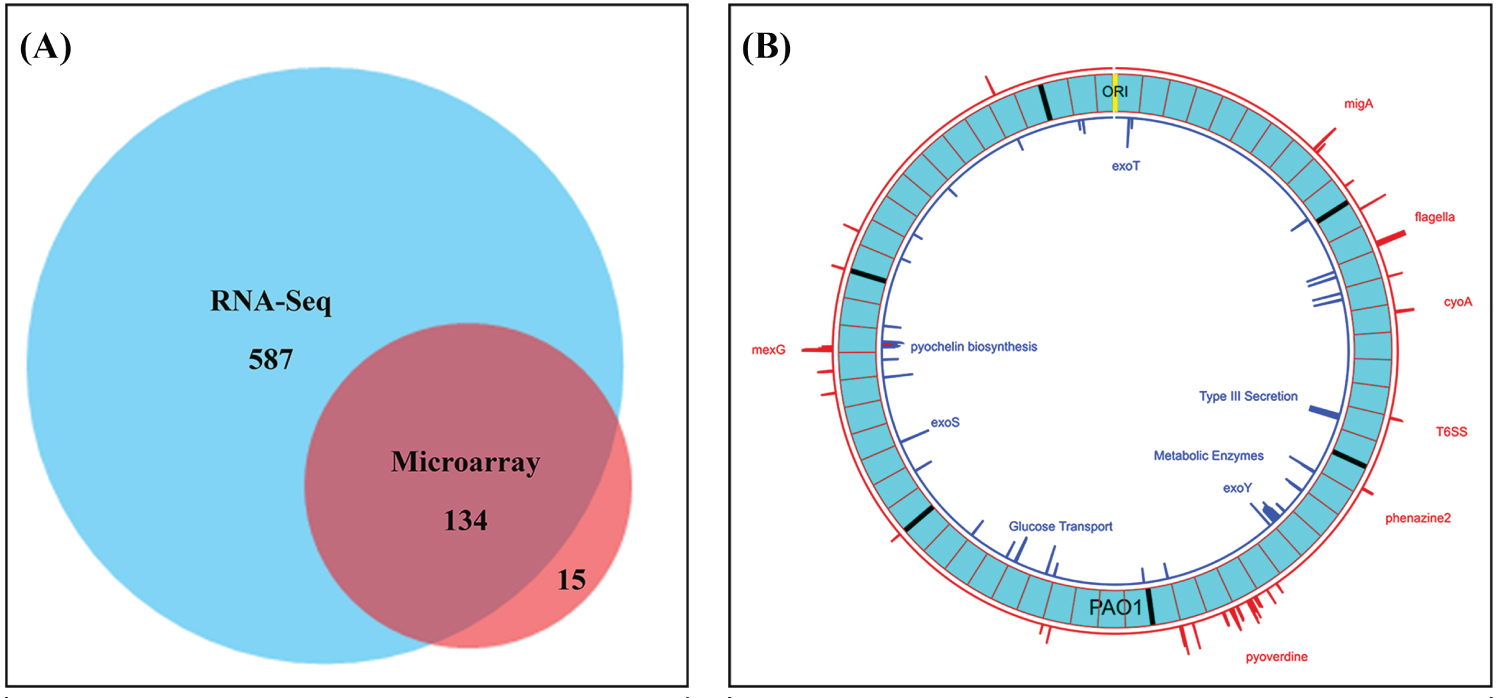 Figure 3: Venn diagram shows validation of gene expression measurements using DNA microarray and RNA-Seq and Circular Plot represents the loci of 4-Fold or greater differences of gene expression levels on the PAO1 genome. A) Number of genes at least 4-fold changed between CMC-97 and CMC-115 using PAO1 as a reference using RNA-seq and DNA-microarrays. Note: For the 15 genes identified only by DNA microarrays there were often large numbers of SNPs between the two strains; B) Circos plot created with Circa (http://omgenomics.com/circa). The loci of 4-fold or greater expression for CMC-115 (red) and CMC-097 (blue) are plotted relative to the circular, 6.24 Mbp PAO1 Reference genome (light blue, with major tick marks indicating multiples of 1 Mbp and minor tick marks indicating 100 Kbp divisions relative to the ORI). The log2 of the expression Ratio is plotted for all genes with 4-Fold changes ranging from a height of 2 to the maximum height capped at 6 (64-fold difference).
View Figure 3
Figure 3: Venn diagram shows validation of gene expression measurements using DNA microarray and RNA-Seq and Circular Plot represents the loci of 4-Fold or greater differences of gene expression levels on the PAO1 genome. A) Number of genes at least 4-fold changed between CMC-97 and CMC-115 using PAO1 as a reference using RNA-seq and DNA-microarrays. Note: For the 15 genes identified only by DNA microarrays there were often large numbers of SNPs between the two strains; B) Circos plot created with Circa (http://omgenomics.com/circa). The loci of 4-fold or greater expression for CMC-115 (red) and CMC-097 (blue) are plotted relative to the circular, 6.24 Mbp PAO1 Reference genome (light blue, with major tick marks indicating multiples of 1 Mbp and minor tick marks indicating 100 Kbp divisions relative to the ORI). The log2 of the expression Ratio is plotted for all genes with 4-Fold changes ranging from a height of 2 to the maximum height capped at 6 (64-fold difference).
View Figure 3
The RNA-Seq analysis provided further support for the functional interpretation of the differences between the two strains by identifying additional members of differentially expressed operons with greater than 4-fold changes. Moreover, the full RNA-Seq analysis also identified additional functional groups of genes that were clearly differentially expressed more than 4-fold between the two strains. In addition to the gene clusters found to be upregulated in CMC-115 relative to CMC-097 in the microarray analysis, the conventional RNA-Seq also identified operons with 1) Oxidation-reduction genes cyoA, cyoB, cyoC, cyoD, cyoE; and 2) migA, cat, toxR; and 3) Additional phenazine biosynthesis genes phzM, phzA1-phzG1, and phzS.
However, the RNA-Seq results for the three replicate measurements of the de-nitrification, nirG, nirC, nirM and nirS, genes were inconsistent (with large p-values) suggesting that the 4-fold increase in the chronic CMC-097 strain might be an experimental artifact. Moreover, more stringent alignments of the RNA-Seq reads to the two nearly identical phenazine biosynthesis operons, phz1 and phz2 [45] revealed that the phz2 appear to be more highly expressed than phz1.
The loci of the most differentially expressed operons across the genome found by RNA-Seq are shown in the Circos plot and created with Circa (http://omgenomics.com/circa) in Figure 3B.
In some cases, the RNA-Seq analysis would find zero reads aligning to genes in all three replicates of one strain or the other, which leads to infinite fold change. In particular, the RNA-Seq analysis found zero reads detected for the genes of all three T3SS effector proteins and an exoenzyme S synthesis protein, the exoT (PA0044), exoY (PA2191), exoS and spcS (PA3841-PA3842), in the CMC-115 strain. The expression of 35 other T3SS associated genes (PA1691-PA1725) was also completely absent in the RNA-Seq analysis of the CMC-115 strain, as listed in Supplementary Table S3. The absence of some of the T3SS genes identified by RNA-Seq transcripts in CMC-115 were also validated at both the transcript level by PCR and at the protein level by Western blots. For example, Figure 4A shows that the type 3 secretory translocator PcrV protein (32-kDa) product was immuno-stained with CMC-097 during growth phases but is completely absent in CMC-115. Moreover, PCR confirmed the 885 bp, pcrV (PA1706) gene was missing in Pa CMC-115 in Figure 4B. All these results suggest that the T3SS related genes are deleted from multiple locations in the genome of the CMC-115 acute infection strain compared with both the PAO1 reference strain and the CMC-097 chronic infection strain.
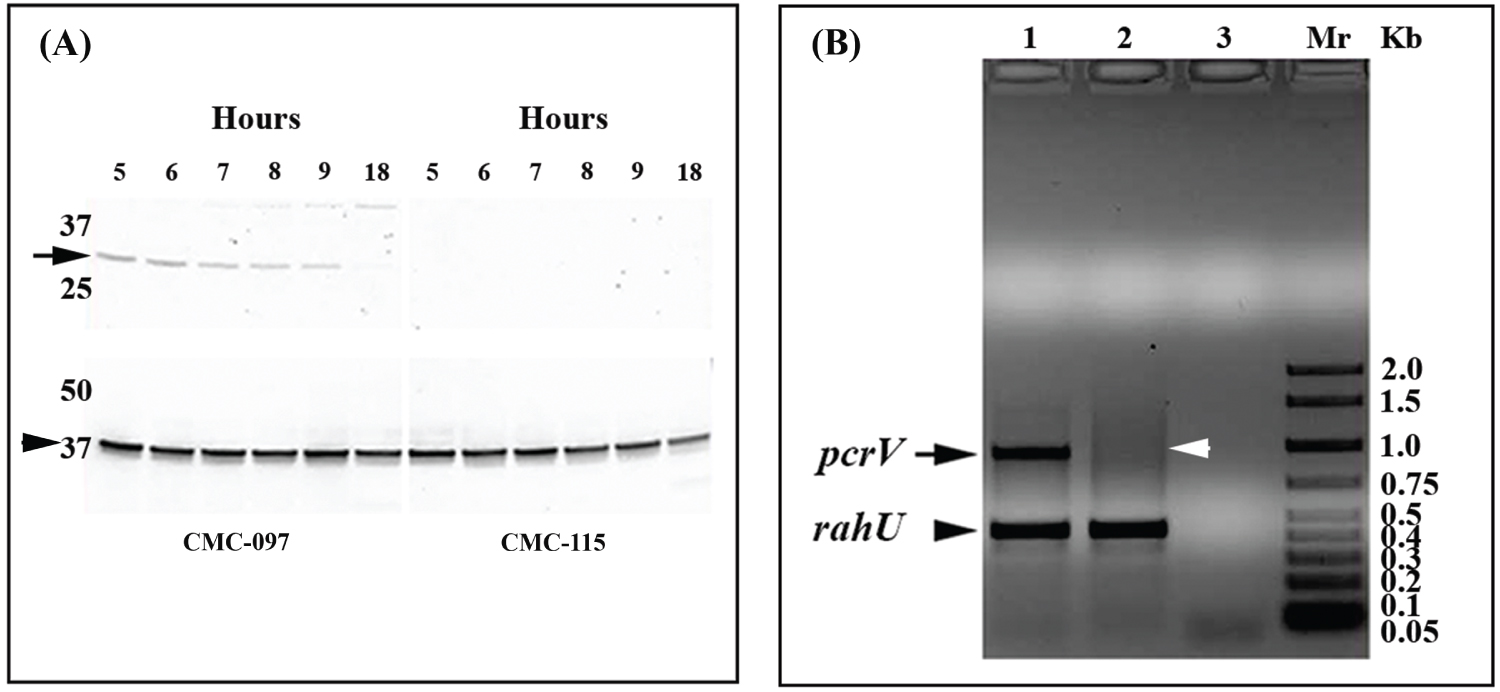 Figure 4: Western blot analysis for PcrV production and multiplex PCR amplification pcrV and rahU genes from CMC-115, CMC-097. A) Top panel, total protein extracts from the Pa CMC-115 and CMC-097 were prepared at regular intervals between 5 and 9 and at 18 h after inoculation and the 32-kDa PcrV protein production (marked by arrow) was monitored. The blot results correspond to the sampling time points of the growth curves in Figure 1B. Bottom panel shows a 37-kDa, RpoA protein (indicated by arrowhead) used as control antibody. Shown is a representative of three independent experiments; B) A representative of an ethidium bromide stained 0.5% agarose gel, showing amplicon size for 885 bp pcrV gene in CMC-097, in lane 1, and the absence of pcrV gene in CMC-115, in lane 2, represented by black arrowhead and white arrowhead, respectively. In both lanes (1 and 2), a 450 bp size amplicon for rahU as used as control gene, Whereas, lane 3 is water control and laneMr is 2 Kbladder markers (Biorad).
View Figure 4
Figure 4: Western blot analysis for PcrV production and multiplex PCR amplification pcrV and rahU genes from CMC-115, CMC-097. A) Top panel, total protein extracts from the Pa CMC-115 and CMC-097 were prepared at regular intervals between 5 and 9 and at 18 h after inoculation and the 32-kDa PcrV protein production (marked by arrow) was monitored. The blot results correspond to the sampling time points of the growth curves in Figure 1B. Bottom panel shows a 37-kDa, RpoA protein (indicated by arrowhead) used as control antibody. Shown is a representative of three independent experiments; B) A representative of an ethidium bromide stained 0.5% agarose gel, showing amplicon size for 885 bp pcrV gene in CMC-097, in lane 1, and the absence of pcrV gene in CMC-115, in lane 2, represented by black arrowhead and white arrowhead, respectively. In both lanes (1 and 2), a 450 bp size amplicon for rahU as used as control gene, Whereas, lane 3 is water control and laneMr is 2 Kbladder markers (Biorad).
View Figure 4
The P. aeruginosa RNA-Seq analysis was performed based on the PAO1 genome. While performing this analysis, we found that for some genes the RNA-Seq would seriously underestimate the number of mapped reads because individual gene sequences of CMC-115 or CMC-097 were highly divergent from PAO1. Therefore, very few reads would align using Geneious with less than 10% mismatch. A simple test for these "unreliable" genes was performed by repeating the Geneious "Map to Reference" using the "Medium Sensitivity" setting, which allows for up to 30% mismatch. An Unreliability Ratio (URatio) could then be computed using the ratio of the normalized TPM values for the 30% matches divided by the TPM values for 10% matches. For most genes, these URatios are very close to 1; however, for the CMC-115 samples we found 91 unreliable genes (with URatios > 1.5) but only 44 for the CMC-097 samples (Supplementary Table S4 and Supplementary Table S5).
In particular, the unreliable genes for CMC-115 in Supplementary Table S4 include several members of the pyoverdine biosynthesis cluster. Both the RNA-Seq results and microarray results show that most pyoverdine biosynthesis genes are highly expressed, which is consistent with the green pyoverdine stains observed in CMC-115 cultures shown in Figure 1A. However, the RNA-Seq indicated some genes in the pyoverdine biosynthesis locus were down regulated in CMC-115. For example, Table 5 shows that the RNA-Seq and microarray ratios for (PA2390 - PA2395) are strongly increased in CMC-115, while the adjacent genes (PA2396 - PA2400) are not. This paradox can be resolved by noting that when the CMC-115 reads are mapped to the PAO1 gene sequences, allowing 30% mismatch instead of 10% mismatch, the U Ratios of mapped reads for CMC-115 is much greater than 4 for the discordant genes, while it is closer to 1 for the concordant genes. Moreover, the CMC-097 U Ratios are close to 1 for all the genes. The results in Table 5 indicate that the discordance arises because the gene sequences for pvdF through pvdJ in the CMC-115 strain are very different from the PAO1 reference while the sequences are very similar for the CMC-097 strain. It is important to note that this divergence in gene sequences will affect the interpretation of the expression measurements for both RNA-Seq and the DNA microarrays (with gene probsets designed based on the PAO1 sequences).
Table 5: Unreliability URatios for genes in the pyoverdine biosynthesis operon. View Table 5
Moreover, the list of unreliable genes for CMC-097 in Supplementary Table S5 includes the flagellar genes, flgK - fliS, as well at the pilA gene, that are all involved in bacterial motility. These results indicate that these gene loci are highly divergent from the PAO1 Reference genome, which may account for the observed decreased in the CMC-097 twitching motility shown in Figure 2A.
Another advantage of the RNA-Seq analysis is that gene expression can be measured for genes that were not contained in either the PAO1 Reference genome or in the microarray design. For example, all the RNA-Seq reads can be aligned to the PAO1 Reference genome with high stringency using Geneious "Map to Reference" with the "Low Sensitivity/Fastest" setting that allows at most 10% mismatch. Then all the "Unused Reads" that failed to map to the Reference can be separately "De Novo" assembled using Geneious to generate contigs of gene sequences that are expressed but are either not present in the Reference or are highly divergent. These contigs can then be annotated using RAST [46] to identify novel gene sequences. In this manner, we readily identified an operon containing genes for aminoglycoside acetyltransferase gene (aacA27), β-lactamaseOXA-2 (blaOXA-2), a truncated quaternary ammonium compound efflux (qacEΔ1) and sulfonamides (sul1), and the acetyltransferase family (GNAT) in CMC-097 strain. A similar analysis of the gene content in the contigs assembled from the "Unused Reads" for Pa CMC-115 showed no evidence of this bla operon. These results are consistent with the antimicrobial susceptibility testing for these two strains shown in Table 1.
Pseudomonas aeruginosa (Pa) is an opportunistic pathogen that is a leading cause of nosocomial pneumonia [47] with high rates of morbidity and mortality [4,48]. Clinical presentations of Pa infections can be either acute or chronic, with distinct manifestations, disease progression, and antibiotic resistance profiles [49]. In this study, we have performed a comparative transcriptomic analysis of two different Pa strains isolated from ICU patients on ventilators, one with acute and one with chronic pneumonia, in order to gain a better understanding of virulence factors involved in pathogenesis and identify multidrug-resistant genes or novel pathway targets [50-52] for treatments. The two clinical strains of Pa, CMC-115 from an acute infection and CMC-097 from a chronic infection, were selected based on clinical evaluation and phenotypic differences identified in culture. Both DNA microarray and RNA-Seq technologies were used to identify over 100 genes that were differentially expressed by factors of 4-fold or more in key virulence related operons. The key functional differences in virulence operons are summarized in Table 6A and Table 6B. These results confirmed many observations of previous studies, but a detailed comparison of the DNA microarray and RNA-Seq results revealed several surprises.
Table 6A: Virulence genes Up-regulated in Pa CMC-115. View Table 6A
Table 6B: Virulence genes Up-regulated in Pa CMC-097. View Table 6B
Previous studies have shown that the acute infection process is initiated by free cells that express a wide variety of acute virulence factors, including QS-regulated virulence factors such as proteases, elastases, phenazines, pyoverdine, toxins [53]; and type 3 secretion system (T3SS) genes [54]. We similarly found that the acute strain, CMC-115 has enhanced expression of pyoverdine genes, compared with the chronic strain CMC-097, resulting in distinct green pigmented colonies in culture. Phenazine genes were also more highly expressed in the acute strain. However, the RNA-Seq data indicated that the expression of the T3SS and its effector genes were completely absent in the acute strain, CMC-115. In contrast, chronic infections involve a slow colonization process with different virulence factors. One important difference that we see in the chronic strain, CMC-097, is enhanced expression of pyochelin genes [55]. We also find a full complement of the T3SS genes as well as key multidrug resistance genes in the chronic strain, CMC-097.
The combination of the DNA microarray and RNA-Seq analysis used in our study was able to transcend these general distinctions between the acute and chronic Pa strains to reveal greater details related to the different strategies for iron uptake in the two strains [56] and the role of two distinct phenazine operons in the Pa genomes [57]. For example, previous work has recognized that Pa can use different mechanisms to acquire iron 1) By pyoverdine-mediated uptake through tonB-dependent receptors, like fpvA, 2) By pyochelin-mediated uptake through the FptA ferripyochelin receptor [56], and 3) By phenazine-mediated iron uptake through the outer membrane proteins (porin), and the FeoB receptor [58]. In particular, previous work [56] has shown that the pyoverdine siderophores, which have a high affinity for iron binding, are key players in the virulence of acute infections [59], both as iron chelators and as signal molecules for the production of other virulence factors [60,61]. Earlier, we have also found that infection by the acute strain, CMC-115, is highly lethal in a mouse model, where the aggressive iron scavenging from the host may be responsible for the increased virulence [62]. In contrast, the pyochelin siderophores, which have lower affinity for iron binding, [56] appear to play a more important role in the prolonged, chronic infections [63,64]. In our previous mouse model study [62],we found that mouse mortality was greatly reduced with the chronic, CMC-097, infection.
Our comparative transcriptomic analyses (summarized in Table 6A and Table 6B) clearly showed that the operon containing pyoverdine synthesis and receptor genes was more highly expressed in acute strain, CMC-115, and that the operon containing pyochelin synthesis genes had much greater expression in chronic strain, CMC-097, suggesting that the two strains utilize these two different strategies for iron acquisition. However, our RNA-Seq analysis also revealed that not only are the pyoverdine-related genes significantly up-regulated in the acute strain but several of these genes are highly divergent from corresponding genes in the PAO1 reference genome or the chronic strain CMC-097. These genes were identified using the URatio strategy for detecting unreliable genes. For example, Table 4 shows that the key ferripyoverdine gene, fpvA, was very different from the PAO1 reference sequence, and even allowing 30% mismatch there were no reads mapped. A careful assembly of the RNA-Seq reads for CMC-115 permitted a reconstruction of this gene to reveal that it was a fpvA Type IIb [65]. This result was also confirmed by our recent complete assembly of the CMC-115 genome [66]. It is also interesting to note that a previous study has found that pyoverdine locus is one of the most diversified regions in several cystic fibrosis and environmental strains [63,64].
Another important difference between the two strains, shown in Table 6A, was the enhanced expression in the acute strain of phenazine biosynthesis genes (phz), which produce the secondary metabolites phenazine-1-carboxylic acid (PCA) and pyocyanin [57] and also play a role in iron uptake in Pa [56]. Moreover, the phz metabolites have been found to be involved in CF patients' lungs and responsible for progressive lung tissue destruction, leading to respiratory failure [67].
Pa genomes typically contain two nearly identical copies of the phz biosynthesis gene operons, phz1 and phz2, which are so similar that the expression cannot be easily distinguished on DNA microarrays or conventional RNA-Seq analysis [45]. By mapping the RNA-Seq reads for both strains with high stringency to the more variable segments of the phz genes, we confirmed that the phz2 operon was expressed as much as 4-fold or more compared with the phz1 operon in both cases. This is consistent with a recent RNA-Seq study of the quorum sensing regulation of phenazine gene expression that also found the average expression level of phz2 genes was much higher than that of phz1 [68].
Overall, the DNA microarray results comparing the gene expression levels of the two strains provided an excellent overview of key virulence factors that are differentially expressed between the acute and chronic strains of Pa in this study. However, the comparison of the microarray and RNA-Seq results revealed a few new results and challenges. For example, when comparing the gene expression levels between two strains of the same microbial species, we found that large levels (4-fold or greater) in differential expression measured by DNA microarrays or conventional RNA-Seq (both using a common Reference genome, eg. PAO1) could arise either 1) Because similar genes in the two strains were truly expressed at different levels or 2) Because the gene sequence in one strain was very different from the Reference or 3) The gene was completely absent in one strain or the other.
In particular, while we found that the DNA microarrays suggested that the genes for the T3SS structural proteins, translocators, and effectors had very low expression in the acute, CMC-115 strain compared to the chronic, CMC-097 strain, the RNA-Seq results gave zero reads mapping to most of these genes, indicating that the TS33 apparatus was completely absent from acute strain. This is denoted in Table 3 and Table 6B as infinite expression. This conclusion was further validated by the absence of a translocation apparatus PcrV protein in CMC-115 by Western blotting (Figure 3A), and we recently confirmed the absence of T3SS genes in CMC-115 by whole genome sequencing [66].
Although it has been earlier believed that type 3 secretion system (T3SS) expression was necessary for increased P. aeruginosa virulence in murine models and human infections by adhesion and invasion into the host cell [15,69-72], T3SS-negative bacteria have been more recently identified in both acute and chronic infected patients as clinical and taxonomic outliers such as Strain JT87 and PA7 [73-76]. Strain JT87 was highly cytolytic in vitro, arguing that it may encode a novel virulence factor [74]. Hence, T3SS-independent, virulence strains such as CMC-115, which may utilize a different pathogenic repertoire in clinical disease, are deserving of further study.
In addition to the discovery of missing genes, the mapping of RNA-Seq reads to the Reference gene sequences at different levels of stringency readily revealed that some, often confusing, differential expression (like fpvA in Table 4) was due to divergence of gene sequences in one strain or the other, causing "unreliable" gene counts. Both the identification of missing genes and highly divergent genes suggest the value of always assembling a complete genome sequence for each strain in a comparative transcriptome analysis. In fact, we have recently completed for the acute strain, CMC-115, and the chronic strain, CMC-097 (GenBank Accession Numbers CP046602 and CP065848), respectively.
Finally, the RNA-Seq data proved useful for identifying novel genes of clinical significance because the RNA-Seq reads failed to map to the PAO1 reference genome and de novo assembled to reconstruct a MDR locus. For the first time in Southwest Virginia, we identified a MDR locus containing aac27, blaOXA-2, qacEΔ1, sul1, and GNAT, which has been subsequently Confirmed by INTEGRALL [77] to be part of a novel In 2020 in the main chromosome of CMC-097 (CP065848).
In summary, the addition of the RNA-Seq analysis not only validated the main findings of the DNA microarray results for gene expression differences between the acute and chronic P. aeruginosa strains, it also provided valuable insight into the distinct reasons for differential gene expression measurements in a comparative transcriptomic study, as well as the identification of novel virulence and multidrug resistance genes. Thus, a better understanding of the virulence mechanisms of Pa is an important step in the development of prospective therapeutic targets and intervention methods for the treatment of hospital-acquired pneumonia.
We acknowledge the faculty members of the Division of Infectious Disease, Carilion Clinic, and Carilion's clinical microbiology laboratory for their assistance in collecting patient samples under Carilion institutional review board (IRB) approved study. Experiments were carried out at the CBSRL, Carilion Roanoke Community Hospital. This study was supported by the Carilion Research Acceleration Program 5 grant to D.C.G. and J.R., Thomas F. and Kate Miller Jeffress Memorial Trust funding for J.R., and L.C. was supported by Virginia Polytechnic Institute and State University (VT), and J. M. G, an undergraduate student and his research supply was granted from the Capstone research program by the Jefferson College of Health Sciences; now it is renamed as Radford University Carilion (RUC). We are thankful to Susan Toliver, laboratory manager, Department of Science laboratory and Sarah Cox, at the RUC, for their valuable support in reagents procuring on manuscript reading and their suggestions.