The Hip disability and Osteoarthritis Outcome Score (HOOS) is a widely used Patient-related Outcomes tool used to assess patient with hip pathologies.
The main purpose of this study was to translate and culturally adapt the Arabic version of HOOS and proving the validity and reliability of this translated score.
110 patients participated in this survey. The internal consistency tests were performed using Cronbach's alpha. Test-retest reliability (intra-correlation coefficient), convergent construct validity, convergent validity, floor & ceiling effects and responsiveness were also calculated. In order to measure the level of agreement, Bland & Altman Plot, forest Plots and ROC curve analysis are performed.
Test reliability for the first testing situation - calculated using Cronbach's alpha - was 0.98 for the pain subscale, 0.98 for the stiffness, and 0.99 for the physical function subscale. For the second testing, reliability was 0.99, 0.97, and 0.99 (pain, stiffness, and physical function, respectively). This only proves that the Western Ontario and McMaster Universities Osteoarthritis Index (WOMAC) is an instrument with good reliability. For each of the three testing occasions the reliability of each subscale (α1 = 0.99, α2 = 0.99, and α3 = 0.99) was excellent. Intra-class correlation coefficients for each of the subscales was between 0.56 (Activity of daily living subscale) and 0.62 (Symptoms subscale), and this puts them all in a category of instruments with moderate reliability.
Overall, Arabic version of HOOS proved to be a good diagnostic tool for patients with hip problems, but it is important to pay extra attention about the differences in symptoms expressed in HOOS in comparison to WOMAC.
Orthopaedic, Translation, Hip osteoarthritis, Disability score, HOOS score
Osteoarthritis (OA) is a degenerative joint disease that leads to devastating disabilities which in turn can cause large socioeconomic burdens for healthcare providers [1,2]. The cause is believed to be due to multiple factors, mainly pro-inflammatory cytokines and biomechanical stresses around synovial joints [3]. Non-pharmacological modalities are the first line of treatment in OA, but as the disease progresses, the need for pain medications and surgery becomes inevitable [4]. Although advances in clinical and radiological assessments are robust, measuring the disability implications on patients remain a challenge [3,5]. For this reason, clinicians have developed patient related outcomes to help them with their management decisions. However, in 1998, the Hip disability and Osteoarthritis Outcome Score (HOOS) was developed and has become a widely used tool in clinical practice [3,6]. Since the HOOS is an English tool, Arabic speaking countries are unable to use it. WOMAC has been validated in Arabic speaking countries, and since then it has been used in practice. Nevertheless, additional analyses have been conducted in order to explore psychometric characteristics of a WOMAC questionnaire that had been used in this study.
This study aims to establish the validity and reliability of the cross-cultural Arabic adaptation of the HOOS.
This cross-sectional study involved 110 patients who completed the HOOS questionnaire. This study was realized in Al-Razi Orthopedic Hospital, Kuwait. The study was performed following guidelines by the Ministry of Health, Kuwait, Research and publication office. The patients gave their informed consent for inclusion before they participated in the study. Out of 110 patients that fulfilled the questionnaire, 107 responded to the second assessment after the initial evaluation.
In order to estimate reliability of the questionnaire, Cronbach's alpha was calculated for each of the three test performed. Also, the Interclass Correlation Coefficient (ICC) was used to assess test-retest reliability.
In order to test factor validity, factor analysis was performed, first, principal components analysis, and then principal axis factoring (with Direct Oblimin rotation).
In order to compare the results of WOMAC questionnaire with those from HOOS, the scores of WOMAC were standardized to the range of 0-100.
Content validity was tested by examing the shape of data distribution, as well as floor and ceiling effects. Floor effect is the percentage of patients who scored the lowest possible score (score of 0), and ceiling effect is the percentage of those with the highest score (score of 100). If more than 30% of the respondents had a floor or ceiling effect, the effects would be considered to be relevant.
Therefore, it is hypothesized that HOOS evaluates hip disability through five dimensions, and this was investigated using factor analysis.
In order to compare the diagnostic performance of two measurement methods (WOMAC and HOOS), ROC curve analysis was performed.
Spearman's correlation coefficient between HOOS and WOMAC was calculated to test convergent validity of the HOOS. Since WOMAC has already been validated in Arabic speaking countries, higher correlation coefficient would prove convergent validity of the HOOS.
Although visco-supplementation is recognized by the Osteoarthritis Research Society International (OARSI) guidelines for the treatment of the hip osteoarthritis, Arab patients did not benefit from it, and therefore not included in our sample.
The HOOS is a patient-administered questionnaire that consists of 40 items, which are answered using a Likert-type scale. These items are divided into 5 subscales: Pain (10 items), symptoms (5 items), activity of daily living (17 items), sport and recreation (4 items), and hip related quality of life (4 items). Scores are calculated for each subscale separately by transforming raw data to a 0-100 point scale - where 0 indicates extreme pain and discomfort, and 100, on the other hand, indicates that respondent has no problems [3,6,7].
These questions are asked to recall a period of the last week before the testing occurs.
All 110 patients completed HOOS in at least two different occasions (T1 and T2), and 106 of them completed it a third time (T3). There were two and a half weeks between each of these three occasions.
WOMAC consists in 24 Likert-type item and every patient gets three scores, from three different subscales. Pain, first subscale has 5 questions (score range 0-20), 2 questions address stiffness (score range 0-8), and physical function has 17 questions (range 0-68). A 0 score on each of the subscales means that patient essentially has not felt any discomfort in their hip (if any); on the other hand, a higher score, 68 suggests greater disability.
The survey was taken in two different occasions, and 2 weeks passed between the two testing situations. IBM SPSS Statistics 21 was used for data analyses.
110 patients completed the HOOS score, and agreed to have their data analyzed for research purposes. The mean age of participants was 44.3 years, with a standard deviation of 15.4 years, implying that the majority of the sample was between 30 and 60 years of age. The youngest participant was 16, while the oldest was 76 years of age.
Test reliability for the first testing situation - calculated using Cronbach's alpha - was 0.98 for the pain subscale, 0.98 for the stiffness, and 0.99 for the physical function subscale. For the second testing, reliability was 0.99, 0.97, and 0.99 (pain, stiffness, and physical function, respectively).
Regarding the content validity, 10% of the patients have recorded floor effect on pain subscale, 14% on stiffness subscale, and 12% on the physical function. Moreover, 3% have recorded ceiling effect on pain subscale, 3% on stiffness subscale, and 3% on the physical function.
Test-retest reliability was determined using intra-class correlation coefficient (ICC) (two-way random effects model, absolute agreement) [9,10]. According to the previously published by Koo, et al. [11], based on the 95% confident interval of the ICC estimate, values less than 0.5, between 0.5 and 0.75, between 0.75 and 0.9, and greater than 0.90 are indicative of poor, moderate, good, and excellent reliability, respectively. In this study, WOMAC subscales show moderate retest reliability (0.5 < ICC < 0.75), while illustrating acceptable to strong internal consistency among two assessments for pain (α = 0.735), stiffness (α = 0.745) and physical function (α = 0.768) (Table 1).
Table 1: Mean, Standard Deviation, Change, ICC between different assessments of each subscale. View Table 1
Results point out that for each of the three testing occasions the reliability of each subscale was excellent - α1 = 0.99, α2 = 0.99, and α3 = 0.99. Intra-class correlation coefficients for each of the subscales was between 0.56 (Activity of daily living subscale) and 0.62 (Symptoms subscale). These facts put them all in a category of instruments with moderate reliability.
The results indicated that subscale "symptoms" had the highest intra-class correlation (0.615; 95% CI 0.410, 0.749), while the other HOOS's subscales show moderate level (approximately 0.56) of retest reliability (Table 2).
Table 2: Mean, Standard Deviation, Change, ICC between different assessments of each subscale. View Table 2
Figure 1 illustrates the change and the mean level of different subscales during different assessments. As evident in this figure the mean score of HOOS subscales decreased which is related to more pain and symptoms. At the same time, the WOMAC mean score shows an upward trend, which is also related with more pain and, in general, worsened conditions of the patient.
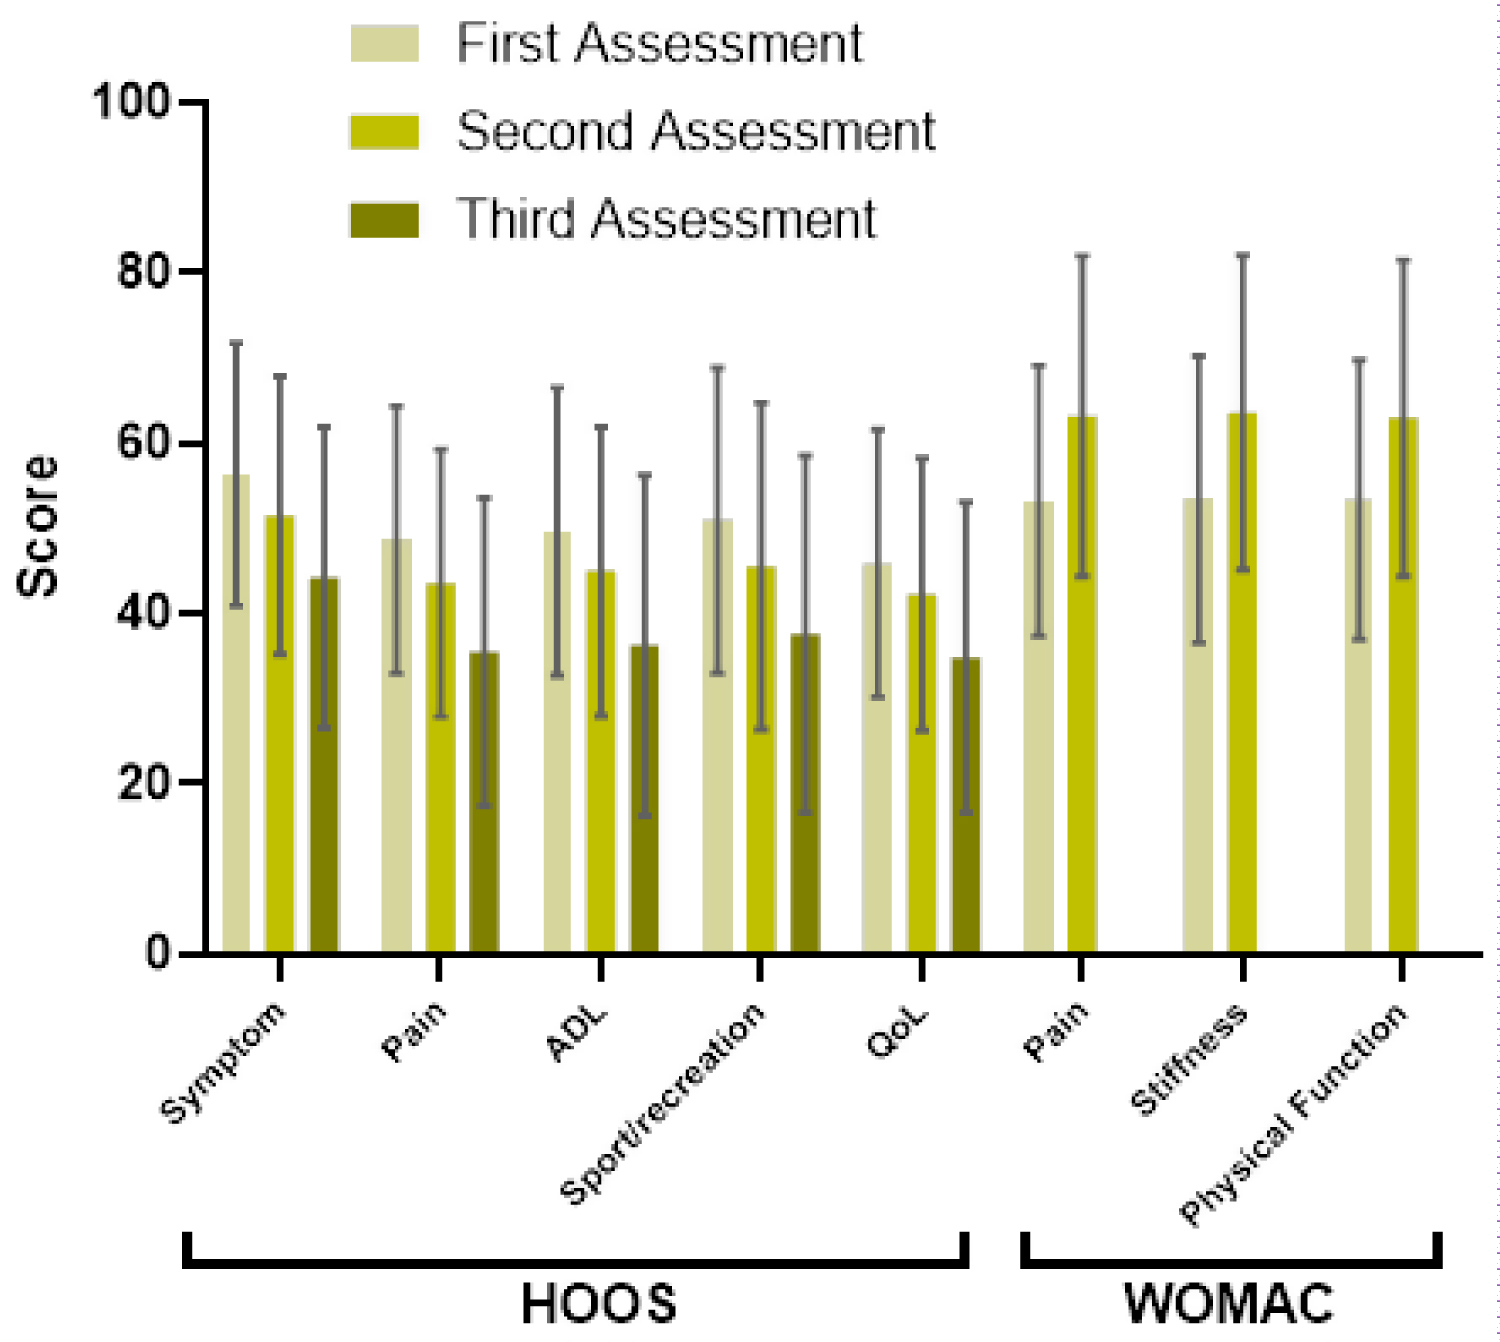 Figure 1: Mean score along with their standard deviations of each subscale during 3 different assessments for HOOS and 2 different assessments for WOMAC questionnaire. Decrease of mean score in HOOS, Increase mean score in WOMAC means a worsened condition.
View Figure 1
Figure 1: Mean score along with their standard deviations of each subscale during 3 different assessments for HOOS and 2 different assessments for WOMAC questionnaire. Decrease of mean score in HOOS, Increase mean score in WOMAC means a worsened condition.
View Figure 1
According to the subscale Hip related quality of life, floor effect was only once recorded above 5% in activity of daily living. For all other subscales, in all the test periods, floor effect was 5% or less. No ceiling effect was recorded for any of the subscales. Using Shapiro-Wilk test, we discovered that data had significantly deviated from the normal distribution in all three time periods (Table 3).
Table 3: Descriptive statistics of HOOS questionnaire. View Table 3
The factor analysis explained 86% of the variance. There were medium to large negative correlations between all of the HOOS subscales, and the subscales from the WOMAC questionnaire (Table 4).
Table 4: Convergent validity of the HOOS (Spearman's rank correlation coefficient). View Table 4
The same conditions (pain, symptoms, etc.) got different scores depending on the if was HOOS or WOMAC. That is, 14 patients had better score in the WOMAC than HOOS's questionnaire.
Another 13% (14 cases) show opposite results. It appeared that the results were better with WOMAC than HOOS, which show a deteriorating condition. 14 patients (12.7%) showed opposite responses (improvement according to WOMAC and deterioration according to HOOS and vice versa) (Table 5).
Table 5: Effect Sizes and SRMs for the WOMAC subscales and HOOS subscales. Bars represent the 95% confidence intervals. View Table 5
Effects are often used to give meaning to change over time in terms of 'trivial' (ES < 0.20), 'small' (ES ≥ 0.20 < 0.50),'moderate' (ES ≥ 0.50 < 0.80) or 'large' (ES ≥ 0.80) change. Cohen 26 introduced this 'matched pairs' effect size, which was later renamed the standardised response mean (SRM) by Liang, et al. [10,12]. According to responsiveness test, WOMAC subscales show similar responsiveness (SRM = 0.41) between first and second measurement. Among HOOS subscales, the most responsive scale was the pain scale (SRM = 0.43), while Quality of life scale resulted in the lowest responsiveness statistics (SRM = 0.40) among HOOS subscales (Figure 2).
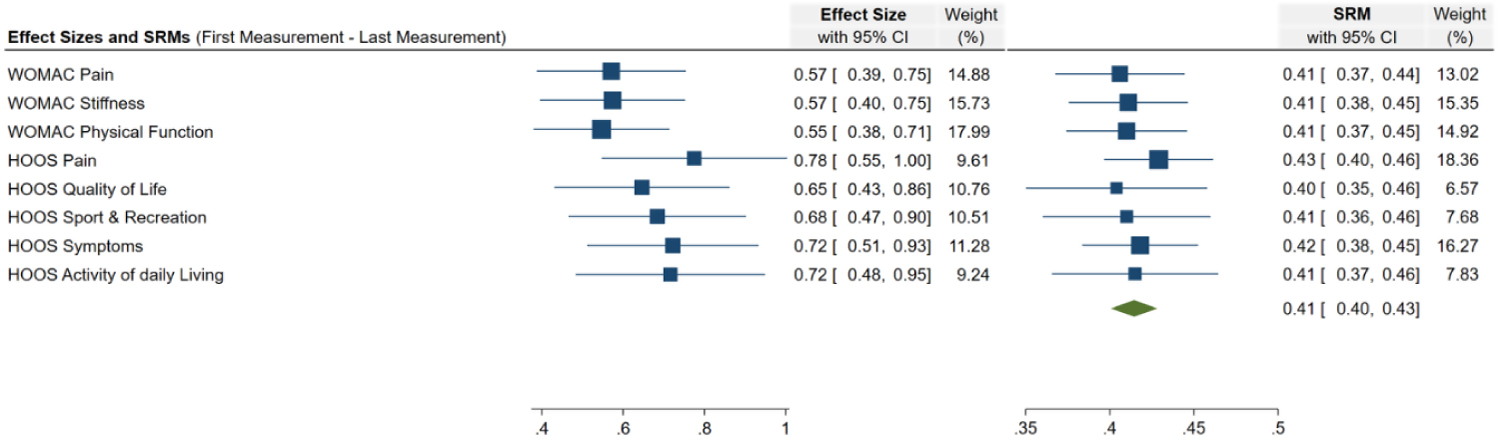 Figure 2: Forest plot of effect sizes and standard response means for the WOMAC subscales and HOOS subscales. Bars represent the 95% confidence intervals.
View Figure 2
Figure 2: Forest plot of effect sizes and standard response means for the WOMAC subscales and HOOS subscales. Bars represent the 95% confidence intervals.
View Figure 2
According to Bland-Almant method, the mean difference between WOMAC and HOOS subscales are plotted as a function of mean of WOMAC and HOOS subscales. Three subscales of each questionnaire were compared to each other in order to find the differences between Pain, Symptoms/Stiffness and Activity of Daily living/Physical Function. Results show that no systemic bias were observed between WOMAC and HOOS, when it comes to "Pain" (M = -1.0, 95% CI -3.26 - 1.23, p = 0.372) and "Physical function/Activity of daily living" (M = -1.99, 95% CI -4.45 - 0.47, p = 0.112) subscales. Comparison to the subscales "Symptoms" from HOOS and "Stiffness" from WOMAC show that their mean clearly deviates from each other (M = -9.18, 95% CI -11.45 - 6.91, p < 0.001). Therefore, there was a systemic bias.
Overall mean difference between WOMAC and HOOS shows that there could be a systemic bias between two questionnaires (M = -2.89, 95% CI -5.19 - -0.59, p = 0.014). In order to test the differences between mean of WOMAC and HOOS, linear regression analysis was performed. Linear regression indicates no statistically significant difference between the two measurement methods (β = 0.107, CI 95% -0.054 - 0.269, t = 1.319, p = 0.190) (Figure 3).
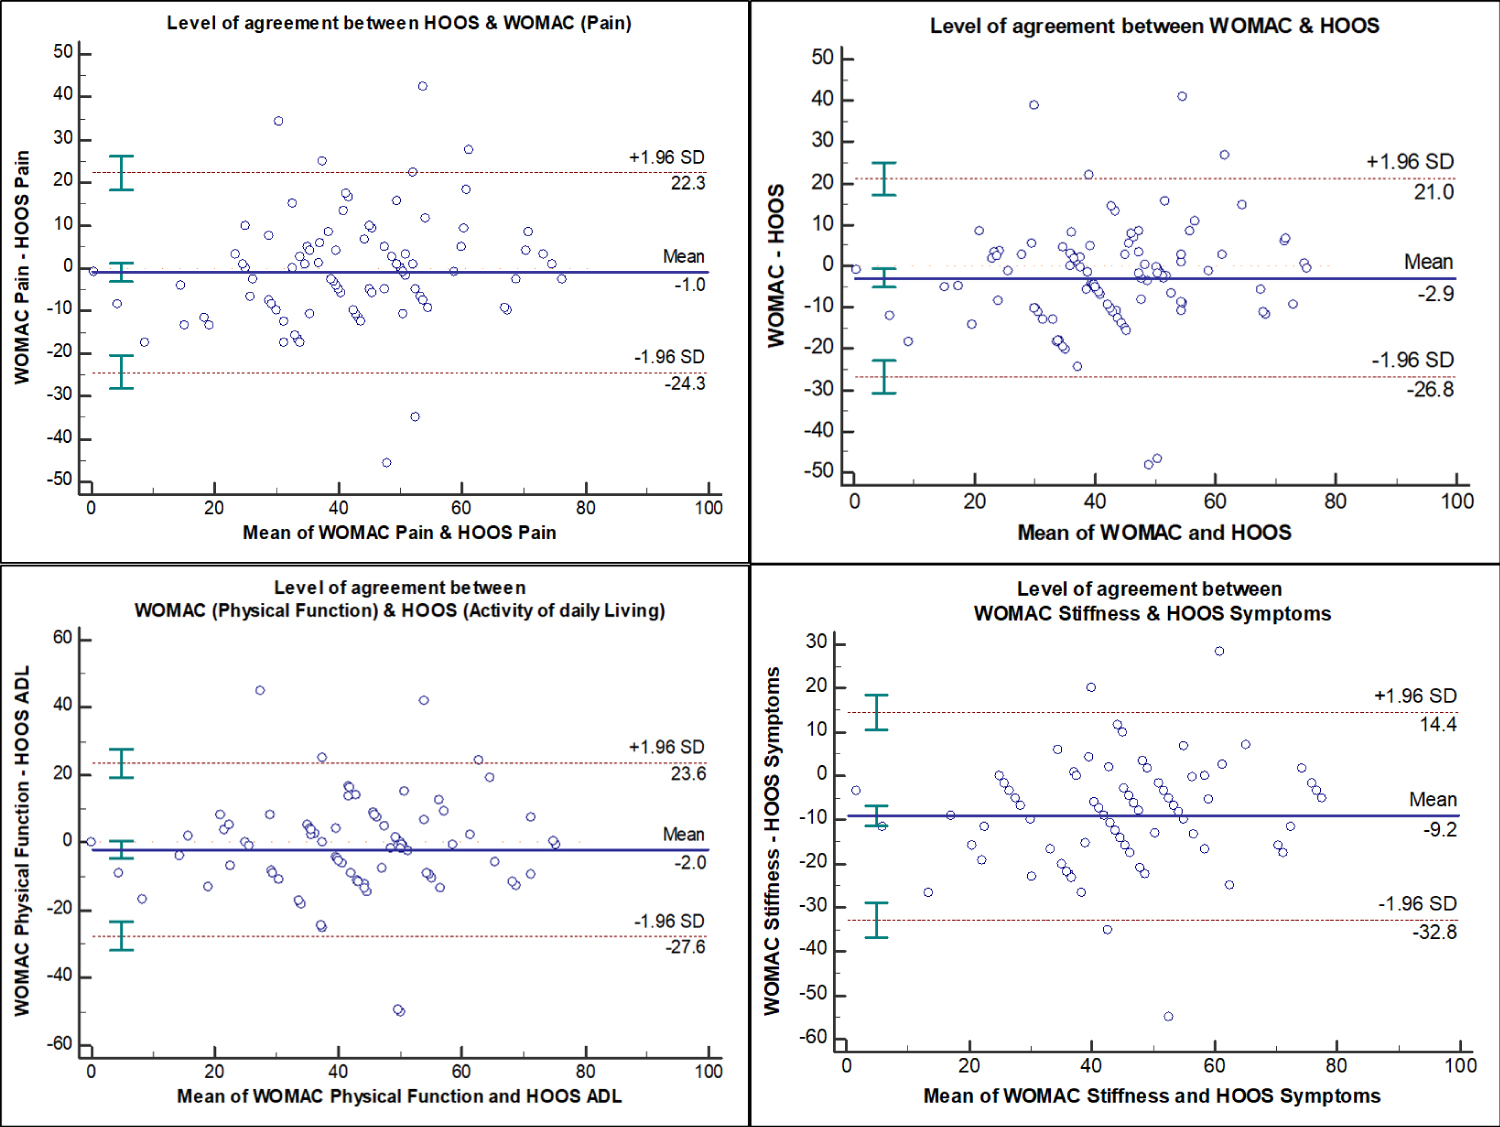 Figure 3: Bland-Altman Plot to demonstrate the level of agreement between difference subscales of HOOS and WOMAC.
View Figure 3
Figure 3: Bland-Altman Plot to demonstrate the level of agreement between difference subscales of HOOS and WOMAC.
View Figure 3
In order to further investigate the level of agreement between HOOS and WOMAC over time, especially for the three subscales which are supposed to be equivalent in HOOS and WOMAC (Pain, Symptoms/Stiffness, Activity of Daily Living (ADL)/Physical Function (PF)), effect size, namely Cohen's d, was calculated. Subscale Symptom (HOOS)/Stiffness (WOMAC) show the highest effect size (d = 0.6, 95% CI 0.16 - 0.70), which indicates that HOOS scores for Symptoms were higher than WOMAC scores for Stiffness. Cohen's d value was 0.24 (95% CI, -0.03 - 0.5) for the overall effect size when all subscales of each questionnaire are taken into account (Figure 4).
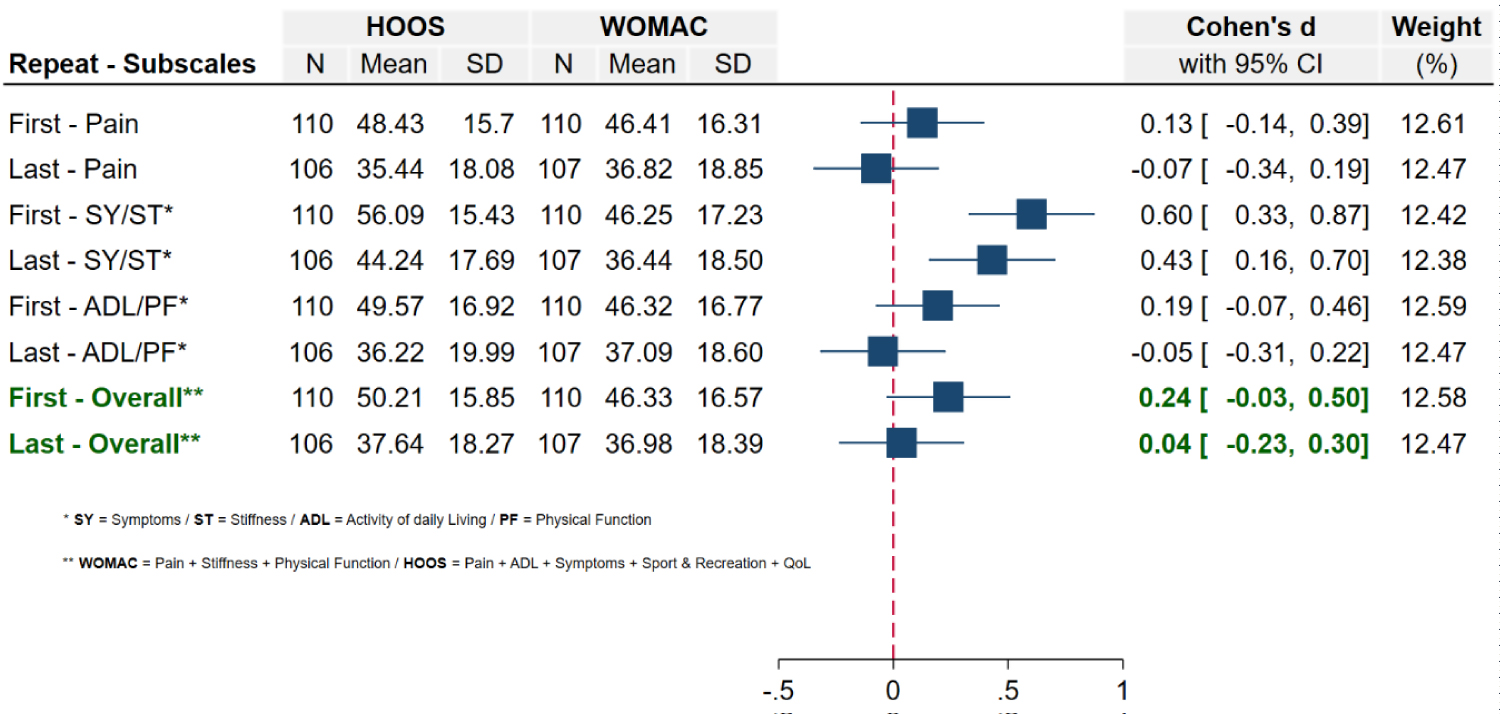 Figure 4: Forest plot illustrating the effect size (Cohen's d) along with 95% confidence interval. First and last measurement of three subscales (Pain, Symptoms/Stiffness, Activity of daily living (ADL)/Physical Function (PF)) between HOOS and WOMAC are compared together.
View Figure 4
Figure 4: Forest plot illustrating the effect size (Cohen's d) along with 95% confidence interval. First and last measurement of three subscales (Pain, Symptoms/Stiffness, Activity of daily living (ADL)/Physical Function (PF)) between HOOS and WOMAC are compared together.
View Figure 4
The purpose of the ROC curve in this study was to determine whether there is a similarity between two methods distinguishing between patients with improved conditions and those with worsened condition. Area under the Curve (AUC) of both groups (WOMAC and HOOS) were very similar (AUCWOMAC = 0.749, AUCHOOS = 0.772). This observation was also confirmed by performing z-test (z = -0.279, 95% CI -0.184 - 0.138, AUC difference = -0.023, p = 0.780) (Figure 5).
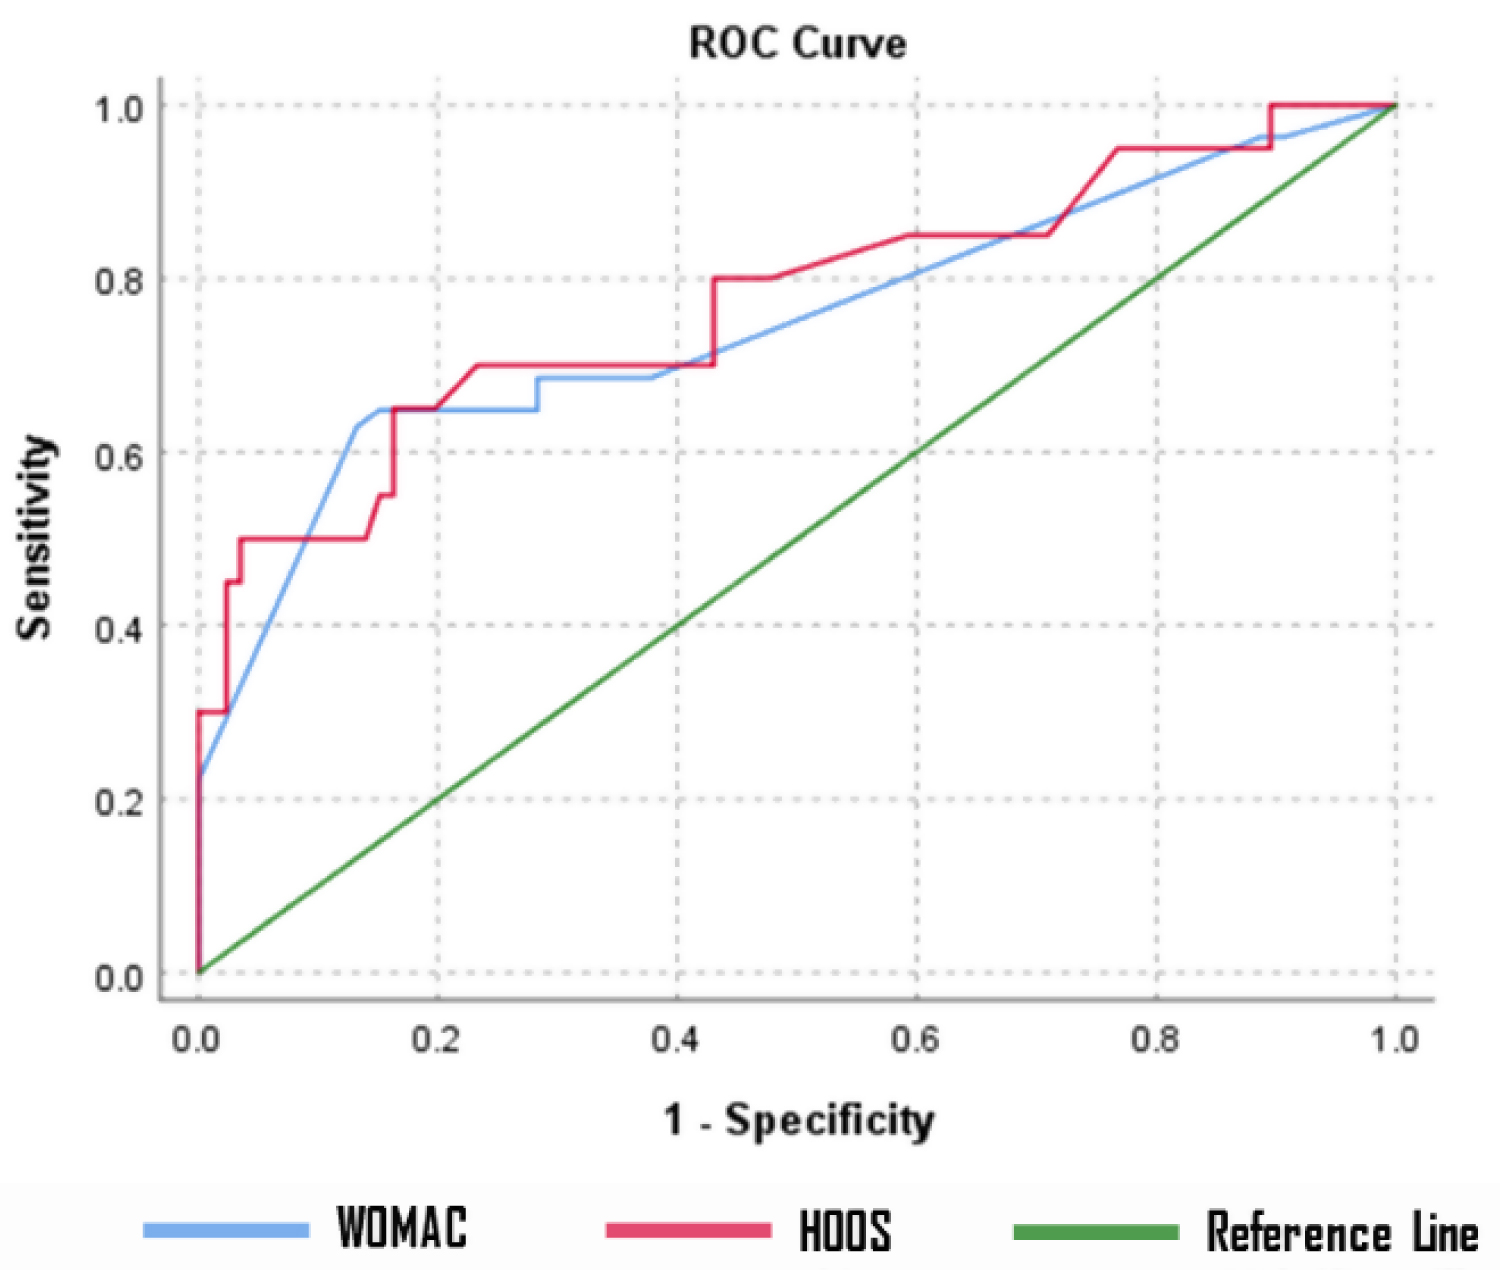 Figure 5: ROC Curve to determine how well/different WOMAC and HOOS are distinguishing between patients who are reporting improvement and those who are reporting worsening of their condition.
View Figure 5
Figure 5: ROC Curve to determine how well/different WOMAC and HOOS are distinguishing between patients who are reporting improvement and those who are reporting worsening of their condition.
View Figure 5
The main purpose of this study was to translate and culturally adapt the Arabic version of HOOS and prove the validity and reliability of this translated score.
In order to establish the validity and reliability of the cross-cultural Arabic adaptation of the HOOS, the Arabic version of HOOS was compared to the efficacy and results of WOMAC questionnaire. There was moderate reverse correlation between WOMAC subscales and HOOS subscales, since their scores were in opposite positions (0 for WOMAC = no pain/0 for HOOS = extreme pain). It is important to note, however, that responsive changes of subscales of both questionnaires are very similar and the differences are not considerable.
However, Altman and Bland method was used to measure the level of agreement between WOMAC and HOOS. One of the best methods to measure the level of agreement between two measurement methods is Bland-Altman plot. According to Nilsdotter, et al. WOMAC subscales (Pain, Stiffness and Physical function) can be equivalent to three subscales of HOOS (Pain, Symptoms and Activity of daily living) [12,13]. Based on these assumptions, these three subscales of WOMAC and HOOS were compared to each other over time. The Bland-Altman plots indicated that 'Pain subscale' in HOSS is a great substitute for Pain subscale in WOMAC, since the within subject differences were statistically zero. The same condition was also valid for "Activity of Daily living" subscale in HOOS, which proved to have strong agreement with "Physical function" subscale in WOMAC [13,14]. However, when it comes to subscale "Symptoms/Stiffness", there is clearly a systemic bias between the two questionnaires, which indicate that Symptoms in HOOS are not a good substitute for "Stiffness" in WOMAC. It could be due to the fact that subscale "Stiffness" covers much narrower conditions than subscale "Symptoms", which could lead to discrepancies between them. The illustrated forest plots, and effect sizes, showed that HOOS scores was generally higher than WOMAC score, but this difference cannot be considered to be strong and relevant. Since ROC curve analysis and Bland & Altman method showed similar AUC, it could be concluded that HOOS and WOMAC are similar to explain at least two of the three conditions of patients. In a Receiver Operating Characteristic (ROC) curve the true positive rate (Sensitivity) is plotted in function of the false positive rate (100-Specificity) for different cut-off points. Each point on the ROC curve represents a sensitivity/specificity pair corresponding to a particular decision threshold [14-16].
There is a significant difference between the Arabic culture and the Western culture, especially in terms of the requirement to sit or squat in the tailor position, mostly for members of the geriatric population (the elderly people). Lifestyle practices that involve sitting and sleeping on the floor act as great risk factors for Total Hip Arthroplasty (THA) revision [6-9]. Because there are many cases of hip osteoarthritis in the Arab world, it is necessary to procure validated instruments that permits self-assessment of patients and can be used for comparison of studies on an international level. It is pertinent to state that HOOS has been cross-culturally adapted into Arabic and validated for Hip OA patients.
The THA Pain and Symptoms subscales had a visible ceiling effect. This can be understood because post-surgery pain relief contrasts with preoperative osteoarthritis patients experiencing various disabilities [11,17].
Comparisons between the internal consistency results and those documented in other language versions of the Hip Disability and Osteoarthritis Outcome Score were performed [6-10,12]. For ADL subscale, Cronbach's alpha was the highest (0.99 - physical function subscale), which is in line with past validation studies (0.94 for the French version, 0.96 for the Korean, and 0.98-0.95 for the THA/OA group - Dutch version) [10,12,13]. Internal consistency for symptoms subscale (pain & stiffness) was at a satisfactory level (0.99/0.97 respectively) also in line with other reports (0.75 for the Korean version, 0.95/0.94 in the Dutch version) [8-10].
The five subscales of HOOS had a high correlation with the SF36 BP subscale, which also presented in the Dutch validation [14,18]. The moderate correlation between the ADL of the HOOS and the pain subscales and the Nottingham Adjustment Scale - Japanese - Hip edition (NAS-J-HIP) acceptance subscale may be a reflection of the fact that the primary symptoms of hip osteoarthritis are ADL disability and pain. This agrees with Koyama et al. who believed that improvement of health-related QOL (Short Form 36) might be possible through pain control and by promoting acceptance [15,19,20]. However, there is need for further research to validate this point.
In our study, we observed a significant improvement in HOOS after THA, and thus could be valuable for evaluation of responsiveness. It is worth noting that higher score on WOMAC indicates greater disability, while patients with greater disability would score low on HOOS. This means that negative correlation between WOMAC and HOOS would prove that HOOS is a valid instrument for assessing hip disability. Patients with high scores on WOMAC had low scores on HOOS. This means that those who experience greater hip pain have higher scores on WOMAC, and lower HOOS.
The study has several limitations that could influence final interpretations. These include:
• Both groups do not have the same number of patients
• Few patients participated in the responsiveness testing
• Follow-up times for responsiveness testing had a wide range rather than a consistent time. This will be tackled in future studies no doubt
• Uneven distribution of samples. Samples may not be a proper representation of the Arabic population only including pre and post-surgery patients, and
• Limited comparisons to other language cross-cultural adaptations of hip outcome scores with respect to responsiveness to treatment with hyaluronic acid
Future studies will include cases with medical treatments such as this, with the goal of addressing the role of intra-articular hyaluronic acid applications in symptomatic hip joint osteoarthritis.
Arabic HOOS version may be a good diagnostic tool for patients with hip problems, but it is important to consider the differences in symptoms between both scores. We suggest that Arabic HOOS version should be modified in symptoms score to improve this test.