Impairment in patients with Duchenne muscular dystrophy (DMD) has been evaluated primarily by muscle fiber microscopy examination. Pathologic examination is limited by the choice of muscle and the invasiveness of muscle biopsy. Magnetic resonance imaging (MRI) of the muscle is a noninvasive method of evaluating muscle preservation.
To compare muscle MRI and clinical function in patients at different stages (from early to terminal stage) of DMD, and to evaluate the correlation between fatty infiltration grade on MRI and clinical functional scale.
Thirty-one boys with DMD, of mean age 7.76 ± 4.99 years, underwent evaluation of clinical functional score grades (scores 1-4) while undergoing muscle MRI of the lower leg, thigh and pelvis. Fatty infiltration grade of 31 muscles was assessed by T1WI MRI using the Mercuri scale (from 0 to 4). Spearman correlation analysis was performed to assess the correlation between T1WI fatty infiltration grade and clinical functional grade.
Seventeen muscles showed positive correlations between fatty infiltration grade on T1WI MRI and clinical function. The gluteus maximus, adductor magnus, and gastrocnemius muscles were the most representative, because they were involved during early stages of DMD and their shapes were easier to distinguish on MRI. The obturator internus, gracilis and sartorius muscles were rarely involved until the terminal stage of disease. Damage to these three muscles could be used to predict terminal stage. Fatty infiltration grade on muscle MRI corresponded to microscopic parameters, including a reduced number of muscle cells, arrangement disorder, and fatty and connective tissue infiltration.
The results of muscle MRI showed good correlation with clinical function in patients with DMD. Because muscle MRI is a reliable and non-invasive method of assessing muscle damage, MRI is useful in the diagnosis and follow-up of patients with DMD. The Mercuri scale, which measures fatty infiltration on T1WI MRI, is a convenient method of evaluating disease severity and progression.
DMD, MRI, Fatty infiltration, Clinical function
Duchenne muscular dystrophy (DMD) is an X-linked recessive inherited disease, with an incidence of 1 in 3500 newborn males. DMD is caused by mutations in the dystrophin gene, which is located on the X chromosome (Xp21) and codes for dystrophin, an important skeleton protein of the muscle cell membrane. DMD is characterized pathologically by a progressive loss of muscle fibers and their replacement with fat and connective tissue [1]. Clinically, DMD is characterized by progressive muscle weakness, which first develops in the proximal pelvic girdle and gradually extends to the distant extremities. DMD patients usually lose the ability to walk at age 12 years, and most die of respiratory failure and/or cardiac insufficiency at around age 20 years [2]. DMD is currently diagnosed by pathologic examination of muscle biopsy samples, as microscopic examination can assess muscle damage and infiltration of muscle cells by fat and/or connective tissue [3]. However, information on muscular pathology is limited to amount and location of the biopsy samples, with some muscles, such as the pelvis muscles, being too difficult to biopsy. Thus, this method cannot provide a comprehensive evaluation of macroscopic changes in all areas of all muscles.
Muscle MRI is a non-invasive method of evaluating patients with DMD. This method provides high-resolution images of soft tissue, and the ability to perform multi-slice imaging can result in the evaluation of multiple involved muscles, in contrast to biopsy. Muscle MRI can be used for repeated examinations and provides a comprehensive image of muscle group involvement and disease progression [4,5]. In this study, patients at different stages of DMD, from early to terminal stage, underwent muscle MRI to determine the dynamic changes in muscle MRI results. The correlation between the results of MRI of the lower legs and muscle biopsy were evaluated.
The study protocol was approved by the university ethics committee (ethical file number: 2012-269) and all subjects and their parents/guardians provided written informed consent prior to any study-related assessment.
This study enrolled 31 boys, of mean age 7.76 ± 4.99 years, diagnosed with DMD by clinical evaluation and gene test include next generation sequence (NGS) and multiplex ligation-dependent probe amplification (MLPA), and treated in the neurology department of our hospital between 2004 and 2013.
All patients were evaluated using a clinical functional score grades [6-8] (scores 1-4) at the time of their MRI or biopsy examination (if any). All 31 boys underwent lower leg, thigh and pelvic MRI. Fatty infiltration on T1WI MRI was evaluated by two experienced radiologists using the Mercuri scale (grade 0-4), as modified by Fischer [9] (Figure 1). Subjects were excluded if they were diagnosed with claustrophobia [10] or refused cooperation.
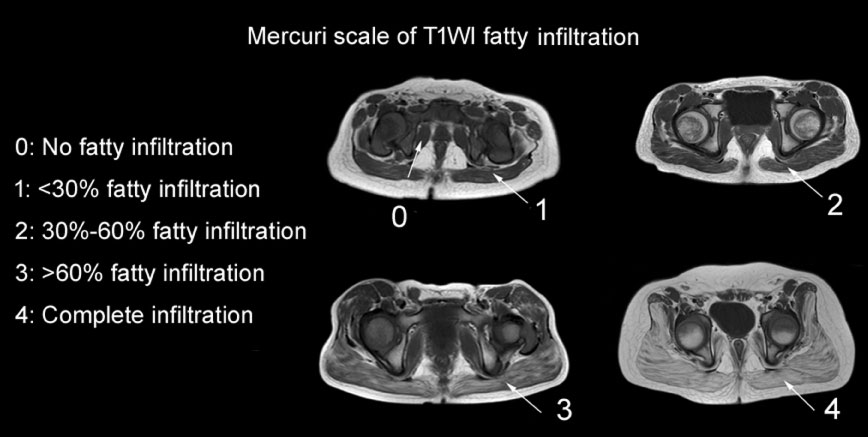 Figure 1: Pelvis slice images of muscular MRI T1WI fatty infiltration, showing grades 0-4, as assessed by the Mercuri scale modified by Fischer.
View Figure 1
Figure 1: Pelvis slice images of muscular MRI T1WI fatty infiltration, showing grades 0-4, as assessed by the Mercuri scale modified by Fischer.
View Figure 1
Clinical functional score grades are as follow [6-8]:
Score 1: Patients show presymptomatic stage which might developmental delay but no gait disturbance. Patients might be able to climb stairs without help.
Score 2: Patients show ambulatory stage which might be toe walking or walk with evidently wadding gait.
Patients can't climb stairs alone and Gower's sign can be found in this stage.
Score 3: Patients show early non-ambulatory stage which might be able to self propel for some time and maintain posture. Develop scoliosis might be occurred.
Score 4: Patients show late non-ambulatory stage which upper limb function and postural maintenance is increasingly limited.
Conventional MRI of the lower leg, thigh and pelvic muscles was performed using a 1.5-T MR scanner (Achieva 1.5T X-series; Philips Healthcare, Best, The Netherlands), equipped with a 32-channel torso coil. The parameters for axial T1 weighted images (T1WI) included sequence TSE-TR/TE, 500/18 ms; thickness, 5/0.5 mm; layers, 28; bandwidth, 250 kHz; resolution, 1.0 mm × 1.3 mm × 5 mm; and the parameters for coronal T2 weighted images (T2WI) included sequence TSE-TR/TE, 4000/100 ms; thickness, 5/0.5 mm; layers, 28; bandwidth, 135 kHz; resolution, 1.0 mm × 1.3 mm × 5 mm. The parameters for axial T2WI-spectral attenuated inversion recovery (T2WI-SPAIR) included sequence TSE–TR/TE, 3462/70 ms; thickness, 5/0.5 mm; layers, 28; bandwidth, 227.7 kHz; resolution, 1.0 mm × 1.3 mm × 5 mm. Thirty-one muscles were evaluated in each patient, including 12 pelvic muscles (gluteus maximus, gluteus medius, gluteus minimus, iliopsoas, piriformis, obturator internus, obturator externus, tensor fasciae latae, pectineus, erector spinae, greater psoas and iliacus), 11 thigh muscles (adductor magnus, gracilis, adductor longus, sartorius, rectus femoris, vastus internus, vastus medialis, vastus lateralis, biceps femoris, semitendinosus and semimembranosus) and eight lower leg muscles (gastrocnemius, soleus, hallux longus, posterior tibial, anterior tibial, extensor hallucis longus, extensor longus digitorum and peroneus longus).
All statistical analyses were performed using SPSS13.0 (SPSS, version 13.0; SPSS, Chicago, IL, USA) software. The correlation between T1WI fatty infiltration grade and clinical functional grade was evaluated by Spearman correlation analysis. P < 0.05 was considered statistically significant.
The walking ability of patients at this stage is well preserved, so that they can walk up and down stairs freely without help. T1WI MRI showed fatty infiltration grades of 1-2, with scattered or patchy high intensity T1WI signals observed in the muscles. Fatty infiltration of the gluteus maximus and adductor magnus muscles was observed (Figure 2).
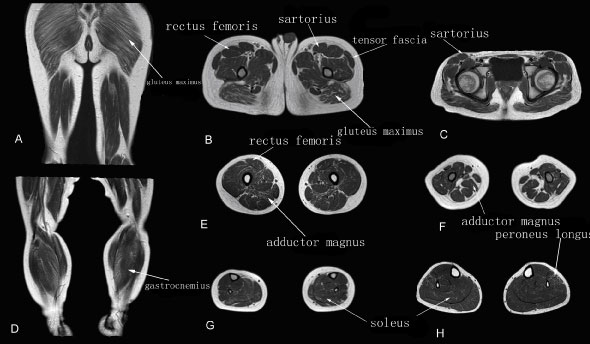 Figure 2: Muscle T1WI MRI in a patient with early stage DMD.
A-C: Muscle MRI of pelvis (A), thigh (B) and leg (C) muscles.
The gluteus maximus and adductor magnus muscles showed grade 2 fatty infiltration; the other muscles showed grade 1.
View Figure 2
The walking ability of patients in this group is impaired, as shown by as way gait. These patients were able to walk up and down stairs with assistance. Muscles of the same patients showed both severe and mild fatty infiltration, with T1WI MRI showing significant (maximum, grade 3) fatty infiltration of the gluteus maximus, adductor magnus and gastrocnemius muscles. The obturator internus, sartorius, gracilis, and posterior tibial muscles showed mild or no involvement (Figure 3).
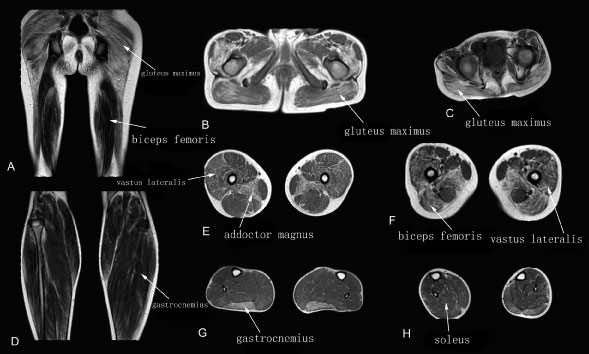 Figure 3: Muscle T1WI MRI in a patient with intermediate stage DMD.
A-C: Muscle MRI of pelvis (A), thigh (B) and leg (C) muscles.
The gluteus maximus, adductor magnus and gastrocnemius muscles showed grade 3 fatty infiltration; the vastus lateralis and biceps femoris muscles showed grade 2; and all other muscles showed grade 1.
View Figure 3
Patients at this stage had lost their ability to walk, as well as presenting with more serious fatty infiltration. Grade 3-4 of fatty infiltration of the muscles was more common on T1WI MRI. The gluteus maximus, medius, minimus, adductor magnus, and gastrocnemius showed the most severe fatty infiltration (usually grade 4 on T1WI MRI), followed by the vastus internus, vastus medialis, vastus lateralis, biceps femoris, soleus, tensor fasciae latae, pectineus, and erector spinae muscles. Grade 2-3 fatty infiltration of the obturator internus, sartorius, gracilis and posterior tibial muscles was also observed (Figure 4).
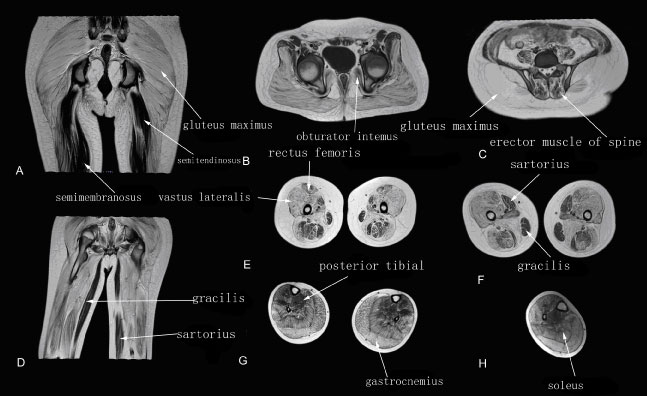 Figure 4: Muscle T1WI MRI in a patient with terminal stage DMD.
A-D: Muscle MRI of pelvis, thigh and leg muscles.
The T1WI fatty infiltration grade of the gluteus maximus, adductor magnus, vastus lateralis, vastus medialis, gastrocnemius and soleus muscles showed grade 3-4 fatty infiltration; the erector spinae, obturator internus, sartorius, gracilis, semitendinosus, semimembranosus, and biceps femoris muscles showed grade 2.
View Figure 4
A comparison of fatty infiltration grade on T1WI MRI and clinical function score grade of the 31 muscles (Table 1) showed positive correlations in 17 muscles. These were the gluteus maximus, gluteus medius, gluteus minimus, iliopsoas, piriformis, pectineus, adductor magnus, adductor longus, rectus femoris, vastus internus, vastus medialis, vastus lateralis, biceps femoris, gastrocnemius, posterior tibial, peroneus longus, and erector spinae muscles.
Table 1: Correlations between fatty infiltration grade on T1WI MRI and clinical function score grade. View Table 1
DMD is one of the most common inherited pediatric neuromuscular disorders [11]. DMD results from a defect in the dystrophin gene, which encodes the protein dystrophin, an important structural component of muscle. The absence of dystrophin from muscle results in the instability of muscle cell membranes, making muscles fragile and susceptible to injury during the course of repeated contractions [12]. Muscle damage and repair associated with inflammatory necrosis and edema are seen early in the disease process, followed by irreversible fatty infiltration late in the disease.
Muscle MRI is used to characterize fatty infiltration of the muscles, especially to evaluate stages of disease development [13,14]. Indicators of fatty infiltration of muscle tissue include high signal intensity on T1WI MRI and low/equal signal intensity on T2WI-SPAIR MRI [15]. Fatty infiltration of muscles is important in predicting the progression of DMD [9,16], with fatty infiltration of muscle fibers, as determined by Mercuri scoring, found useful in assessing disease severity and progression [17]. Our study found that during the early stages of DMD, when notable clinical symptoms are absent, some skeletal muscles, including the gluteus maximus and adductor magnus muscles, show high T1WI signal intensity on muscle MRI.
Pathological changes observed during the early stages of DMD include abnormally sized and rounded muscle fibers, nuclear center shifting, necrosis, phagocytosis, and regeneration [18,19]. Infiltration of inflammatory cells and adipose tissue into connective tissue result in hyperplasia of muscle bundles.
Patients at the middle stage of DMD show obvious weakness of pelvic girdle muscles. T1WI MRI showed severe (grade 3) fatty infiltration into the gluteus maximus, adductor magnus, vastus lateralis, and gastrocnemius muscles. Other muscles, including the obturator, sartorius, gracilis, and posterior tibial bone muscles, showed less severe fatty infiltration (grade 0-1) on T1WI MRI. Other studies also reported that muscles of patients at this stage appeared to have more fatty infiltration [20,21]. Patients at the terminal stage of DMD (clinical functional score 3-4) gradually lose the ability to walk and must use a wheel chair to maintain mobility. High T1WI signals were further increased and almost all muscles were involved. T1WI fatty infiltration grade of most muscles was ≥ 3. In our study, T1WI MRI findings of 17 muscles showed positive correlations with clinical functional score grade. These included seven pelvic muscles (i.e., the gluteus maximus, gluteus medius, gluteus minimus, iliopsoas, piriformis, pectineus, and erector spinae muscles), seven thigh muscles (i.e., the adductor magnus, adductor longus, rectus femoris, vastus internus, vastus medialis, vastus lateralis, and biceps femoris muscles), and three lower leg muscles (i.e., the gastrocnemius, posterior tibial, and peroneus longus muscles). Because the gluteus maximus (pelvis), adductor magnus (thigh), and gastrocnemius (lower leg) muscles showed early involvement, and because their shapes are easy to distinguish on MRI, T1WI MRI evaluation of these three muscles may be a non-invasive method of evaluating clinical function in patients with DMD. Moreover, the obturator internus (pelvis), gracilis and sartorius muscles (thigh) were rarely involved until the terminal stage of DMD, suggesting that T1WI MRI of these three muscles can predict clinical functional progression, including loss of ambulation.
This study had several limitations. First, the results were based on data from a relatively small number of subjects. Additional studies, involving more subjects, are needed.
In conclusion, muscle MRI could delay or reduce the need for muscle biopsy in patients with DMD, especially during follow up. Muscle MRI results may be noninvasive markers for clinical performance and for evaluating the results of therapy. Use of the Mercuri scale to measure fatty infiltration can be a convenient method of assessing disease severity and progression.