Frailty is an important geriatric syndrome and many efforts were made to measure and describe its properties, such as the Frailty Index (FI), clinical frailty and phenotype frailty. However, the majority of these measures were developed based on physical components. In the present study, a novel Neurocognitive Frailty Index (NFI) was developed by adapting FI components and adding several neurocognitive components to create a more comprehensive measure of frailty in the elderly.
Secondary analyses of the baseline cohort and the five-year follow-up of the Canadian Study of Health and Aging (CSHA), a longitudinal observational cohort were undertaken. Of the 10263 participants in this comprehensive intake assessment and 5-year follow-up, clinical and neuropsychological assessment measures were available for 1228 subjects.
A multivariate logistic regression was used to calculate probability of dementia as a binary outcome. Multiple linear regression was applied for the Modified Mini-Mental State (3MS) as a continuous variable. For those who died between CSHA-1(baseline) and CSHA-2 (five years follow-up), Cox proportional hazard model was used for estimation of 5-year survival. NFI was an independent predictor for those three outcomes factors. When both NFI and FI measures were included in each of the three multivariate analyses, only NFI was significant (p < 0.05).
NFI was strongly associated with cognitive changes over the 5-year period. Participants with a higher NFI score at baseline were at a greater risk of developing dementia and die within five years than people with lower NFI score. In contrast to the conventional approach (using FI), NFI can provide higher accuracy to predict outcomes.
Rapid demographical change in developing countries is much more than a transition. It is about increased health care utilization, dramatic vulnerability related to health changes, higher risk of institutionalization, and mortality. Chronological age is a very important factor in the aging process; however, people of the same chronological age are often dramatically different in their health, level of activity, quality of life, and survival. This evidence serves to guide researchers on how the aging process can be seen as an opportunity for appropriate intervention. Many efforts have been undertaken to quantify aging and it appears that the concept of frailty offers a promising approach. Frailty is an age-related vulnerability state created by a multidimensional loss of reserves for example energy, physical ability, cognition and general health. Elderly people who are frail are more prone to adverse outcomes than elderly people who are physically fit. Thus, health condition can be seen as increased vulnerability associated with adverse outcomes such as disability, falls, hospitalization, and death [1].
Despite the efforts to quantify the concept, there is currently no standardized definition of frailty in older adults or how it should be measured. Although there are many scales that have been developed to measure frailty. Most of these frailty measures have a common goal of predicting important outcomes such as: hospitalization [2,3], falls [3,4], institutionalisation [5], and death [6-8]. Mitnitski, et al. [9] developed one of the most clinically useful frameworks of frailty based on a number of quantifying deficits. Their Frailty Index (FI) can be calculated based on a mathematical model of the accumulation of deficits where a deficit can be any symptom, sign, disease, disability, or laboratory abnormality. Another index is phenotype frailty based on a pre-defined set of five criteria exploring the presence of five signs or symptoms (involuntary weight loss, exhaustion, slow gait speed, poor handgrip strength, and sedentary behaviour). In this index the number of criteria is categorised into a 3-level variable namely robustness (none of the criteria), pre-frailty (one or two criteria) and frailty (three or more criteria). The majority of studies to date have used the frailty concept as a proxy for physical fitness but surprisingly cognitive capability (mental health) received less attention in the studies with older adults [10].
It has been shown that physical and cognitive impairment commonly overlap in older adults, however, cognition is not included in the physical frailty phenotype in the Fried phenotype frailty [3]. It has also been shown that physical frailty is associated with cognitive impairment and dementia [11]. Some researchers have mentioned that other dimensions, such as cognitive status and psychological well-being, should also be taken into account to provide a better definition of the frailty syndrome [1]. As mentioned previously, the quantification of the cognitive domain could enhance the precision of frailty measurement [12]. Thus, by adding a cognitive component in the frailty index, this could enhance the capacity to develop a globally acceptable biological age index.
There is little understanding of the variability and mutual interaction in physical and cognitive change in relation to dementia and mortality and this approach could be useful in the prediction of dementia, by applying neuropsychological tests. However, the domains of cognition that should be included and interaction between those neuropsychological items and physical health (activity of daily living, general health and co-morbidities) need to be clarified.
The main goal of the present study is to fill this gap in the assessment of physical health and cognitive health of the elderly by developing a novel frailty measure namely the Neurocognitive Frailty Index (NFI). The objective of this study is to develop a new frailty index with both physical and cognitive dimensions, using the Canadian Study of Health and Aging (CSHA) dataset to identify key elements for the NFI. Regression models were used to compare the results of the NFI in predicting different outcomes. Finally, the assessment and validation strength of the NFI was compared with the frailty index to predict outcomes.
The initial frailty index [9], was determined from 40 variables, selected as representing a range of health conditions and disabilities. Many papers validated and compared the characteristics of the FI in comparison to the phenotype frailty and clinical frailty [13-16].
This study used the data set from the Canadian Study of Health and Aging (CSHA), a multi-center, prospective cohort study of physical and mental health in persons 65 years and older. In 1991, a representative population sample (N = 10263) of participants was drawn from provincial records. The CSHA-1 baseline dataset included an initial interview, which screened for self-rated health, chronic conditions (for example heart disease), functional ability (e.g. walking), dementia status, and cognition. In these analyses, the change in cognition, risk of dementia, and mortality at a 5-year follow-up (CSHA-2) were examined.
A self-administered risk factor questionnaire was completed at baseline and addressed demographic characteristics, lifestyle, and medical and family histories. Of those people who completed the 3MS at CSHA-1 (n = 10,057), only participants who both answered the risk-factor questionnaire (n = 8403) and either completed a clinical and neuropsychological test at CSHA-1 (n = 1873) were included. Finally 1228 participants were eligible but just 601 were cognitively normal at baseline and included in the analyses.
A multivariate logistic regression was used to calculate probability of dementia as a binary outcome. Multiple linear regression was applied for the Modified Mini-Mental State (3MS) as a continuous variable. For those who died between CSHA-1 and CSHA-2, Cox proportional hazard model was used for estimation of 5-year survival. Age and sex were entered as covariate in the 3 regression models.
The Neurocognitive Frailty Index (NFI) has two main components, which includes physical and cognitive variables. Thirty-four physical variables were selected from the CSHA-1 dataset at baseline in 1991. Binary variables were recoded, using the "0" to indicate the absence of the deficit, and "1" to indicate the presence of a deficit. Particularly in ADL and IADL items, data converted as score "1" for "can't do at all" or "with some help" denoting needed help, and we assigned a score of "0" for "without any help". The Self-rated Health Question "How is your health these days? Very good, pretty good, not too good, poor, very poor "was rated between "0" and "1". Each lower self-rating of health was coded to represent a larger deficit "very good = 0", "pretty good = 0.25", "good = 0.5", "poor = 0.75" and "very poor = 1". For variables with dichotomous response (general health), data coded into a score between "0" where no deficit is present and "1" where the deficit is present. Overall, physical component scores varied between zero "0" to thirty-four "34".
The CSHA neuropsychological assessment was done by using several appropriate tests in eight domains, as described in the CSHA website. These eight modules are representative of memory (Buschke Cued Recall [17], Wechsler Memory Scale: Information Subtest [18], Rey Auditory-Verbal Learning [19], Benton Visual Retention Test-R [20], Wechsler Digit Span [18], Working Memory [21]), abstract thinking (WAIS-R Similarities Test (short form) [18]), executive functioning (WAIS-R Digit Symbol Sub-test [18], Trail Making [22]), judgment (WAIS-R Comprehension (short form) [18]), aphasia (Tokens Test [23], Word Fluency [24], Boston Naming Test [25], Animal Naming [26]), apraxia (Clock Drawing [27], Gesture Execution [28]), agnosia (Buschke Visual identification [17]), and construction (WAIS-R Block Design (short form) [18]). Most of the psychometric properties of these measures are presented in the CSHA website.
Similarly, the cognitive component was recorded by recognizing an ordinal scale of variables. A straight forward recoding was done for the eight cognitive variables: short-term memory, long-term memory, verbal abstract thinking, judgment, aphasia, apraxia, agnosia, and constructional difficulty. It is important to mention that for some cognitive domains, such as memory, several neuropsychological subtests were collated in order to cover different areas of each domain.
A score was assigned a "0" for response "None", "1" for "Questionable", "2" for "Mild", "3" for "Moderate" and "4" for "Severe". There were eight variables in this component which means theoretically that a person could have a score between zero "0" to thirty-two "32".
This study is a secondary analysis of the Canadian Study of Health and Aging (CSHA). Table 1 describes the physical and cognitive variables and the cut-points included in the Neurocognitive Frailty Index (NFI). When each of the 42 variables are added together, the total score of NFI can range between zero "0" and sixty-six "66". Table 2 lists demographic details for the 1228 participants in the analysis cohort. As noted, 41.4% were male with a mean age of 80.8 (± 6.7). The mean NFI score was 7.33 (± 4.45) for 601 participants deemed "normal" at baseline and significantly different with the MCI and the AD group (in Age, Education, 3MS at base-line and follow-up, FI and NFI).
Table 1: Physical and mental variables and cut-points included in the Neurocognitive Frailty Index. View Table 1
Table 2: Demographic characteristics and cognitive status at baseline in cognitively normal subjects (n = 601) and MCI or AD subjects (n = 627). View Table 2
Figure 1 shows the distribution of the Neurocognitive Frailty Index, with a mean of 7.3 in the cognitively normal participants at baseline. Scatter plot of the Neurocognitive Frailty Index and 3MS at baseline and 3MS after 5-year follow-up show the association; NFI values tended to be lower in participants with higher 3MS scores. Spearman correlation between NFI and 3MS at baseline and follow-up are r = ̵ 0.31 (p = 0.01) and r = ̵ 0.33 (p = 0.01) respectively.
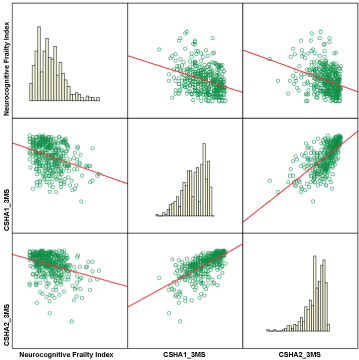 Figure 1: Distribution of Neurocognitive Frailty Index (NFI) and 3MS (diagonal). Off-diagonal Scatter plots are related to NFI and 3MS at baseline and 5-year follow-up.
View Figure 1
Figure 1: Distribution of Neurocognitive Frailty Index (NFI) and 3MS (diagonal). Off-diagonal Scatter plots are related to NFI and 3MS at baseline and 5-year follow-up.
View Figure 1
Figure 2 (Panel A) shows a positive association between age and NFI. Panel B is showing the same association in men and women. Thus, these results indicate that the NFI has the same property for both men and women.
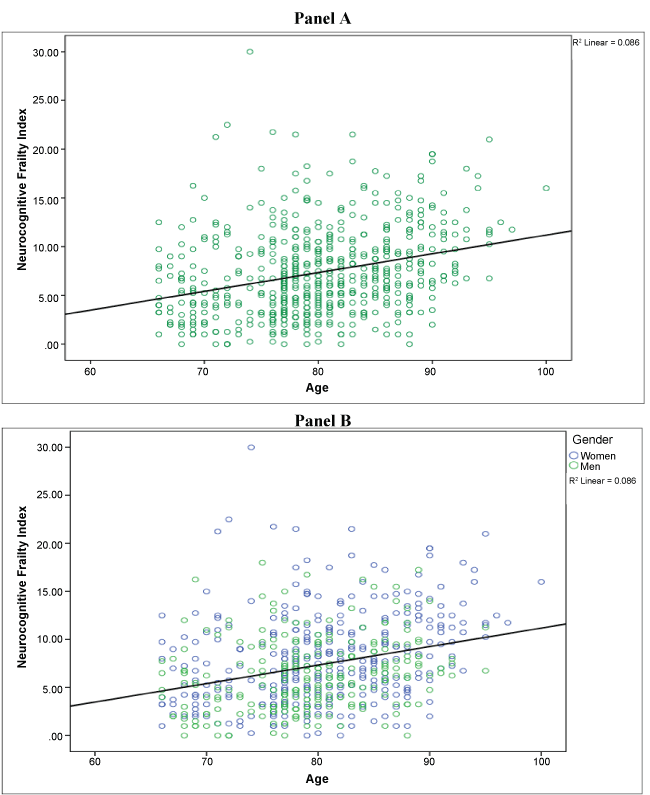 Figure 2: Association between age and Neurocognitive Frailty Index (NFI) in cognitively normal group (baseline) (Panel A), in women and men (Panel B).
View Figure 2
Figure 2: Association between age and Neurocognitive Frailty Index (NFI) in cognitively normal group (baseline) (Panel A), in women and men (Panel B).
View Figure 2
Table 3 describes three regression models that were used for each outcome. Multiple linear regressions were applied for cognitive change (using 3MS) in the model 1. In this analysis, age, sex and NFI were each significant predictors of cognitive change. Age showed a negative effect, meaning that a higher age correlates to a lower 3MS score. Males have an almost 5 point lower 3MS score compared to women, NFI showed a negative effect, which means a higher score on NFI has a lower 3MS score. Logistic regression was applied for model 2 in which NFI was significant with an odds ratio equal to 1.12, which indicates that participants with a higher NFI score have a higher chance of developing dementia. Finally, Cox regression was used for survival analysis, which indicated all these variables were significantly related to mortality. Moreover, when both NFI and FI measures were included in the three multivariate analyses, only NFI was significant (p < 0.05); all models were adjusted for age and gender.
Table 3: Result of 3 regression models to predict outcomes (3MS, Dementia, Mortality). View Table 3
Although, Canadians live longer, the process of aging affects one's health status and for the most part, these changes are not favourable. Because of this demographic change, there is a need to develop policies and plans to deal with this change. For example, in the USA the number of Americans living with Alzheimer's disease is growing and an estimated 5.5 million Americans of all ages have Alzheimer's disease in 2017 [29]. Whereas, the number of Canadians aged 85 and over increased from almost 200,000 in 1981 to 492,000 in 2005 and is projected to increase to 1,000,000 by 2031 [30]. Although prevalence of Alzheimer's disease is almost 3% for those aged 65 and over, this number will increase 10-fold and represent 33% for those over 85-years-old in the Canadian population. These numbers indicate why aging and related disorder such as Alzheimer's disease are a major concern for the developing countries [31].
The objective of the present study was to develop and validate the NFI. The major finding of the present study is that the NFI allows for the evaluation of both physical and mental health components which can be related to important outcomes. The present results indicate that participants with a higher NFI score have a higher chance of developing dementia and specifically a higher NFI score was associated to a higher risk of death. Additionally, the NFI is sensitive to detect even small changes in cognitive status.
Initially, it was clear to clinicians and researchers that an important part of frailty is not just in one's physical wellbeing but also in one's cognitive capacities. However, there was not a clear algorithm to assess this idea. Conflicting ideas regarding the definition of frailty, what criteria should be used for its recognition, and its relationships with aging, disability, institutionalization, chronic disease and death, was a big concern by researchers in this field [5,32,33]. Fortunately, the frailty index was introduced and was compared over time in different settings and populations. It helped us to make a framework to develop this new index. In fact, comparing and contrasting of FI was done so many times with other indexes including phenotype frailty and clinical frailty in very large sample size data, which guides us to consider frailty index as our framework to develop this new index.
However, the results of the present study suggest that in addition to physical capacity, frailty is also associated with cognitive and psychological symptoms. Surprisingly this approach did not get much consideration up to now. As Langlois and colleagues suggested, both cognitive and psychological symptoms should be taken into account to better encompass the complexity of the frailty syndrome [1]. It is also suggested that a multidimensional approach should be used to assess the impacts of intervention programs devoted to frail older adults [1]. The present study addressed this gap.
Nevertheless, our results must be interpreted with caution. This is a secondary analysis using the CSHA dataset, so prospective confirmation with a larger sample size in different sample would allow generalizing the present findings. In addition, the NFI is in a developmental stage and needs to be replicated in various settings, including different health settings, educational backgrounds or even different ethnicities. Although the CSHA dataset has a large, representative sample, it is limited by missing data that may exclude vulnerable participants. Moreover, the follow-up period was only 5 years and validation of this index needs to be examined for longer follow-up periods.
In conclusion, the NFI can be considered as a useful index to predict outcomes, which is simple to calculate and interpret. It has shown very good agreement with age and the FI. The most important outcomes in the elderly population such as dementia and mortality can be captured by the NFI very well. Little is known about the contribution of cognitive domains in improving patient-level prediction outcome using physical frailty, to our knowledge this study is the first to expand the frailty concept by including neurocognitive measures. Further studies examining the contribution of neurocognitive frailty in improving prediction patient outcomes are needed before adopting NFI as a prognostic tool.