As COVID-19 has spread from its origin in Wuhan, China, into a global pandemic, there has been a number of efforts to understand the mutations and clusters of genetic lineages of the SARS-CoV-2 virus. The high mutation rate and rapid spread makes this analysis capable of tracking chains of infections as well as putting individual sequences in context. So far, phylogenetic analysis methods have recently found a broader application in this regard. Here we demonstrate that Principal Component Analysis (PCA), used heavily in population genetics, corroborates the existing findings while providing unique new capabilities to understand our public repositories of complete virus sequences. This novel application of PCA is demonstrated on all publicly available SARS-CoV-2 samples from GenBank and other open-access databases until mid-April. We show that PCA is a useful and easy-to-use tool to analyze SARS-CoV-2 genomes in addition to phylogenetic analytics. It offers a previously untapped opportunity to analyze the dynamics of the current SARS-CoV-2 pandemic in a new way.
SARS-CoV-2, COVID-19, Principal Component Analysis, Next-Generation Sequencing
The COVID-19 pandemic is reaching historic proportions. We are dealing with an infectious disease that is caused by a novel coronavirus we discovered just recently. Since then, it has brought healthcare systems to the brink, it altered how we work, it changed how we socialize, and it impacted the world economy in a major way. COVID-19 has spread globally from its origin in Wuhan, China, within a short period of time [1]. From the very beginning of this pandemic, complete genome sequences of the SARS-CoV-2 genome have been collected from different locations and points in time. Early analysis has shown that three distinct strains of the virus have evolved while the virus spread globally into a pandemic [2]. As the tracking and management of patients with COVID-19 advances, the continued genomic analysis of these strains with correlation back to patients, their infection sources, and their clinical outcomes will inform better treatment and containment at the hospital and global level. The clinical implication leveraging Next-Gen Sequencing have also been discussed in [3-5].
While a global response has been mobilized to defeat the virus, there are currently no good solutions available. The current goal is to reach a sufficiently high level of immunization in the global population and to develop treatment options. In the meantime, we have to be efficient in diagnosing infections, isolating COVID-19 cases, and studying this virus by understanding its subtypes, epidemiology, routes of transmission, and clinical manifestation. Next-Generation Sequencing (NGS) can deliver significant insights into this process. Whole genomes of virus samples are being captured across the globe and shared through public databases. The analysis of these genomes allows for sequence level comparison and tracking of the virus as it mutates into different lineages while concurrently spreading globally.
There have been a few approaches to understand these lineages and their global distribution and change over time. So far, these have relied on phylogenetic analysis methods forming hierarchical trees in which informative mutations define the splitting of a branch into different sub-trees. These methods have been used to study prehistoric populations evolution based on sequences such as the Mitochondrial genome and Y chromosome [6,7]. They are versatile methods, and for example, have been employed on non-genetic data such as reconstructing language prehistory [8]. Forster, et al. was among the first to apply these phylogenetic methods to SARS-CoV-2. In a study published in March 2020, they were able to divide 160 SARS-CoV-2 sequences into 3 clusters, reflecting the degree of kinship to a suspected precursor betacoronavirus of a bat (2). Later, in a larger study, van Dorp et al. analyzed 7666 SARS-CoV-2 genomes deposited worldwide in GISAID and received a phylogenetic tree, which essentially also consists of three original main branches, each of which diversifies into larger and smaller junctions (16). Yet, there are reasons to consider a different method when analyzing larger sets of samples. Phylogenic networks are a type of hierarchical model, where a single variable, such as the presence or absence of a mutation, can be evaluated at a time. This evaluation continues in a tree-based manner, branching on one mutation and then another. The samples are thus partitioned fractally, making it difficult to understand the relationship between an individual and the whole. As we start to analyze thousands of SARS-CoV-2 genomes, the number of mutations grows to thousands, compounding this issue.
Principal Component Analysis has been employed in the field of population genetics to derive the underlying population structure, and genetic ancestry of individuals from commonly shared genetic mutations [9]. This method was originally designed to compensate for population stratification when analyzing genotypic data for specific traits, but it has also been employed successfully to place an individual of unknown ancestry within known ancestral clusters. In one landmark example, the PCA analysis of present-day Europeans resulted in a plot that nearly identically matched the geographic origins of individuals' ancestry when superimposed on a map of Europe [10].
The advantage of using a PCA analysis to cluster and study the evolution of the SARS-CoV-2 virus infections lies in consideration of the entire set of mutations. This results in a list of informative principal components, ranked by the eigenvalues corresponding to these principal components (eigenvectors).
By plotting the samples in a scatter plot from the top two or three ranked principal components, we can visualize the relationship of samples to each other in a 2D- or 3D-Plot, often finding clusters and bursts that represent the genetic lineage over time.
Complete genome sequences of the SARS-CoV-2 virus along with sample attributions such as the location and date of collection are being aggregated and shared by a number of institutions, including GenBank and other open-access Databases [11]. All publicly available sequences were downloaded at the time of analysis on May 18, 2020. After removing samples with genomes flagged as incomplete or low quality, the analyzed data set consisted of 1,501 genomes, of which 1,457 came from GeneBank, 21 from CNGBdb, 19 from Genome Warehouse, and 5 from NMDC. The curated country information was regrouped to continental area. Table 1 shows the most represented continental regions together with information about span of sample collection date.
Table 1: Geographical origin of samples and timespan of sample collection data. View Table 1
Analyzing the mutation pattern of the SARS-CoV-2 sequences requires comparing the complete sequences available to these public databases to a single reference genome. The reference sequence used is available under the NCBI Genome SARS-CoV-2 build ASM985889v3 resource, with GeneBank nucleotide identifier NC_045512.2 and RNA identifier MN908947.3 based on a sequence published in Nature paper that first identified the novel corona virus Wuhan, China [12].
Alignment of these long reads to this reference was performed by minimap2, a sequence alignment algorithm designed for the optimal alignment of long sequences from next-generation long-read such as PacBio and Oxford Nanopore [13]. These aligned reads needed to be adjusted to mark each as coming from a distinct sample instead of being from a single sample using a custom script. Next, the variations against the reference were detected and outputted to a VCF using the bcftools utility [14]. This resulted in 2,383 unique variants, 739 of which cause no change (synonymous) to annotated gene regions of the virus, 1454 missense that alter amino acid sequence and 35 insertion, deletions, and stop gains. Most variants occur in only one or two samples (1243 singletons and 251 doubletons).
To find our "principal components", we start with genotypic data from m markers and n samples and re-encode it to numeric data that represents the minor or alternate allele count for each genotype. Within each marker, we then subtract the marker's average data value from that marker's data, in order to "center the data by marker". We then find matrix X'X/m, where X represents the centered numeric data as an m by n matrix, X' means the transpose of matrix X, and X'X represents matrix multiplication. We then use established standard software libraries for linear algebra to determine the largest eigenvalues of X'X/m and the eigenvectors (or "principal components") corresponding to those largest eigenvalues.
While the values of the eigenvectors themselves for each sample have no meaningful units, they are able to place samples in relationship to each other. These relationships can be exampled in two or three dimensions visually by plotting the samples with the top two or three eigenvectors defining the X, Y, and Z coordinates. Visual identification of separation and clustering confirms that significant signal or total variance of the larger dimension space of all variants is being captured and explained by the principal components (eigenvectors v1 through v3 corresponding to the highest three eigenvalues λ1 through λ3). These clusters and relationships should survive the addition or removal of samples and can be used on an ongoing basis to label new samples to their corresponding cluster.
The 2D-plot of the first two principal components of the 1,501 samples shows a distribution pattern of three dominant divergent rays (a-c), starting from a center (see Figure 1). Virus sequences from Wuhan from December 2019 can be found in the center and along one of the dominant clusters marked b. In addition to the three main radial clusters, there is a fourth cluster (d) containing 34 genomes, 1 from Hongkong China collected in January and 33 from the U.S. collected between January and April. Because this cluster contains too few data points for further analysis, we focused further consideration on the three main clusters.
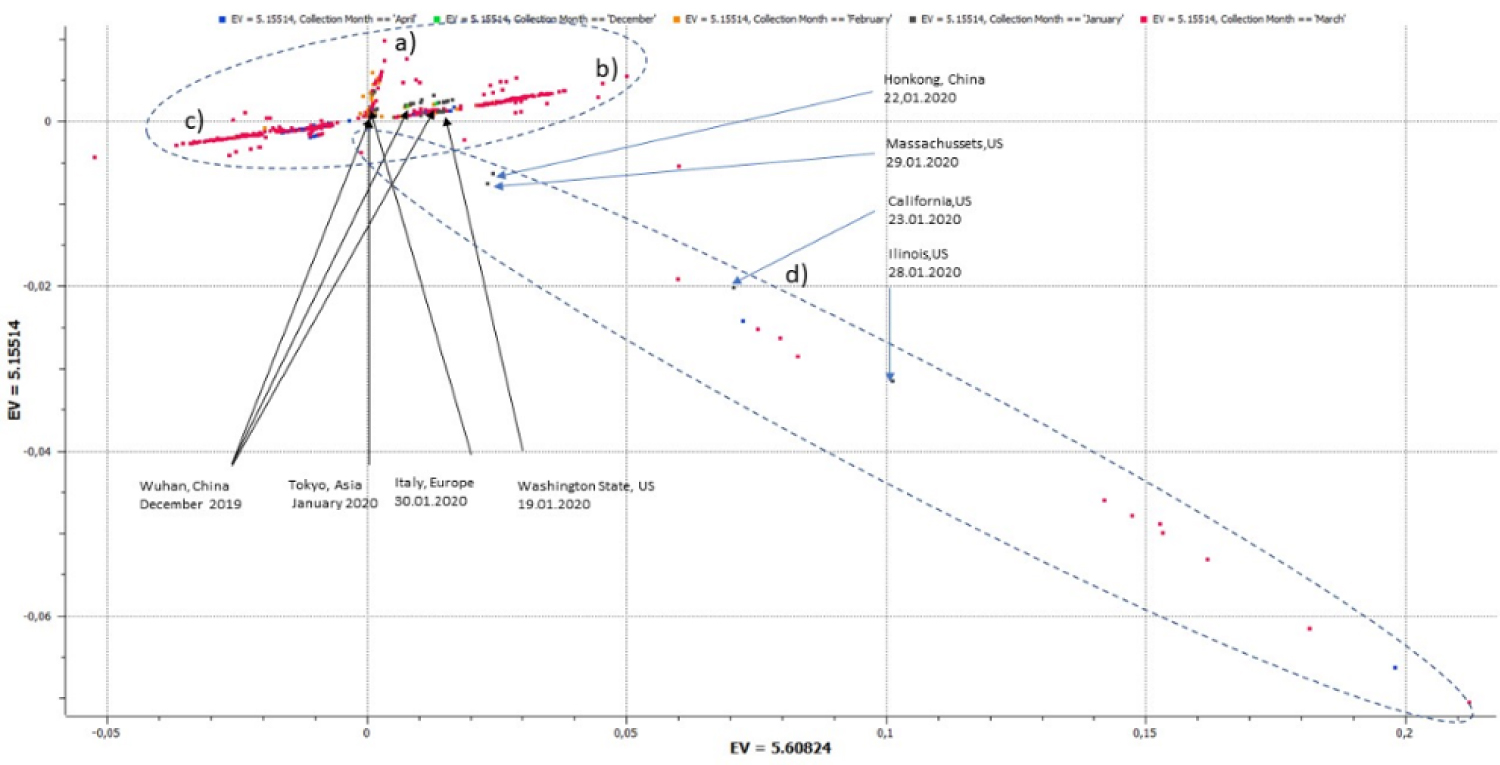 Figure 1: 2D-plot of the first two principal components of a data set of 1501 SARS-CoV-2 genomes. In addition to three main radial clusters, there is a fourth cluster containing 34 genomes (1 China/33 US).
View Figure 1
Figure 1: 2D-plot of the first two principal components of a data set of 1501 SARS-CoV-2 genomes. In addition to three main radial clusters, there is a fourth cluster containing 34 genomes (1 China/33 US).
View Figure 1
Figure 2 shows a 3D-plot that focuses on the representation of clusters a-b. Visualization of the third dimension, the third principal component, reinforces the impression that clusters radiate in each direction from a central point. Each cluster shows centrally data points of sequences from China, which corresponds to the basic pandemic distribution process. With the help of the PCA, however, the genome variations can now be tracked very easily in relation to each origin to be assumed.
 Figure 2: 3D-plot of cluster a-c with coloring of data points by continental origin. Each cluster shows centrally emphasized data points of sequences from China.
View Figure 2
Figure 2: 3D-plot of cluster a-c with coloring of data points by continental origin. Each cluster shows centrally emphasized data points of sequences from China.
View Figure 2
Since most samples (n = 1327) come from the United States, the results are particularly instructive for pandemic events in the United States. The U.S. data points are found in all three clusters. This suggests that entries in the United States have occurred at any time since the beginning of the pandemic and have evolved in the United States.
In a recent study, Fauver, et al. analyzed the coast-to-coast spread during the early epidemic in the United States using phylogenetic analysis of 9 Connecticut SARS-CoV-2 genomes obtained in early March. They interpreted these samples against the background of epidemiologically relevant key data from CDC reports and data on national and international airline itineraries. They concluded that early transmission in Connecticut was already caused by domestic transmissions and not by international introductions, and therefore called in their publication for better infection surveillance for the U.S., noting that the closure of flight routes to and from Europe was carried out on March 11, 2020, at a time when the risk of domestic contagion was already greater than by an international entry [15].
The first COVID-19 case hit the U.S. in January 2020 in Washington State, the Pacific Northwest region. The most recent CDC-confirmed community-associated COVID-19- case occurred in late February in California. By early March, COVID-19 cases were described in all 50 states [16].
Figure 3 shows the distribution pattern of the 63 SARS-CoV-2 genomes included in our dataset collected in the U.S. in January and February colored by time zone. By the end of February, all three clusters are already preformed with a weighting of cluster (a) and (b) in the Pacific coastal region and cluster (c) in the east coast region. The cases of a cruise ship from February 2020 can be found in Cluster (a).
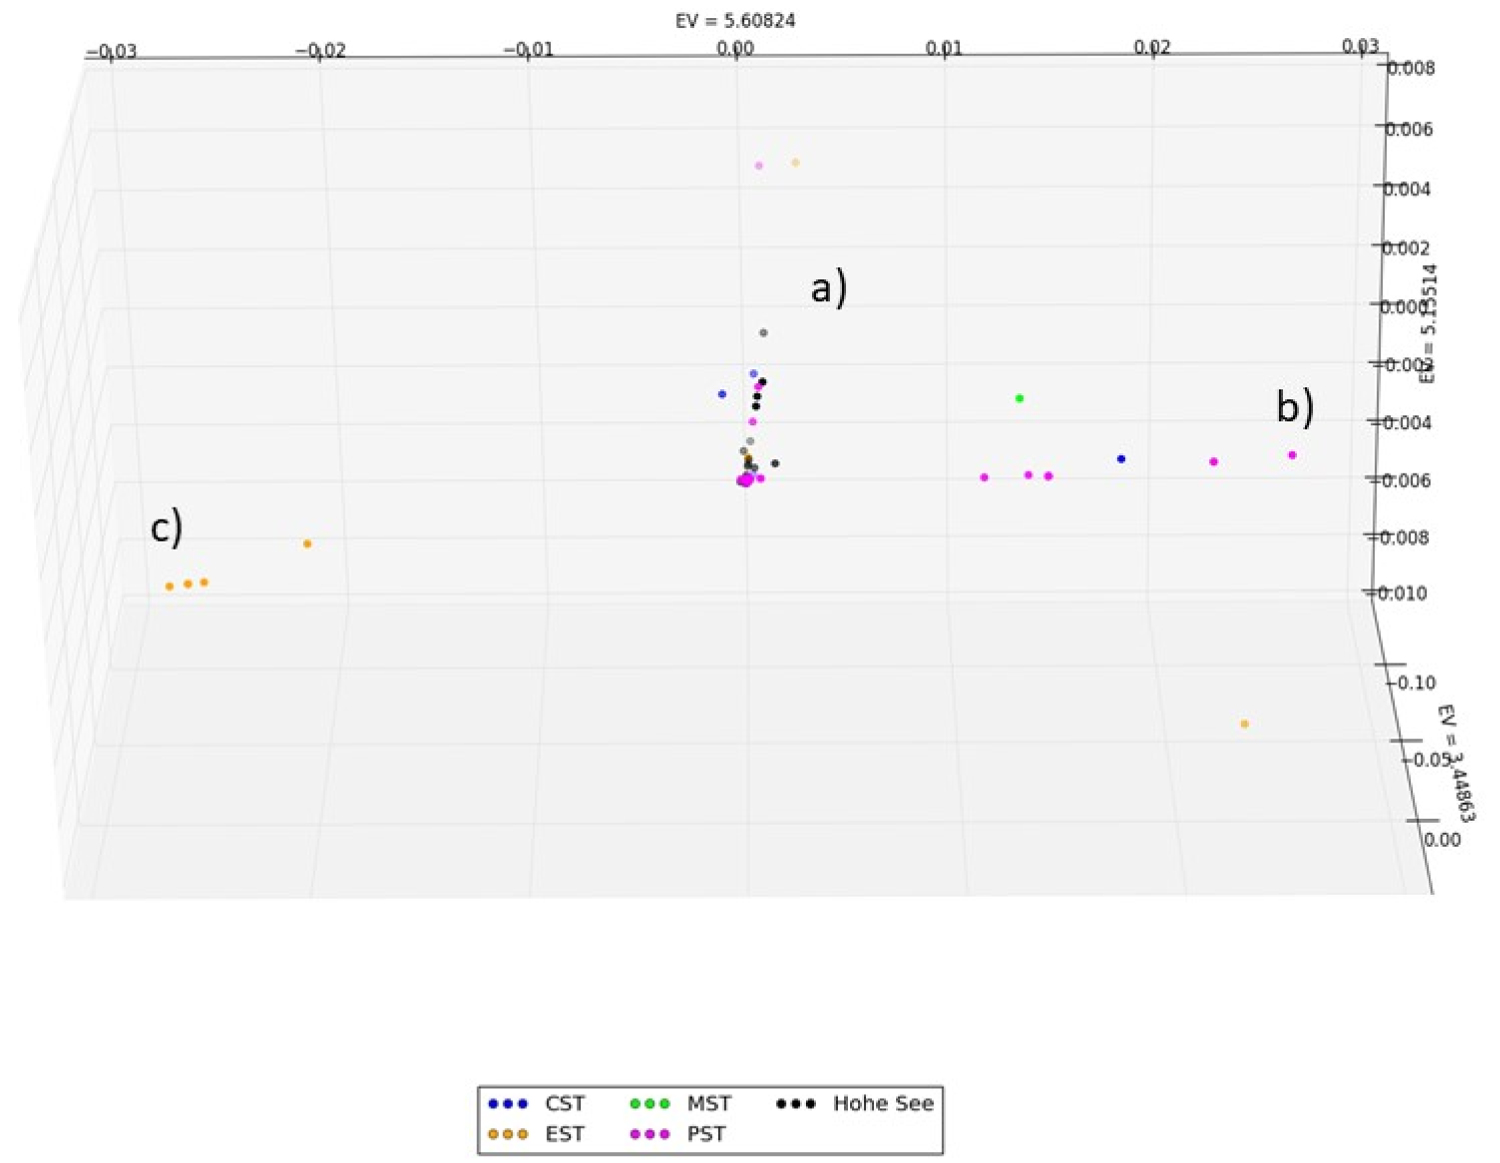 Figure 3: Distribution pattern of U.S. SARS-CoV-2 genomes collected in January and February colored by time zone. By the end of February, all three clusters are already preformed with a weighting of cluster (a) and (b) in the Pacific coastal region and cluster c in the east coast region. The cases of a cruise ship from February 2020 can be found in Cluster (a).
View Figure 3
Figure 3: Distribution pattern of U.S. SARS-CoV-2 genomes collected in January and February colored by time zone. By the end of February, all three clusters are already preformed with a weighting of cluster (a) and (b) in the Pacific coastal region and cluster c in the east coast region. The cases of a cruise ship from February 2020 can be found in Cluster (a).
View Figure 3
Figure 4 shows the distribution pattern of 1,295 U.S. genomes collected between January and April colored by time zones. The diagram shows a dominance of the data points of the Pacific region because about twice as many samples come from there (n = 763) than from the east coast (n = 366). However, it can be seen that the East and West Coast regions now show the same distribution pattern, which suggests that the initial international entries have spread via interstate transmissions throughout the U.S. region. In the event of a controlled eruption, the distribution patterns between the East Coast and the West Coast would have been expected to continue to differ.
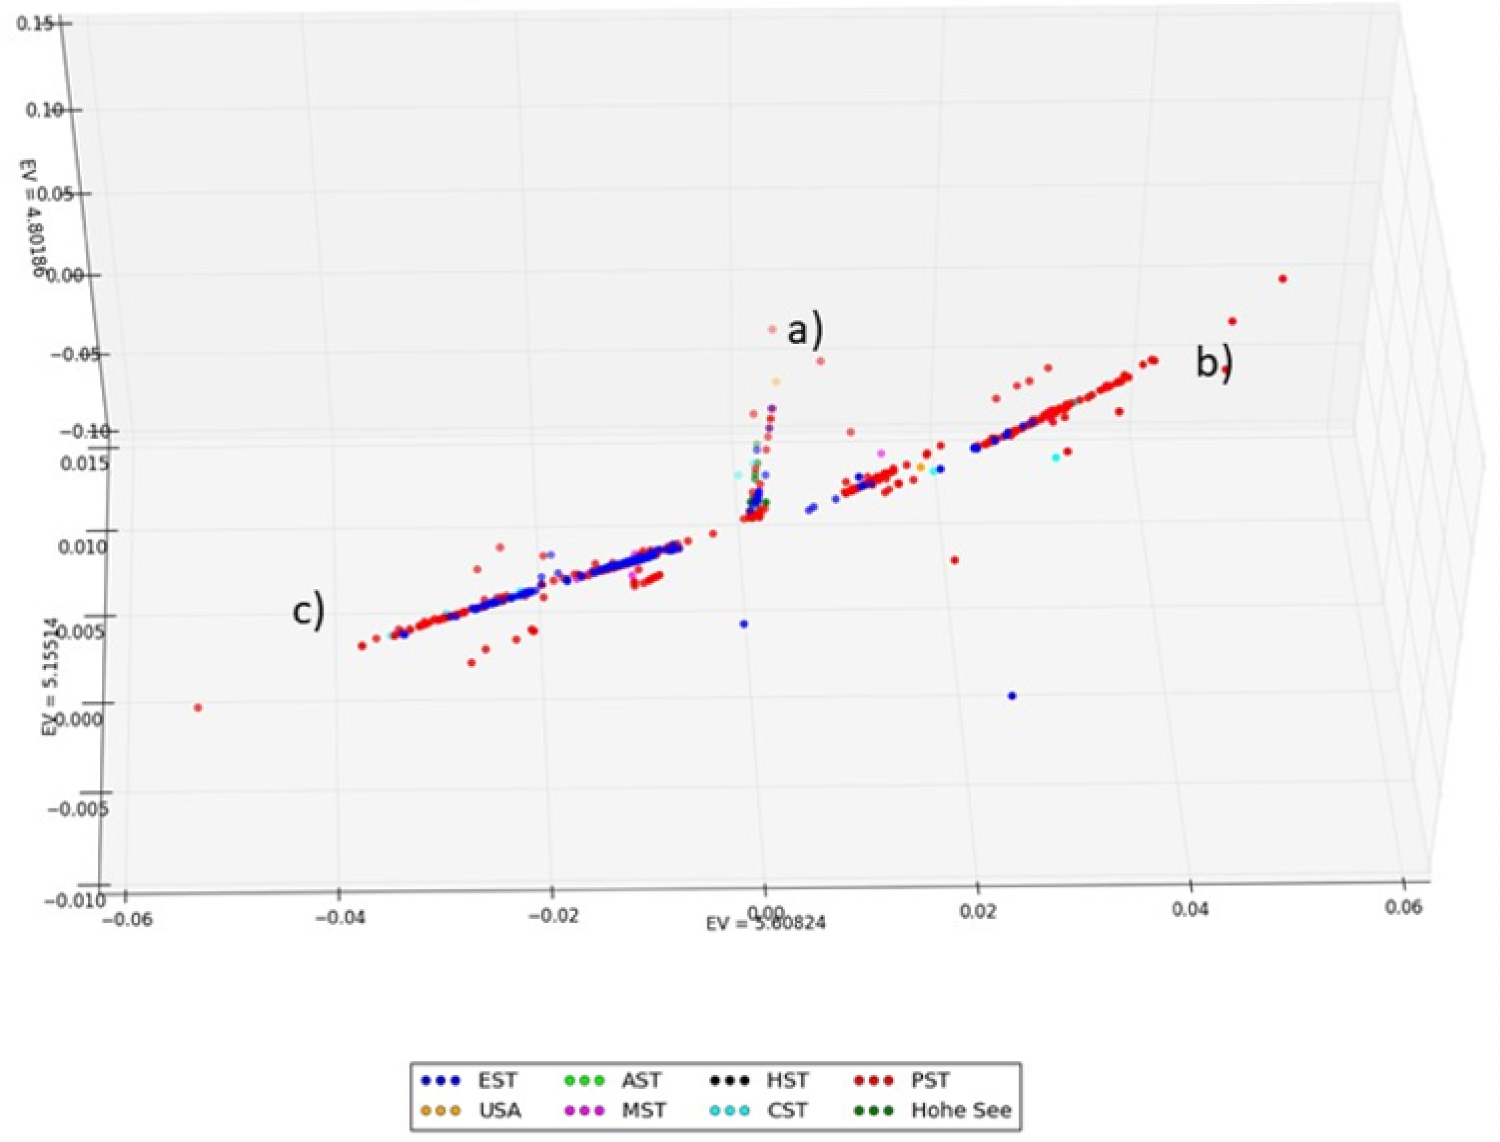 Figure 4: Distribution patterns of 1,295 U.S. SARS-CoV-2 genomes collected between January and April colored by time zones. The graph shows a numerical dominance of data points of the Pacific region (n = 763) over the east coast (n = 366). However, it can be seen that by March and April East and West Coast regions show the same distribution pattern into the clusters a-c.
View Figure 4
Figure 4: Distribution patterns of 1,295 U.S. SARS-CoV-2 genomes collected between January and April colored by time zones. The graph shows a numerical dominance of data points of the Pacific region (n = 763) over the east coast (n = 366). However, it can be seen that by March and April East and West Coast regions show the same distribution pattern into the clusters a-c.
View Figure 4
As with no other pandemic pathogen in history, the mutation dynamics of SARS-CoV-2 can be tracked simultaneously with its spread due to widely shared genomic data. And in no other pandemic before, it was possible to trace almost in real-time which virus variants are spreading particularly successfully, which gene locations change most frequently, and which remain stable. This opens up new dimensions for developing strategies to curb the pathogen, find treatment options, and assess targets for a vaccine. In this context, it is particularly important to have elegant and easy-to-use biomathematical methods to analyze these amounts of data in a meaningful way. We show that PCA is a useful, easy-to-use tool to analyze SARS-CoV-2 genomes in addition to phylogenetic analytics based on a maximum-likelihood tree.
It offers a previously untapped opportunity to analyze the dynamics of the current SARS-CoV-2 pandemic in a new way. We can confirm a high degree of diversity of SARS-CoV-2 genomes in the different countries, reflecting the adaptation processes of the virus to its new host. It is, therefore, crucial for future research under what circumstances, what changes are found. PCA can make an important contribution to the identification of novel clusters.