Pollution of aquatic ecosystems from anthropogenic activities has heightened in recent times and this has elicited national and international concern on the impacts on aquatic biota. This study investigated the genotoxic effects in C. nigrodigitatus from two polluted lagoons. Micronuclei (MN) test, as an index of chromosomal damage, is widely applied in field studies. The peripheral erythrocytes from C. nigrodigitatus were subjected to MN analysis and physicochemical parameters were evaluated following APHA standardized protocol. There were significant (p < 0.05) seasonal variations in water temperature, pH, dissolved oxygen (DO) and biochemical oxygen demand (BOD5) across sampling stations in both lagoons. The levels of DO and BOD5 were below permissible limits (FMEnv) in both lagoons. Cytogenetic analyses revealed a statistically significant (p < 0.05) in MN frequencies with 70.2% and 29.8%, while the nuclear abnormalities (NAs) observed an increased formation of 68.7% Binucleated cells (BN) and 31.3% BN; 60% of blebbed cells (BL) and 40% BL; 58.8% lobed cell (LB) and 41.2% LB in Ologe and Badagry lagoons respectively. MN and NAs induction increased in the order of frequencies; MN > BN > BL > LB in the peripheral erythrocyte of catfish from both lagoons. Pearson correlation showed negative significant induction (p < 0.05) with the frequencies of MN and BN induced by BOD and Conductivity in both lagoons. The induction of MN formation and nuclear abnormalities (NAs) in catfish are sensitive non-specific indicators for mutagenic damage, exposed to admixtures of chemical and organic compounds from Ologe and Badagry lagoons. Thus, micronucleus assay serves as a good biomarker for biomonitoring aquatic ecosystems.
Cytogenetics, Micronucleus assay, Chrysichthys nigrodigitatus, Polluted lagoons
Recently the development of sensitive biomarkers for monitoring environmental quality in aquatic ecosystems has raised a great deal of interest [1]. Among various cellular and physiological systems, certain nuclear cytoplasmic responses are considered as suitable biomarkers for monitoring the biological effects of pollution. Evaluation of micronucleus frequency in vivo is the primary test in a battery of genotoxicity tests and is recommended by the regulatory agencies around the globe to be conducted as part of product safety assessment. The assay, when performed appropriately, detects both clastogenicity (chromosome breakage) and aneugenicity (chromosome lagging due to dysfunction of mitotic apparatus).
The indiscriminate discharge of industrial effluent containing harmful substances (partially treated or untreated) such as metals has become a problem in the Nigerian coastal water, because of the negative impacts of these substances on human health. The deleterious effects on humans and the environment stem from the fact that many of the contaminants are non-biodegradable and thus bioaccumulate within man and other living organisms [2]. The continuous discharge of these deleterious substances, despite the existence of relevant legislation, has increased the number of researchers interested in evaluating the genotoxicity associated with polluted aquatic environments.
The micronucleus (MN) test is considered one of the most useful methods for evaluating genotoxicity in aquatic systems. Micronuclei are formed by both clastogenic and aneugenic compounds. Micronuclei are chromosome fragments or whole chromosomes that lag at cell division due to the lack of a centromere, damage, or defect in cytokinesis [3]. Fish are extremely valuable in toxicity monitoring as they accumulate hazardous compounds in their tissues, are directly or indirectly consumed by humans, and are capable of transforming xenobiotic compounds into carcinogenic and mutagenic metabolites [4,5]. Therefore, the piscine MN test has become popular [6-8]. Erythrocytes are the most commonly used cells in the piscine MN test; however, hepatocytes [9-12] also have been used.
The piscine MN test has been used for genotoxicity monitoring of aquatic ecosystems affected by different pollutant sources [8,13,14]. While using MN analysis to evaluate the genotoxicity of aquatic systems, three different approaches have been used: (1) Measuring micronuclei in wild fish caught in situ at study stations;(2) Measuring micronuclei in caged fish exposed in situ at study sites; and (3) Measuring micronuclei in fish exposed to water samples under controlled laboratory conditions. An inherent weakness of in situ studies using wild fish is the lack of true negative control. This problem is usually addressed by the selection of a clean reference area.
Lagoons, a home for a wide variety of fishery resources are subjected to many anthropogenic sources of contamination by their socio-economic importance and proximity to urban centres, heavy-industrial and use for several agricultural activities. Previous studies [15-20] revealed varying levels of contaminants in these ecosystems including heavy metals, pesticides and polycyclic aromatic hydrocarbons. These compounds can be absorbed and accumulated in the edible parts of lagoon biota, thus entering the human food chain and posing a public health problem. However, there is a paucity of information on the genetic stability of most edible aquatic biota from Ologe and Badagry Lagoons. Hence, cytogenetic studies are required to assess the environmental contamination of these ecosystems.
Ologe and Badagry Lagoons are situated within the Lagos Lagoon complex in Lagos state Nigeria. These Lagoons meet several socio-economic needs such as fishing, sand dredging, aquaculture and drainage for industries, towns and villages around the lagoon bordering it [15]. Water sample was collected using water sampler and fixed following standard procedures by APHA [21], while the fish (Chrysichthys nigrodigitatus) samples were collected using a trap basket slightly above the bottom of the lagoon, where the water was shallow at depth of 3.5 m from the eight (8) established stations in Ologe and Badagry Lagoons. The GPS locations of the two lagoons are presented in Table 1.
Table 1: Description of sampling Stations at Ologe and Badagry Lagoons. View Table 1
The peripheral blood smears were obtained through the blood using a serum imprint following dissection as described by [22,23]. The slides were then, air-dried for 24 h, fixed in methanol for 30 min, followed by 10 ml/L Giemsa (v/v) staining. A very thin smear of peripheral blood was made onto the pre-cleaned slide, separately from each blood sample. After fixation in methanol for 20 min, the slides were allowed to air-dry and then stained with 10% Giemsa solution for 20 min [24].
For the scoring of micronuclei, the following criteria were adopted from Fenech, et al., [25]; the diameter of the micronucleus (MN) should be less than one-third of the main nucleus; MN should be separated from or marginally overlap with the main nucleus as long as there is a clear identification of the nuclear boundary; and MN should have similar staining as the main nucleus. The frequencies of micronuclei in erythrocytes were detected under a binocular microscope using a 1000 × oil-immersion lens. Only cells with intact cellular and nuclear membranes were scored. The following criteria was used: (i) Micronuclei should be one-tenth to one-third the diameter of the main nucleus, (ii) They should be on the same plane of focus, (iii) They should have the same color, texture, and refraction as the main nucleus (iv) They should be clearly separated from the main nucleus.
Three slides per sample are recommended for preparation, in which 2,000 erythrocytes are analyzed under 1000 × objective and ocular lens, scored for the presence of both typical micronuclei and nuclear alterations manifested as changes in the normal elliptical shape of the main nuclei [26]. Therefore, the micronuclei test also accounts for nuclear abnormalities, as the occurrence of lobulated, segmented, and kidney aspect cells.
Nuclear abnormalities were classified according to Alimba and Bakare [24]. Blebbed nucleus (BL) presents a relatively small evagination of the nuclear membrane, which contains euchromatin. When the evaginations were larger than the blebbed nuclei and contained several lobes, it was considered as lobe nucleus (LB), while the Notched nucleus (NT) contains vacuoles and appreciable depth into the nucleus that does not contain nuclear materials. Binucleated cells are formed through a division of nucleus forming two nuclei within the cytoplasm.
Data are presented as mean ± standard error median (S.E.M). One-way analysis of variance (ANOVA) was used to determine the differences among various groups. The correlation coefficient was analyzed to ascertain the significant relationship between the Physico-chemical parameters and micronucleus as well as other nuclear abnormalities. While Duncan multiple range post-hoc tests were used to compare the level of significance (p < 0.05) of each sample collected at both Ologe and Badagry lagoons. All statistics for ANOVA and correlation were analyzed using SPSS v20. and PAST 3.18 software.
To evaluate the impact of industrial discharges and other anthropogenic activities on the water quality of Ologe and Badagry lagoons. Table 2 shows the mean variations in water temperature, DO, BOD, Conductivity of surface water and rainfall pattern with significant differences (p < 0.05) across stations and seasons in Ologe and Badagry lagoons during the study period. All examined parameters were within FMEnv permissible limit except for DO with mean values of 3.89 ± 0.18 in Ologe Lagoon and BOD (74.11 ± 0.88bc and37.54 ± 3.46a) in both lagoons. The T-Test revealed significant differences (p < 0.05) in the water quality parameters for pH, Salinity, Dissolved Oxygen, and Biochemical Oxygen Demand between the two Lagoons across the sampling period.
Table 2: Mean variations of the water quality parameters in Ologe and Badagry Lagoons. View Table 2
Micronucleus (MN): The mean MN frequency in the erythrocytes of C. nigrodigitatus ranged from 3.00-17.00. The lowest MN frequencies ranged from 3.00-9.00 and were observed in the wet season and the highest MN frequency ranged from 10.0-17.00 in Ologe lagoon. The lowest MN frequencies ranged from 0.00-4.00 was observed in the wet season and the highest MN frequency ranged from 1.0-4.00 in Badagry lagoon as presented in Figure 1. Analysis of variance (ANOVA) in the frequency of micronucleus increased significantly (p < 0.05) in the erythrocyte of C. nigrodigitatus observed predominantly during the dry season in Ologe lagoon. While at Badagry lagoon, there was no significant difference (p > 0.05) in the erythrocyte of the C. nigrodigitatus in both seasons. The correlation relationship between MN and BN indicated positive significant (r = 0.999, p < 0.01) induction in the erythrocyte of the fish.
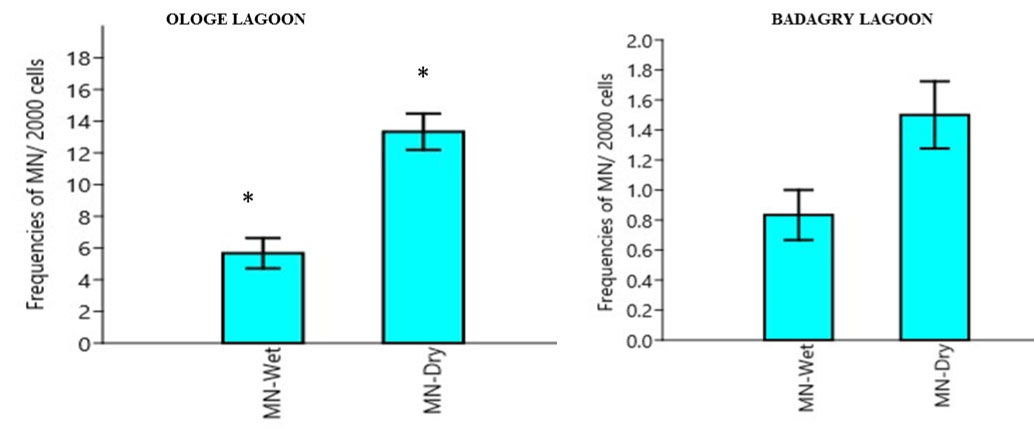 Figure 1: Mean seasonal variation in frequencies of Micronuclei cell in the erythrocyte of C. nigrodigitatus in the Ologe and Badagry Lagoons. (*) indicates significant difference (p < 0.05).
View Figure 1
Figure 1: Mean seasonal variation in frequencies of Micronuclei cell in the erythrocyte of C. nigrodigitatus in the Ologe and Badagry Lagoons. (*) indicates significant difference (p < 0.05).
View Figure 1
Binucleated induction (BN): The mean binucleated BN frequency in the erythrocytes of C. nigrodigitatus ranged from 2.00-10.00. The lowest BN frequencies ranged from 2.00-5.00 was observed in the wet season and the highest BN frequency ranged from 6.0-10.00 in Ologe Lagoon. The lowest BN frequencies ranged from 0.00-2.00 was observed in the wet season and the highest BN frequency ranged from 1.0-3.00 in Badagry lagoon as presented in Figure 2. Analysis of variance (ANOVA) in the frequency of binucleated increased significantly (p < 0.05) in the erythrocyte of C. nigrodigitatus observed in both seasons in Ologe and Badagry lagoon. The correlation relationship between MN and BN indicated positive significant (r = 0.999, p < 0.01) induction in the erythrocyte of the fish.
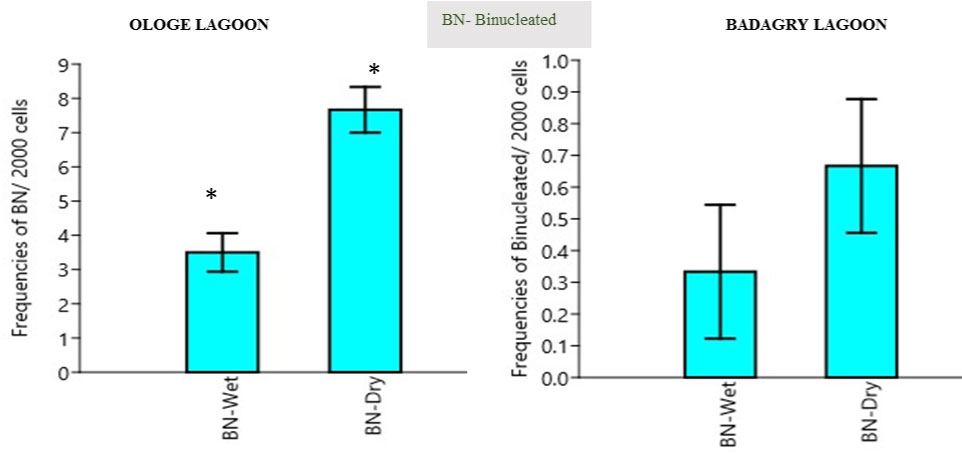 Figure 2: Mean seasonal variation in frequencies of binucleated nuclei in the erythrocyte of C. nigrodigitatus at the Ologe and Badagry Lagoons. (*) indicates significant difference (p < 0.05).
View Figure 2
Figure 2: Mean seasonal variation in frequencies of binucleated nuclei in the erythrocyte of C. nigrodigitatus at the Ologe and Badagry Lagoons. (*) indicates significant difference (p < 0.05).
View Figure 2
Lobed induction (LB): The mean lobed nuclei (LB) frequency in the erythrocytes of C. nigrodigitatus ranged from 0.00-2.00. The lowest LB frequencies ranged from 0.00-2.00 was observed in the wet season and the highest LB frequency ranged from 0.0-2.00 in Ologe lagoon. The lowest LB frequencies ranged from 0.00-2.00 was observed in the wet season and the highest LB frequency ranged from 0.0-3.00 in Badagry lagoon as presented in Figure 3. Analysis of variance (ANOVA) in the frequency of lobed nuclei decreased significantly (p > 0.05) in the erythrocyte of C. nigrodigitatus observed in both seasons in Ologe and Badagry lagoon.
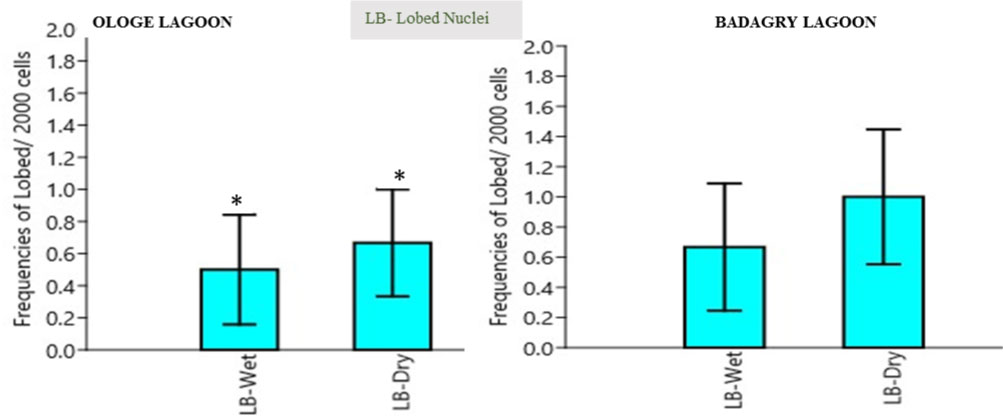 Figure 3: Mean seasonal variation in frequencies of lobed nuclei in the erythrocyte of C. nigrodigitatus at the Ologe and Badagry Lagoons. (*) indicates significant difference (p < 0.05).
View Figure 3
Figure 3: Mean seasonal variation in frequencies of lobed nuclei in the erythrocyte of C. nigrodigitatus at the Ologe and Badagry Lagoons. (*) indicates significant difference (p < 0.05).
View Figure 3
Blebbed induction (BL): The mean blebbed nuclei (BL) frequency in the erythrocytes of C. nigrodigitatus ranged from 0.00-2.00. The lowest BL frequencies ranged from 0.00-2.00 was observed in the wet season and the highest BL frequency ranged from 0.0-2.00 in Ologe lagoon. The lowest BL frequencies ranged from 0.00-2.00 was observed in the wet season and the highest BL frequency ranged from 0.0-3.00 in Badagry lagoon as presented in Figure 4. Analysis of variance (ANOVA) in the frequency of blebbed nuclei decreased significantly (p > 0.05) in the erythrocyte of C. nigrodigitatus observed in both seasons in Ologe and Badagry lagoons. The biological endpoints of cytotoxicity revealed increased frequency induction of 70.2% for MN and 68.7% for NA in Ologe lagoon, while decreased frequency induction of 29.8% for MN and 31.3% for NA inductions in the erythrocyte of C. nigrodigitatus in Badagry Lagoon.
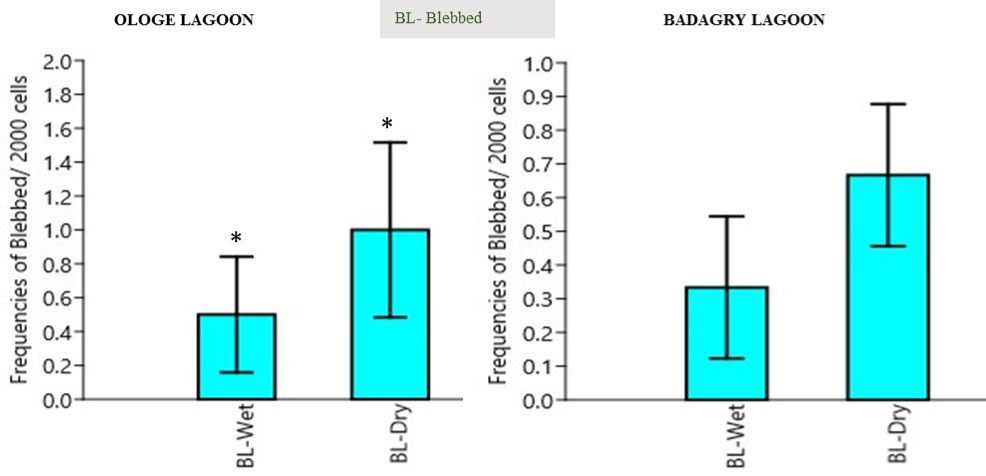 Figure 4: Mean seasonal variation in frequencies of blebbed nuclei in the erythrocyte of C. nigrodigitatus at the Ologe and Badagry Lagoons. (*) indicates significant difference (p < 0.05).
View Figure 4
Figure 4: Mean seasonal variation in frequencies of blebbed nuclei in the erythrocyte of C. nigrodigitatus at the Ologe and Badagry Lagoons. (*) indicates significant difference (p < 0.05).
View Figure 4
The seasonal variations of MN induction in erythrocyte observed high percentage frequency during the dry season with 62.50% and 26.56% in the wet season in Ologe lagoon, while MN of 7.03% and 3.91% were observed in both dry and wet seasons at Badagry lagoon. For BN induction, the highest was also observed in the dry and wet seasons with 63.01% and 28.77% in Ologe lagoon, while 5.48% and 2.74% in Badagry lagoon. While lobed nuclei abnormalities recorded 35.29% and 23.53% in dry and wet season at Badagry lagoon and 23.53% and 17.65% in dry and wet season at Ologe lagoon. The blebbed nuclei observed 40.0% and 20.0% in the dry and wet season at the Ologe lagoon, while 26.67% and 13.33% in the dry and wet season at Badagry lagoon.
Photomicrographs of Micronucleated cell and other nuclear abnormalities: The observed cytogenetic damage in the erythrocyte of C. nigrodigitatus from Ologe and Badagry lagoons are presented in the photomicrograph of Figure 5.
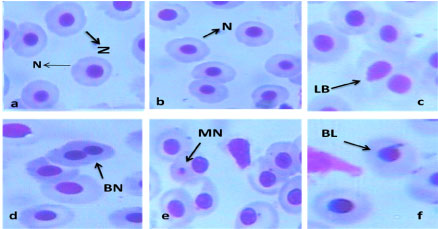 Figure 5: Photomicrograph of a) Normal nucleus; b) Micronucleated, and nuclear abnormalities; c) Binucleated cell; d) Lobed cell, and e) Blebbed cell (x100 Magnification) in the erythrocyte of C. nigrodigitatus.
View Figure 5
Figure 5: Photomicrograph of a) Normal nucleus; b) Micronucleated, and nuclear abnormalities; c) Binucleated cell; d) Lobed cell, and e) Blebbed cell (x100 Magnification) in the erythrocyte of C. nigrodigitatus.
View Figure 5
The correlation coefficient showed strong negative correlation with significant difference (p < 0.05) between conductivity and MN (r = -0.955*), BOD and MN (r = -0.967*) as presented in Table 3, while Table 4 revealed a strong positive correlation with a significant difference (p < 0.05) between BOD and BN, BL (r = 0.967*). The saline content and other chemical compounds enhance the charged ions (conductivity) of the Ologe lagoon to negatively induce micronucleus cells in the fish.
Table 3: Correlation coefficient of Physico-chemical parameters with micronucleus and other nuclear abnormalities peripheral erythrocyte of C. nigrodigitatus in Ologe Lagoon. View Table 3
Table 4: Correlation coefficient of Physico-chemical parameters with micronucleus and other nuclear abnormalities peripheral erythrocyte of C. nigrodigitatus in Badagry Lagoon. View Table 4
The cytogenetic induction in Chrysichthys nigrodigitatus as an indicator of environmental stressors was assessed in Ologe and Badagry Lagoon. Micronucleus bioassay offers several types of unique information as a biomarker for chromosomal aberrations not available from other methods: (1) The integrated effect of a variety of environmental stresses on the health of an organism and the population, community, and ecosystem; (2) Early warning of potential harm to human health based on the responses of wildlife to pollution; and (3) The effectiveness of remediation efforts in decontaminating waterways [27].
The micronuclei frequencies may vary according to the season, the kind of pollution involved, and the species of fish. The increased frequency of micronuclei in the erythrocytes observed in this study can be attributed to the environmental component (contaminants) which affects the water quality. The water quality parameter exhibited a significant negative correlation (r = -0.967*, p < 0.05) BOD with MN, as well as Conductivity and MN (r = -0.955*, p < 0.05) in Ologe lagoon, while BOD and BN, as well as BL, showed positively significant correlation (r = 0.967*, p < 0.05) in Badagry Lagoon respectively. This is supported by Obe, et al. [28] who revealed the fact that the presence of heavy metals and altered water quality parameters significantly increases DNA damage, principally by inducing single-strand breaks that could initiate double-strand breaks, as result of the inactivation or alteration of repair mechanisms.
Fish serve as a useful genetic model for the evaluation of pollution in aquatic ecosystems. The erythrocyte micronucleus test has been used with different fish species to monitor aquatic pollutants displaying mutagenic features [29]. The results of this study showed a significant increase of MN (70.2%) and BN (68.7%) in Ologe lagoon compared to Badagry lagoon with MN (29.8%) and BN (31.3%), which suggest the level of pollution from high industrial activities around Agbara region of the Lagoon. This is in accordance with the finding of Fagr, et al. [22], stating that the micronucleus assay is a sensitive monitor for aquatic pollution. The obtained results demonstrated that fish inhabiting polluted aquatic ecosystems has the potential for greater frequencies of micronuclei.
The frequency of micronuclei in the erythrocyte of C. nigrodigitatus significantly (p < 0.05) increased at Ologe lagoon with seasonality, as compared to Badagry Lagoon which decreased (p > 0.05), as indicative that the Badagry Lagoon is less polluted to compared to Ologe Lagoon, a highly polluted ecosystem. The highest observed micronuclei were during the late dry season and low in the early wet season. The action of any chemical genotoxic agent may give rise to an increase in micronucleus frequency as observed in the Ologe lagoon. Consequently, based on the fact that spontaneous formation of micronuclei is normally low and nearly uniform among species in environmental monitoring, micronucleus assaying has emerged as a simple, inexpensive and rapid method for detecting genotoxic effects [30].
Multiple mechanisms of action of many genotoxic substances led to the formation of MN and nuclear abnormalities in the erythrocytes of C. nigrodigitatus in Ologe and Badagry lagoons. MN frequency provides a useful index of accumulated genetic damage during the lifespan of the cells. Therefore, the formation of MN and other nuclear abnormalities in C. nigrodigitatus relatively depends on the mitotic activity, which in turn depends on a complex interaction of biotic and environmental parameters from Ologe and Badagry lagoons.