Inhaled cerium oxide (CeO2) nanoparticles have been shown to be capable of translocation to the liver where they can cause dose dependent toxic effects [1]. Herein, we investigate if the deposition of cerium in the liver is linked to increased oxidative stress and cellular apoptosis. Specific pathogen free male Sprague-Dawley rats were instilled with either vehicle (saline) or CeO2 nanoparticles (7.0 mg/kg) and euthanized 1, 3, 14, 28, 56, or 90 days post exposure. Liver samples were evaluated for evidence of ceria deposition, oxidative stress and apoptosis. Inductively coupled plasma mass spectroscopy demonstrated that ceria deposition increased over time. Analysis of lipid peroxidation, superoxide levels and the number of TUNEL positive cells revealed evidence of increased oxidative stress and apoptosis at 1, 3 and 90 days post exposure. Immunoblotting showed that each of these time points were characterized by increases in the Bax/Bcl-2 ratio, elevations in caspase-9 protein levels and increases in caspase-3 protein expression. Interestingly, we found no evidence of oxidative stress or apoptosis at day 14, 28, or 56 post exposure. Taken together, these data demonstrate intratracheal instillation of CeO2 nanoparticles is associated with increased liver ceria deposition, which causes biphasic oxidative stress and apoptotic response.
Cerium oxide nanoparticles, Bioaccumulation, Hepatic toxicity, Oxidative stress, Lipid peroxidation and apoptosis
CeO2 nanoparticles have been used as catalysts to increase fuel efficiency of automobile engines and to reduce particulate emissions from the incomplete combustion of fuels [2]. Recent data suggest CeO2 nanoparticles may have biomedical use as scavengers of reactive oxygen species (ROS) to protect against cardiomyopathy [3], neuronal toxicity [4] and radiation damage [5]. Although research shows biomedical benefits of CeO2 nanoparticles, their potential toxic effects are not well understood. In vitro studies using the human bronchoalveolar carcinoma cell line (A549) and lung epithelial cell lines (BEAS2B) demonstrated CeO2 nanoparticles (20 nm) reduced cell viability and induced oxidative stress [6]. In vivo studies using male Sprague-Dawley rats have shown that intratracheal instillation of CeO2 nanoparticles (20 nm) caused oxidative stress and apoptosis in pulmonary tissues [7]. Using this same model, Nalabotu SK, et al. [1] determined intratracheally instilled CeO2 nanoparticles traveled from the lungs and caused liver toxicity in a dose-dependent fashion [1].
Similarly, other work has shown that inhaled nanoparticles such as silver, silica, copper, gold, titanium dioxide, and zinc oxide nanoparticles enter into systemic circulation and cause apoptosis in the liver [8-11]. Additional studies revealed nanoparticle exposure is associated with increased production of ROS [12]. ROS generation is linked to membrane damage, cellular apoptosis, and is known to activate the mitogen activated protein kinase (MAPK) pathways which are important mediators of cell survival, differentiation and apoptosis [13]. It is unclear if an increase in oxidative stress and apoptosis in the liver is triggered by intratracheal instillation of CeO2 nanoparticles.
The purpose of this study was to investigate the role CeO2 nanoparticle exposure plays in hepatic toxicity induced by the activation of oxidative stress and apoptotic protein signaling in the liver. We hypothesized intratracheal instillation of CeO2 nanoparticles leads to bioaccumulation of cerium in the liver and promotes the generation of ROS, induces oxidative stress, and activates apoptotic protein signaling in the liver. Taken together, our data suggest intratracheal instillation of CeO2 nanoparticles correlates with accumulation of cerium in the liver, and as a consequence, causes hepatic biphasic oxidative stress and apoptosis.
CeO2 nanoparticles, 10% weight in water (average diameter at ~20 nm), were obtained from Sigma-Aldrich (St. Louis, MO, USA) as previously outlined [7]. Normal saline was used as the vehicle to suspend nanoparticles prior to instillation. Diluted nanoparticle suspensions were filtered, sputter coated, and examined with a Hitachi Model S-4800 field emission scanning electron microscope (Schaumburg, IL, USA) at 5 and 20 kV or placed on a formvar-coated copper grid to dry and imaged with a JEOL 1220 transmission electron microscope (Tokyo, Japan).
All procedures were performed in accordance with the Marshall University Animal Care and Use Committee guidelines, using the criteria outlined by the Assessment and Accreditation of Laboratory Animal Care (AAALAC). A total of 72 Five-week-old, Specific pathogen-free, male Sprague-Dawley (Hla: SD-CVF) rats weighing between 150 and 174 g were purchased from Hilltop Lab Animals, Inc. (Scottdale, PA, USA). Rats were housed two per cage in an AAALAC approved vivarium with a 12-h light-dark cycle. Housing temperature was maintained at 22 ± 2 ℃ and the animals were given access to food and water ad libitum. All animals were allowed to acclimatize for two weeks before initiation of any treatment or procedures. All animals were examined for precipitous weight loss, failure to thrive or unexpected gait. Periodic weight measurements were taken throughout the duration of the study. After acclimatization, animals were divided randomly into 12 groups (n = 6 per group). Animals were instilled with 0.3 ml of normal saline solution (control) or saline suspension containing CeO2 nanoparticles as described previously [7]. Rats were euthanized and livers were collected at 1, 3, 14, 28, 56 or 90 days post exposure to either the CeO2 nanoparticles or normal saline. After excision, livers were cleaned of blood and connective tissues, weighed, and immediately snap frozen in liquid nitrogen for processing.
Liver cerium content was estimated for the 1, 28, 56, and 90 day animals by induction coupled plasma-mass spectrometry (ICP-MS) at Elemental Analysis Inc. (Lexington, KY, USA) using the EPA Method 3050B identical to that detailed previously [14]. All Ce-140 calibration standards were prepared using a certified reference standard traceable to NIST reference materials. A continuing calibration verification standard and a continuing calibration blank were analyzed at the beginning of the run, after every ten samples, and at the conclusion of the run.
Liver slices from 90 day control and 90 day post exposure were fixed in Karnovsky's fixative (2.5% glutaraldehyde and 3.5% paraformaldehyde in 0.1 M Sodium Cacodylate buffer), then embedded in 4% agarose and refixed for 2 h. The samples were post-fixed in 1% osmium tetroxide (120 min at 4 ℃), mordanted in 1% tannic acid (pH 7.0) and block stained in 0.5% uranyl acetate (both at room temperature for 60 minutes) all in a buffer of 8% sucrose and 0.9% sodium chloride. When staining was complete, the solution was first changed to 70% ethyl alcohol and then 90%. Afterwards samples were rinsed twice with 100% ethyl alcohol for 15 min each time. Samples were placed into a solution of 1:1 100% ethyl alcohol to propylene oxide for 15 min and then into 100% propylene oxide changing the solution twice. The sample solution was replaced with a 1:1 of propylene oxide and LX112 embedding media, followed by a 3:1 solution for 30 min, and then into a 100% solution of LX112 overnight on a rotating platform. This solution was changed again and maintained for an additional 4 h, deposited into embedding molds, and placed into a 60 ℃ oven for 48 h. Thick (0.5 µm) sections were cut and stained with a 1% toluidine blue (in 1% sodium borate) solution on a hot plate for 90 sec. Thin sections (70 nm) were placed on 200 mesh copper grids and stained with 4% aqueous uranyl acetate and Reynold's lead citrate for 15 and 20 min, respectively. Images were taken on a JEOL 1220 transmission electron microscope at 80 kV.
Lipid peroxidation assays were performed on liver tissues removed from the 1, 3, 14, 28, 56 and 90 days post exposure animals and compared to the controls from each group. Briefly, individual liver pieces (200 mg) were homogenized in 1 ml phosphate buffered saline (PBS) and the homogenizer probe rinsed with an additional 1 ml of PBS. Lipid peroxidation was measured as described previously [15]. The amount of malondialdehyde (MDA) was calculated based on a standard curve (range 1-40 nmol) using MDA (Aldrich, St. Louis, MO) and expressed as nmol MDA/g liver tissue.
Liver tissues, collected on poly-lysine coated slides, were serially sectioned (8 µm) using an IEC Microtome cryostat. The fluorescent superoxide indicator dihydroethidium (HE) was used to evaluate superoxide levels as detailed previously [16]. Upon oxidation, HE intercalates with DNA exhibiting bright fluorescent red. Briefly, frozen tissue sections were washed with PBS for 5 min and then incubated with 200 µl of 10 µM HE (Molecular Probes, Eugene, OR, USA) for 1 h at room temperature. After washing with PBS (3 × 10 min), fluorescence was visualized under Texas red filter using an Olympus BX51 microscope (Olympus America, Melville, NY, USA) equipped with Olympus WH 209 wide field eyepieces and an Olympus UPlanF1 409/0.75 objective lens.
Liver tissues were serially sectioned (8 µm) using an IEC Microtome cryostat and the sections were collected on poly-lysine coated slides. DNA fragmentation was determined by TdT-mediated dUTP nick end labeling (TUNEL) according to the manufacturer's recommendations (In Situ Cell Death Detection Kit, Roche Diagnostics, Mannheim, Germany). TUNEL staining was performed on tissue sections obtained from saline controls and day 1, 3, and 90 post CeO2 nanoparticle exposure groups (n = 4/group) as described elsewhere [16]. Cross-sections from each tissue were treated with DNase-I to induce DNA fragmentation as a positive control. Liver sections were blocked with 3% BSA and incubated with anti-dystrophin antibody (NCL-DYS2, Novocastra Vector Laboratories, Burlingame, CA, USA) at a dilution of 1:200 to visualize the cell membrane. Nuclei were counter stained using DAPI (Vectashield HardSet Mounting Medium, Vector Laboratories, Burlingame, CA, USA). Liver cross sections were visualized by epifluorescence using an Olympus fluorescence microscope (Melville, NY, USA) fitted with 20X and 40X objectives and images recorded digitally using a CCD camera (Olympus, Melville, NY, USA). The number of TUNEL positive nuclei were counted in three randomly selected regions in each slide. Four different animals were counted from each group.
Portions of individual liver tissues (100-150 mg) were homogenized in buffer (T-PER, 8 mL/g tissue; Pierce, Rockford, IL, USA) containing protease (P8340, Sigma-Aldrich, Inc., St. Louis, MO, USA) and phosphatase inhibitors (P5726, Sigma-Aldrich, Inc., St. Louis, MO, USA) and sonicated (3 × 30 sec at 150 W). The supernatant protein was collected by centrifuging the tissue homogenate at 12,000 g for 5 min at 4 ℃. Protein concentrations of homogenates were determined employing the 660 nm assay method (Fisher Scientific, Rockford, IL, USA). Briefly, after boiling in Laemmli 2X sample buffer (Sigma-Aldrich, Inc., St. Louis, MO, USA) for 5 min, 32 µg of total protein from each sample was separated on a 10% PAGEr Gold Precast gel (Lonza, Rockland, ME, USA) and transferred to nitrocellulose membranes. Gels were stained with a RAPID Stain protein stain reagent (G-Biosciences, St. Louis, MO, USA) to verify transfer efficiency to membrane. Membranes were stained with Ponceau S and the amount of protein quantified by densitometric analysis to confirm successful transfer of proteins and equal loading of lanes as detailed by Wu M, et al. [17]. Membranes were blocked with 5% milk in Tris Buffered Saline (TBS) containing 0.05% Tween-20 (TBST) for 1 h and then incubated with primary antibody overnight at 4 ℃. After washing with TBST, the membranes were incubated with the corresponding secondary antibodies conjugated with horseradish peroxidase (HRP) (anti-rabbit (#7074) or anti-mouse (#7076), (Cell Signaling Technology, Danvers, MA, USA) for 1 h at room temperature. Protein bands were visualized following reaction with ECL reagent (Amersham ECL Western Blotting reagent RPN 2106, GE Healthcare Bio-Sciences Corp., Piscataway, NJ, USA). Target protein levels were quantified by Alpha View image analysis software (Alpha Innotech, San Leandro, CA, USA). Primary antibodies against caspase-3 (#9662), cleaved caspase-3 (#9661S), Bax (#2772), Bcl-2 (#2870S), caspase-9 (#9506), nuclear factor-kappa B p65 (#3034), Phosho NF-kB P65 (Ser536 # 3033), p38 MAPK (#9212), Phospho p38 MAPK Thr 180/Tyr 182 (#9216L) were purchased from Cell Signaling Technology (Beverly, MA, USA).
Pooled serum samples from all six animals in the 1, 3, 28, 56 and 90-day experimental groups were shipped on dry ice to Rules based Medicine (Austin, Texas) for Rodent MAP® version 2.0 Antigen analysis using a Luminex 100 instrument as detailed elsewhere [1]. The antigen panel consisted of fifty-nine proteins, which included proteins involved in inflammation, cytokines, growth, and tissue factors. Each anaslyte was quantified using 4 and 5 parameters, weighted and non-weighted curve fitting algorithms using proprietary data analysis software developed at Rules-Based Medicine.
Results are presented as mean ± SEM. Data were analyzed using the Sigma Plot 11.0 statistical program. One-way analysis of variance and two-way analysis of variance were performed for overall comparisons, while the Student-Newman-Keuls post hoc test used to determine differences between groups. Values of P < 0.05 were considered to be statistically significant.
Similar to previous work [1,7] which used the same batch of CeO2 nanoparticles, TEM and scanning electron microscopy confirmed the presence of single and agglomerated CeO2 nanoparticles in the suspensions. Field emission scanning electron microscopy showed CeO2 nanoparticles were generally dispersed into submicron groups with an average size of 9.26 ± 0.58 nm. The diameter of the primary CeO2 particles was determined to be 10.14 ± 0.76 nm by TEM.
CeO2 nanoparticle exposure had no effect on the average feed intake and weight gain on the animals (Figure 1). Compared to saline control animals, CeO2 nanoparticle exposure did not increase the liver weight to body weight ratio (Table 1). The liver weight to body weight ratio was reduced in 3, 28, 56, and 90 day animals, as compared to 1-day exposure animals (Table 1). The concentration of cerium was undetectable in the saline control animals (Figure 2). At day 1 post exposure, the cerium concentration level was 0.03 ± 0.01 ppm and increased thereafter before peaking at 0.20 ± 0.04 ppm at day 90 (P < 0.001).
 Figure 1: Intratracheal instillation of CeO2 nanoparticles does not alter feed intake and body weight gain.
View Figure 1
Figure 1: Intratracheal instillation of CeO2 nanoparticles does not alter feed intake and body weight gain.
View Figure 1
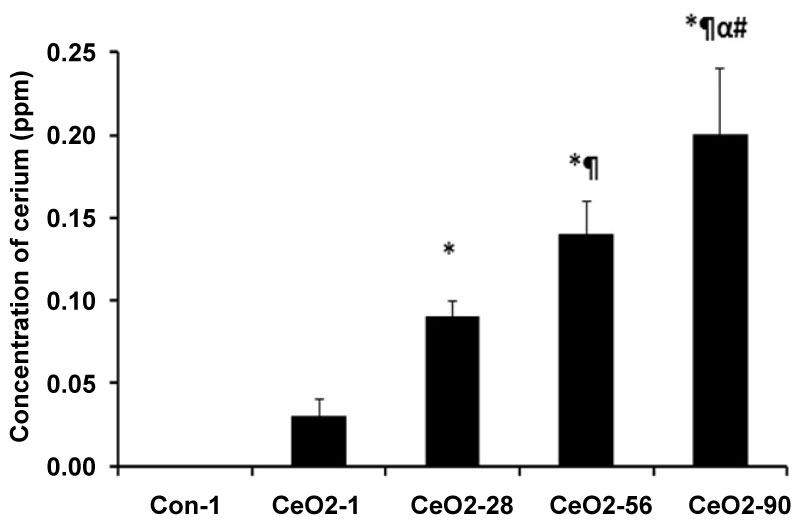 Figure 2: Accumulation of cerium in the liver with the days of the exposure to CeO2 nanoparticles. Liver tissues (Approx. 3 gram) were used for estimation of cerium content in the lungs with ICP-MS analysis. Con-1 represents saline control day 1, CeO2-1, 28, 56, and 90 represents animal groups exposed to CeO2 nanoparticles for 1, 28, 56, and 90 days respectively. *Significant difference from control-1; ¶Significant difference from Day-1 exposure; αSignificant difference from Day-28 exposure; #Significant difference from Day-56 exposure.
View Figure 2
Figure 2: Accumulation of cerium in the liver with the days of the exposure to CeO2 nanoparticles. Liver tissues (Approx. 3 gram) were used for estimation of cerium content in the lungs with ICP-MS analysis. Con-1 represents saline control day 1, CeO2-1, 28, 56, and 90 represents animal groups exposed to CeO2 nanoparticles for 1, 28, 56, and 90 days respectively. *Significant difference from control-1; ¶Significant difference from Day-1 exposure; αSignificant difference from Day-28 exposure; #Significant difference from Day-56 exposure.
View Figure 2
Table 1: Alterations in the liver weight, body weight and coefficient of liver weights with the CeO2 nanoparticle exposure. Liver tissues collected from animal groups that were intratracheal instilled with either normal saline or CeO2 nanoparticles at a dosage of 7.0 mg/kg after 1, 3, 14, 28, 56 and 90 days post exposure, and cleaned to remove blood and tissue debris with Krebs�s lactate solution and weighed immediately (N = 6/group). View Table 1
TEM image of liver sections show sub-µm sized nanoparticles are dispersed in the hepatocytes (Figures 3a and Figure 3b). Alterations observed in the ultrastructure of liver tissues with 90 days post CeO2 nanoparticles exposure as compared to 90 days control animals include; reduced fat droplets, increased non-specific deposition of particulate material in the hepatocytes, altered mitochondrial structure, increased number of peroxisomes or lysosomes, and split endoplasmic reticulum.
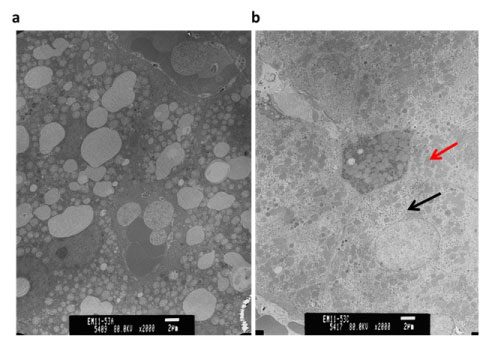 Figure 3: Alterations in the ultrastructure of the hepatocytes as observed with TEM; a) 90 days control; b) 90 days CeO2 nanoparticles exposed liver. Black Arrow: Deposition of CeO2 nanoparticles; Red Arrow: Altered mitochondrial structure with CeO2 nanoparticle exposure.
View Figure 3
Figure 3: Alterations in the ultrastructure of the hepatocytes as observed with TEM; a) 90 days control; b) 90 days CeO2 nanoparticles exposed liver. Black Arrow: Deposition of CeO2 nanoparticles; Red Arrow: Altered mitochondrial structure with CeO2 nanoparticle exposure.
View Figure 3
Compared to age matched control animals, the concentration of MDA per gram of liver tissue was elevated by 25, 31, and 20% at day 1, 3, and 90, respectively (p < 0.05) (Figure 4). Similarly, compared to control animals, ethidium fluorescence intensity was increased by 122, 145, and 96% at days 1, 3, and 90, respectively (p < 0.05) (Figure 5). Compared to day 1 saline controls, CeO2 nanoparticle exposure increased the number of TUNEL positive nuclei by 378, 351 and 435% at days 1, 3 and day 90 post exposure (Figure 6).
 Figure 4: CeO2 nanoparticles can cause lipid peroxidation of the hepatic cell membranes. *Significant difference from the controls in each group; ¶Significant difference from the 14, 28 and 56 days CeO2 exposure group.
View Figure 4
Figure 4: CeO2 nanoparticles can cause lipid peroxidation of the hepatic cell membranes. *Significant difference from the controls in each group; ¶Significant difference from the 14, 28 and 56 days CeO2 exposure group.
View Figure 4
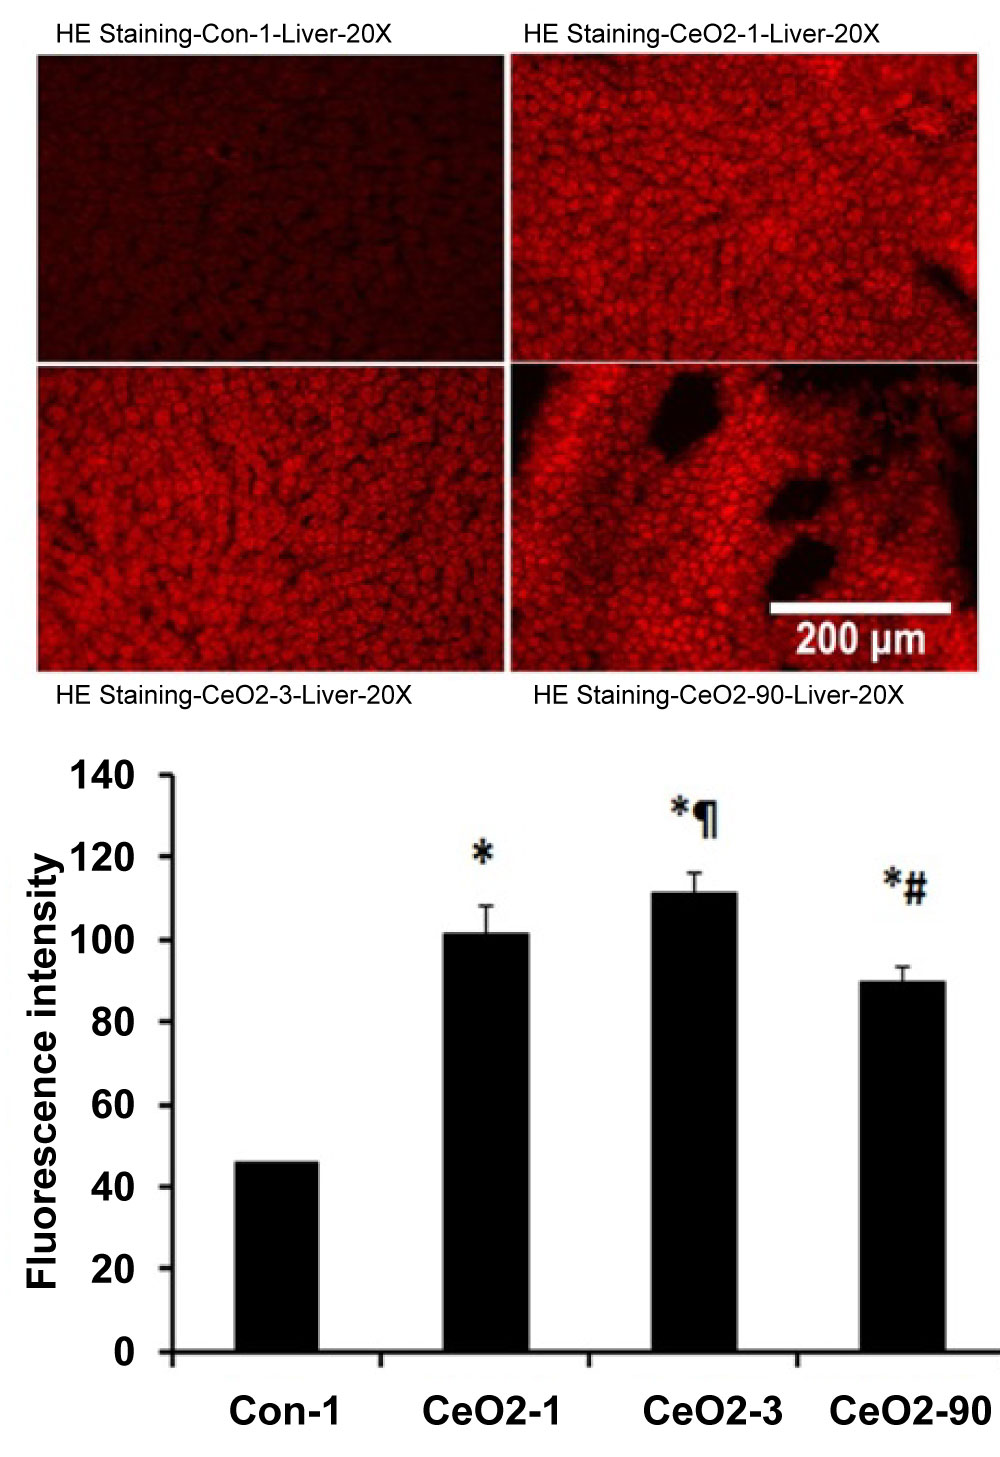 Figure 5: Increased generation of superoxide radicals in the liver with the intratracheal instillation of CeO2 nanoparticles. Graph indicates quantification of hepatic ROS as determined by intensity of fluorescence. Results are expressed relative to the day 1 control (n = 4 per group). *Significant difference from control-1; ¶Significant difference from Day-1 exposure; #Significant difference from Day-3 exposure.
View Figure 5
Figure 5: Increased generation of superoxide radicals in the liver with the intratracheal instillation of CeO2 nanoparticles. Graph indicates quantification of hepatic ROS as determined by intensity of fluorescence. Results are expressed relative to the day 1 control (n = 4 per group). *Significant difference from control-1; ¶Significant difference from Day-1 exposure; #Significant difference from Day-3 exposure.
View Figure 5
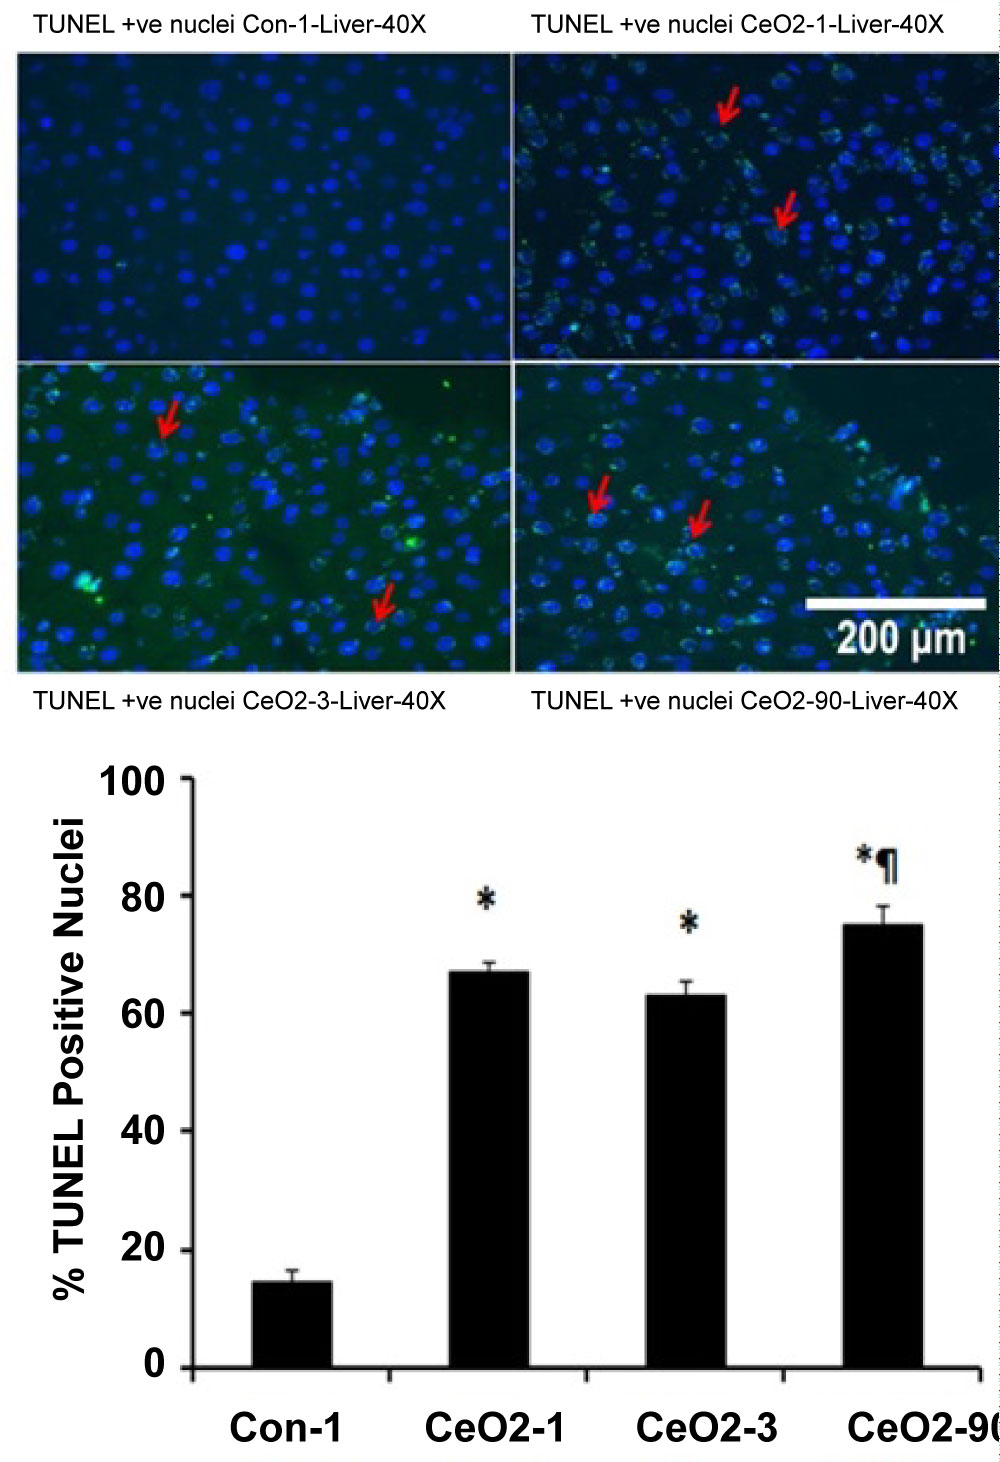 Figure 6: CeO2 nanoparticles exposure increases TUNEL positive nuclei in the liver. Double immunofluorescence labeling of TUNEL (FITC), and nuclei (DAPI) in day 1 control, and 1, 3, and 90 days CeO2 nanoparticle exposure livers. Graph indicates number of TUNEL positive nuclei per mm2 in day 1 control, and day 1, 3, and 90 days CeO2 nanoparticle exposure livers (n = 4 per group). *Significant difference from control-1; ¶Significant difference from Day-3 exposure.
View Figure 6
Figure 6: CeO2 nanoparticles exposure increases TUNEL positive nuclei in the liver. Double immunofluorescence labeling of TUNEL (FITC), and nuclei (DAPI) in day 1 control, and 1, 3, and 90 days CeO2 nanoparticle exposure livers. Graph indicates number of TUNEL positive nuclei per mm2 in day 1 control, and day 1, 3, and 90 days CeO2 nanoparticle exposure livers (n = 4 per group). *Significant difference from control-1; ¶Significant difference from Day-3 exposure.
View Figure 6
Compared to day 1 saline controls, the Bax to Bcl-2 protein ratio was 32 and 10% higher in the day 1 and 3 exposure groups, respectively (p < 0.05). After day 3, the Bax to Bcl-2 ratio started to decline and was 55, 62, and 47% lower in day 14, 28 and 56 exposure animals, respectively (p < 0.05) (Figure 7).
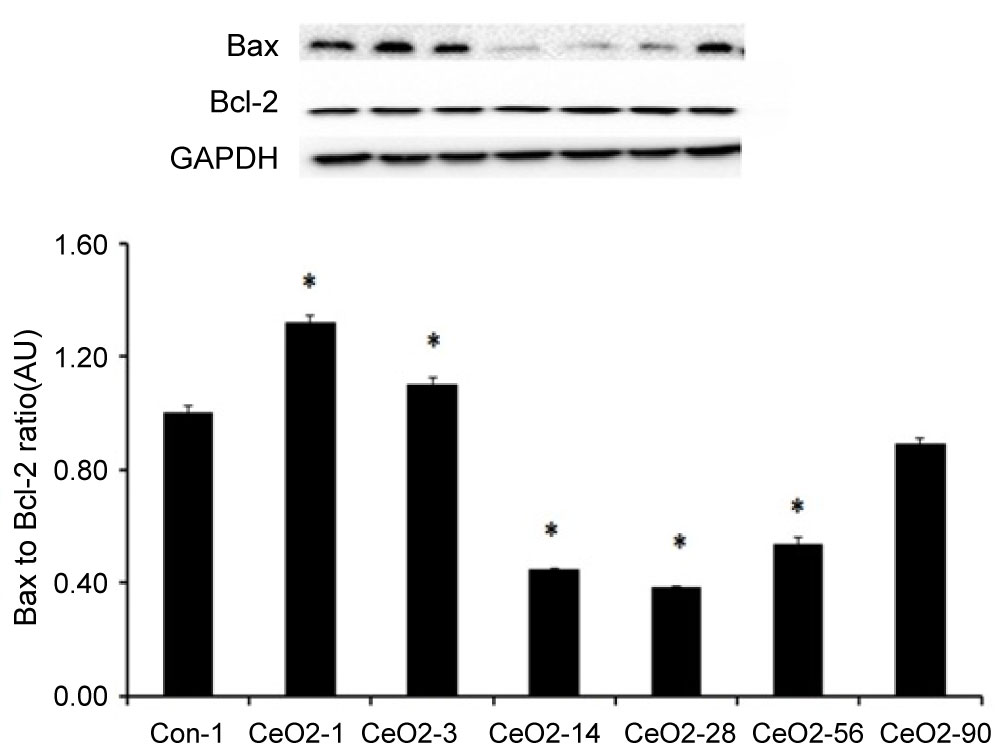 Figure 7: Activation of proapoptotic protein signaling in the liver following intratracheal instillation of CeO2 nanoparticles. Protein bands of the Bax and Bcl-2 proteins and corresponding GAPDH are represented in the figure. Bands corresponding to the X-axis labels are shown in the immunoblotting images. Protein levels were adjusted by GAPDH levels and compared with the control day 1. *Significant difference from control-1.
View Figure 7
Figure 7: Activation of proapoptotic protein signaling in the liver following intratracheal instillation of CeO2 nanoparticles. Protein bands of the Bax and Bcl-2 proteins and corresponding GAPDH are represented in the figure. Bands corresponding to the X-axis labels are shown in the immunoblotting images. Protein levels were adjusted by GAPDH levels and compared with the control day 1. *Significant difference from control-1.
View Figure 7
Caspases are cysteine-dependent, aspartate specific proteases that are activated during cell death. When compared to saline control day 1 animals, caspase 9 protein levels in CeO2 nanoparticle exposed animals were 25, 21 and 35% higher at 1, 3, and 90 days exposure, respectively (p < 0.05). Similarly, the amount of cleaved caspase 9 (activated) was 29, 36 and 60% higher in the 1, 3 and 90 day animals, respectively (p < 0.05) (Figure 8). Caspase 3 levels were 16% higher in day 1 exposure group as compared to saline control day 1, (p < 0.05). Compared to saline control day 1, the amount of cleaved caspase 3 (activated) was 32, 49 and 13% higher in the 1, 3 and 90 days post exposure groups, respectively (p < 0.05) (Figure 9).
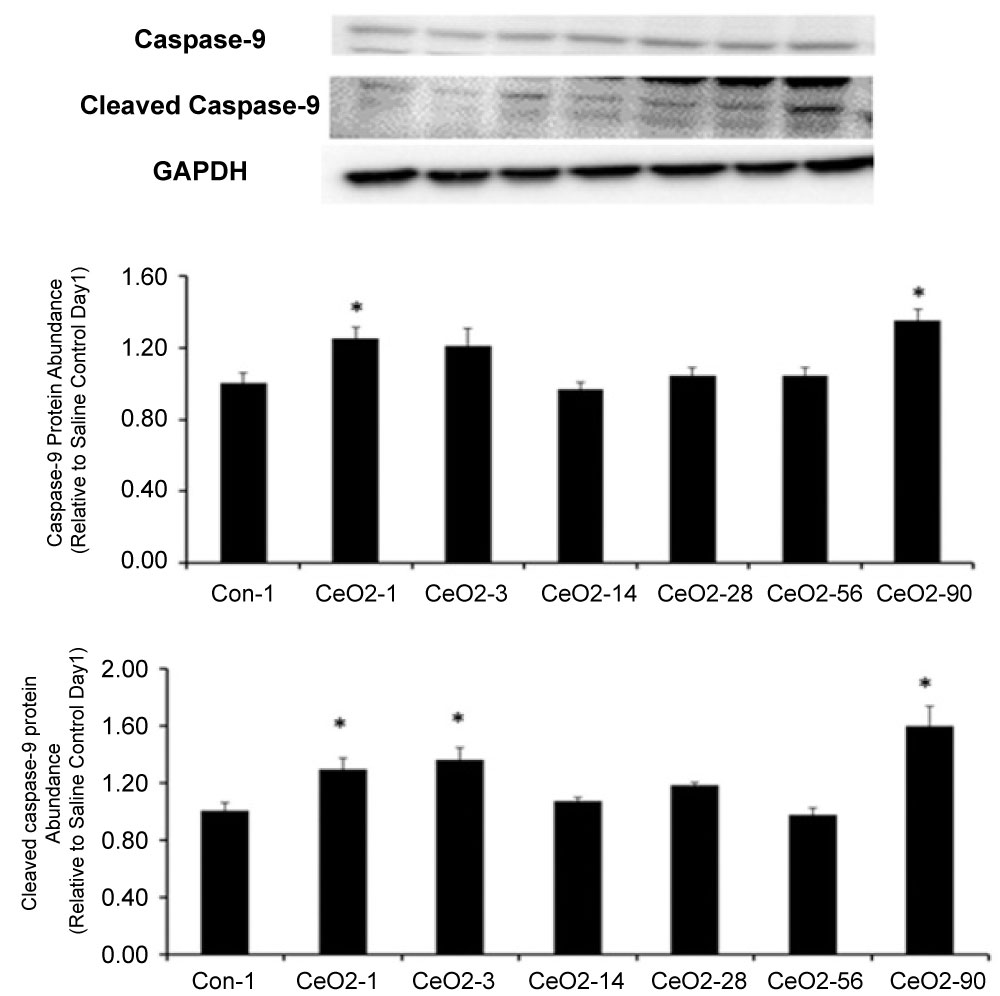 Figure 8: CeO2 nanoparticle exposure can activate initiator caspase-9. Protein bands of the caspase-9 and cleaved caspase-9 proteins and corresponding GAPDH are shown in this figure. Bands corresponding to the X-axis labels are shown in the immunoblotting images. Protein levels were adjusted by GAPDH levels and compared with the control day 1. *Significant difference from control-1.
View Figure 8
Figure 8: CeO2 nanoparticle exposure can activate initiator caspase-9. Protein bands of the caspase-9 and cleaved caspase-9 proteins and corresponding GAPDH are shown in this figure. Bands corresponding to the X-axis labels are shown in the immunoblotting images. Protein levels were adjusted by GAPDH levels and compared with the control day 1. *Significant difference from control-1.
View Figure 8
The ratio of phosphorylated p38 MAPK to total p38 MAPK ratio was reduced by 7, 16, and 50% in the 1, 3, and 90 days, post exposure animals, respectively, as compared to saline control day 1, (p < 0.05). Conversely, the ratio of phosphorylated p38 MAPK (Thr180/Tyr 182) to total p38 MAPK was elevated by 100, 65, and 91% in the 14, 28 and 56 days exposure groups, respectively (p < 0.05) (Figure 10). Similar to p38 MAPK, it is assumed that NF-kβ p65 plays a protective role in the liver [18-20]. Compared to saline control day 1 animals, the ratio of phosphorylated NF-kβ p65 (Ser536) to total NF-kβ p65 protein was reduced by 14, 5, and 67% in the 1, 3, and 90 day exposure groups, respectively (p < 0.05). Phosphorylated NF-kβ p65 to total NF-kβ p65 protein levels were 26, 34, and 18% higher for 14, 28 and 56 day exposure groups, respectively, when compared to saline control day 1 animals (p < 0.05) (Figure 11).
We monitored 55 serum biomarkers that include inflammatory cytokines, interleukins, chemokines, tissue factors and growth factors. Among the 55 biomarkers monitored, 35 showed changes in expression across all animal groups. As compared to saline control day 1 animals, CeO2 nanoparticle exposure increased the expression levels in 26 biomarkers, decreased expression levels in 8 biomarkers, and had no effect on the expression level for one biomarker (Figure 12a). The 3-day exposure group showed an elevation of expression levels for 8 biomarkers, decreased expression levels for 22 biomarkers and no change in the expression levels in 5 biomarkers, in comparison to saline control day 1 animals, (Figure 12b). When compared to saline control day 1 animals, animals in the day 28 exposure group showed an elevation in 10 biomarkers, lowered expression for 19 biomarkers, and exhibited no effect of the expression in 6 biomarkers (Figure 12c). Compared to saline control day 1, the 90-day exposure group showed an increase of expression levels in 5 biomarkers, a decrease in expression for 24 biomarkers, and no change in the expression levels in 6 biomarkers (Figure 12d).
Previous investigations examining the toxicity of metallic nanoparticles have demonstrated that exposure to silver, gold, silica, copper, zinc oxide and titanium dioxide nanoparticles increase hepatic ROS and cellular apoptosis [8-11]. We found evidence of a similar phenomenon in the liver, following the intratracheal instillation of CeO2 nanoparticles. Specifically, our primary findings show a correlation between the deposition of ceria in the liver and an increase in tissue ROS and cellular apoptosis.
One potential marker of increased oxidative stress, and relevant to our studies, is lipid peroxidation [21]. Lipid peroxidation is the end product of oxidative degradation of lipids and can be evaluated by the measurement of malondialdehyde (MDA) levels [21]. Here, we observed that ceria deposition in the liver was associated with elevations in liver MDA at 1, 3 and 90 days after exposure (Figure 4). Interestingly, there was no evidence of elevated MDA levels at 14, 28, or 56 days post exposure. In addition to MDA levels, we also examined liver tissue sections for the presence of superoxide using hydroethidium staining (Figure 5). Consistent with our MDA data, the HE staining results demonstrated CeO2 transtracheal instillation at a dose of 7.0 mg/kg is linked to a considerable increase in liver superoxide levels at 1, 3 and 90 days post exposure (Figure 5). Taken together, these data validate the capacity of CeO2 nanoparticles to induce the generation of hepatic ROS [22,23] which appears to be connected to an increase of hepatocyte lipid peroxidation. The reasons behind increased MDA and superoxide levels during early (days 1 and 3) and late (day 90) exposures, in comparison to intermediate exposure, are not clear. We suspect the acute exposure to a large dose of nanoparticles, during the initial phase of the study, causes a systemic inflammatory response and increases oxidative stress, which is then followed by a "remodeling phase". During the remodeling phase, ceria deposition continues in the liver until it reaches a maximal level at day 90 (Figure 2), which may be high enough to initiate a second wave of inflammation and cell death. It is also observed that with increased deposition of the CeO2 nanoparticles in hepatocytes, as seen with TEM images of the liver, there are increased alterations in the structure of organelles such as mitochondria and endoplasmic reticulum (Figure 3). More research, perhaps using additional time points extended past 90 days post exposure, will be needed to identify the mechanistic biphasic inflammatory response we observed in the liver.
TUNEL staining was used to examine hepatocytes for the presence of double stranded DNA breaks, with the aim of evaluating the role of oxidative stress of 1, 3 and 90 days post exposure groups to its association with hepatocyte apoptosis., As predicted, TUNEL analysis was consistent with increased liver apoptosis at the time points shown (Figure 5). In an effort to better understand the potential mechanism (s) underlying these findings, we prepared protein isolates from liver samples and used immunoblotting to examine the isolates for changes in apoptotic signaling. Immunoblotting was conducted on day 1 control isolates and protein fractions from animals exposed to cerium oxide nanoparticles for 1, 3, 14, 28, 56 and 90 days. Our findings suggest there is an increase in proapoptotic Bax/Bcl-2 protein signaling at day 1 and 3 post exposure, but decreases thereafter. Proapoptotic protein signaling appears to be diminished at day 14, 28 and 56 post exposure. Interestingly, and consistent with our oxidative stress data, we observed a significant increase in proapoptotic protein signaling in the 90 day exposure group, when compared to our observations in the 56 day post exposure animal group (Figure 7).
Given the increase in the ratio of Bax/Bcl-2 leads to cellular apoptosis via the activation of intracellular caspases, we wanted to examine protein isolates for evidence of caspase cleavage. Our data show increased levels of active caspase 9 (cleaved caspase 9) at 1, 3 and 90 day post exposures (Figure 8). Conversely, the expression levels of active caspase 9 declined in 14, 28 and 56-day post exposure animal groups. Comparable to our findings for Bax/Bcl-2, we noted an increase in cleaved caspase 9 expression levels in the day 90 exposure group (Figure 8). To further explore other caspases for similar trends, these experiments were duplicated to analyze caspase 3 activity. Results showed caspase 3 cleavage appeared to increase at days 1 and 3 (Figure 9), which parallels the trend seen in caspase 9. Collectively, these data, when considered in the context of our TUNEL results, suggest ceria deposition in the liver is associated with hepatic apoptosis and these findings may be mediated by increased levels of oxidative stress. However, the biphasic apoptotic response, after acute and prolonged exposure, is still not fully understood.
 Figure 9: CeO2 nanoparticle exposure can activate executor caspase-3. Protein bands of the caspase-3 and cleaved caspase-3 proteins and corresponding GAPDH are represented in the figure. Bands corresponding to the X-axis labels are shown in the immunoblotting images. Protein levels were adjusted by GAPDH levels and compared with the control day 1. *Significant difference from day 1 control animals.
View Figure 9
Figure 9: CeO2 nanoparticle exposure can activate executor caspase-3. Protein bands of the caspase-3 and cleaved caspase-3 proteins and corresponding GAPDH are represented in the figure. Bands corresponding to the X-axis labels are shown in the immunoblotting images. Protein levels were adjusted by GAPDH levels and compared with the control day 1. *Significant difference from day 1 control animals.
View Figure 9
The p38 MAPK and NF-kβ-P65 are thought to play important roles in the protection of the liver from oxidative stress and apoptosis [18,19,24,25]. When phosphorylated, p38 MAPK and NF-kβ-P65 activate a number of different transcription factors which can travel to the nucleus to induce changes in gene expression [19,24]. Phosphorylated p38 MAPK has been implicated in reducing the production of inflammatory factors [20,26]. In this study, we found the ratio of phosphorylated to total p38 MAPK protein level was not altered at days 1 and 3 post exposure, while it was increased at days 14, 28 and 56 post exposure (Figure 10). Consistent with these findings, we also found that p38 MAPK activation (phosphorylation) appeared to be significantly reduced in the 90 day post exposure group. Like p38 MAPK, the NF-kβ P65 is also thought to play a crucial role in hepatic cell survival and proliferation [18,19]. Similar to our findings for p38 MAPK, we observed the ratio of phosphorylated to total NF-kβ P65 protein levels appeared to be reduced in day 1 and 3 post exposure groups, elevated in day 14, 28 and 56 post exposure groups, before becoming significantly reduced in 90 day post exposure animal groups (Figure 11). Further studies will need to be explored to determine if decreases in p38 MAPK and NF-kβ activation renders the liver susceptible to increased oxidative stress and cellular apoptosis at 90-day post exposure.
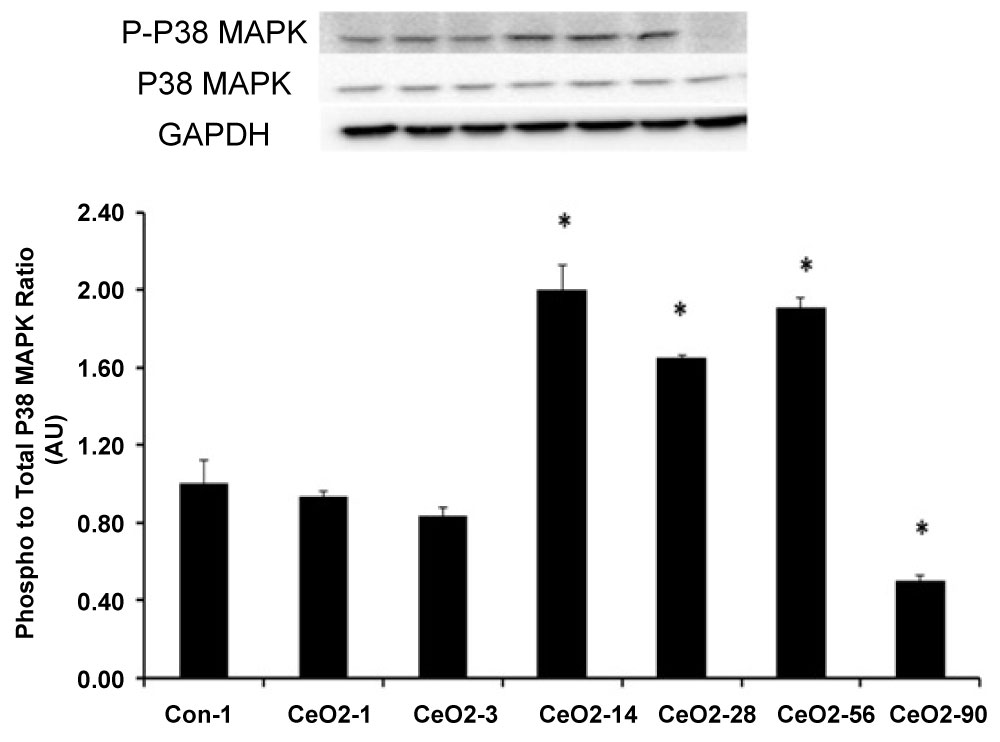 Figure 10: CeO2 nanoparticle exposure can alter the cell protective signaling in the liver by modulating the activity of p38 MAPK. Protein bands of the p38 MAPk and Phospho p38 MAPK proteins and corresponding GAPDH are represented in the figure. Bands corresponding to the X-axis labels are shown in the immunoblotting images. Protein levels were adjusted by GAPDH levels and compared with the control day 1. *Significant difference from day 1 control animals.
View Figure 10
Figure 10: CeO2 nanoparticle exposure can alter the cell protective signaling in the liver by modulating the activity of p38 MAPK. Protein bands of the p38 MAPk and Phospho p38 MAPK proteins and corresponding GAPDH are represented in the figure. Bands corresponding to the X-axis labels are shown in the immunoblotting images. Protein levels were adjusted by GAPDH levels and compared with the control day 1. *Significant difference from day 1 control animals.
View Figure 10
 Figure 11: CeO2 nanoparticle exposure can alter the cell protective signaling in the liver by modulating the activity of NF-kβ activity. Protein bands of the NF-kβ p65 and Phospho NF-kβ p65 proteins and corresponding GAPDH are represented in the figure. Bands corresponding to the X-axis labels are shown in the immunoblotting images. Protein levels were adjusted by GAPDH levels and compared with the control day 1. *Significant difference from day 1 control animals.
View Figure 11
Figure 11: CeO2 nanoparticle exposure can alter the cell protective signaling in the liver by modulating the activity of NF-kβ activity. Protein bands of the NF-kβ p65 and Phospho NF-kβ p65 proteins and corresponding GAPDH are represented in the figure. Bands corresponding to the X-axis labels are shown in the immunoblotting images. Protein levels were adjusted by GAPDH levels and compared with the control day 1. *Significant difference from day 1 control animals.
View Figure 11
In addition to investigating the effects of ceria deposition on the liver, we examined changes in proinflammatory cytokines after exposure to CeO2 nanoparticles. Our analysis of serum biomarkers suggests CeO2 nanoparticle exposure is associated with increased levels of cytokines, tissue factors and growth factors. In particular, our data indicate ceria deposition in the liver is characterized by elevated acute phase reactant proteins such as fibrinogen, haptoglobin, serum amyloid P-component, and Von Willebrands's factor at 1, 3, 28, 56, and 90 days post exposure [1,27] (Figure 12). Our study of serum biomarkers also suggests that exposure of CeO2 nanoparticles is also related to an allergic response. Eotaxin is a chemokine that attracts eosinophils to the site of injury to elicit an inflammatory response [28]. MCP-1, MCP-3, MIP-1 beta, and MIP-2 are groups of chemokines that are induced by eotaxin and have shown to play a crucial role in the inflammation process induced by eosinophils [29-31]. In addition, eotaxin also exhibits the ability to selectively prime eosinophils for chemotaxis, to direct their migration/chemotaxis, and to activate inflammatory activity in the cells attracted [30-32]. Mast cells are known for mediating such an early or initial response and a known source of IL-4 and TNF-alpha, which is consistent with our observation of increased IL-4 expression following CeO2 nanoparticle exposure [30,32].
 Figure 12: Intratracheal instillation of CeO2 nanoparticles can alter the expression of serum biomarkers that play an important role in the inflammation and/or act as inflammatory cytokines and tissue factors. Pooled serum samples (n = 6) isolated from the Saline control day 1, and CeO2 nanoparticle exposures for 1, 3, 28 and 90 days were used to estimate the concentration of inflammatory mediators with Rodent MAP® version 2.0 Antigen analyses using a Luminex 100 instrument at Rules Based Medicine (Austin, TX). Results were expressed as percent change in the expression when compared to the saline control day 1.
View Figure 12
Figure 12: Intratracheal instillation of CeO2 nanoparticles can alter the expression of serum biomarkers that play an important role in the inflammation and/or act as inflammatory cytokines and tissue factors. Pooled serum samples (n = 6) isolated from the Saline control day 1, and CeO2 nanoparticle exposures for 1, 3, 28 and 90 days were used to estimate the concentration of inflammatory mediators with Rodent MAP® version 2.0 Antigen analyses using a Luminex 100 instrument at Rules Based Medicine (Austin, TX). Results were expressed as percent change in the expression when compared to the saline control day 1.
View Figure 12
Taken together, the data of the current study demonstrate exposure to CeO2 nanoparticles is characterized by acute increases in hepatic oxidative stress, elevations in hepatic apoptosis, and an eosinophil mediated inflammatory response that declines over time (Figure 13). Interestingly, at 90 day post exposure, oxidative stress and apoptosis also increases. Although this study is unable to demonstrate conclusive evidence for the cause and effect of increased oxidative stress and apoptosis at 90 day post exposure, the data leads to a correlation between increased bioaccumulation of cerium in the liver as well as diminished p38 MAPK and NF-kβ activation. Further studies may be warranted to investigate the long term effects on hepatic structure and function by exposure to CeO2 nanoparticles.
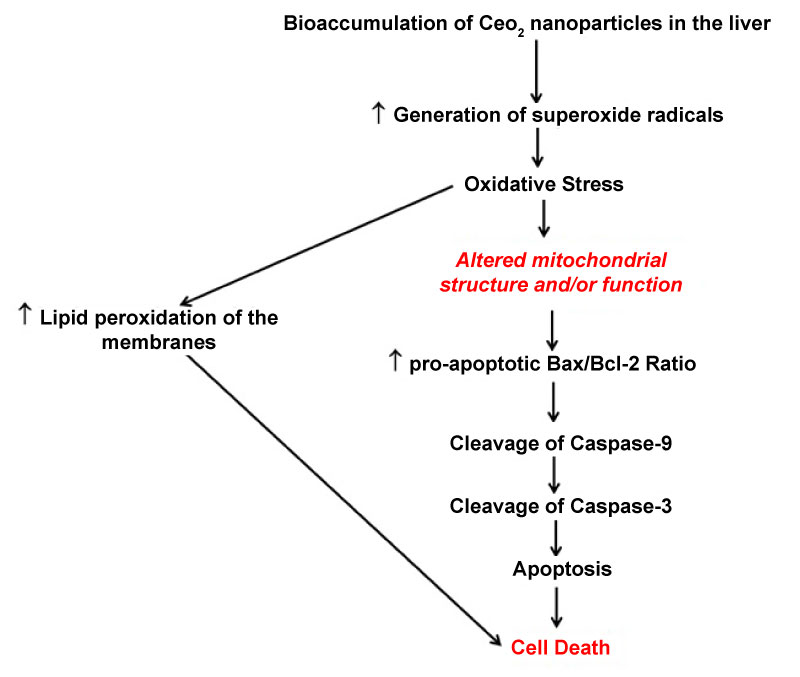 Figure 13: Exposure to CeO2 nanoparticles is associated with generation of ROS, that results in oxidative stress and inturn is associated with activation of apoptotic protein signaling in the rat liver. In the figure below, black colored text indicates the results from our studies and the red colored text indicates what is already known or what can be implied from previous studies.
View Figure 13
Figure 13: Exposure to CeO2 nanoparticles is associated with generation of ROS, that results in oxidative stress and inturn is associated with activation of apoptotic protein signaling in the rat liver. In the figure below, black colored text indicates the results from our studies and the red colored text indicates what is already known or what can be implied from previous studies.
View Figure 13