To investigate a blood glucose profile and turn point during incremental exercise.
Thirty-three national and international-level swimmers undertook a 7 × 200 m discontinuous, incremental, training set on a six-minute turnaround. Subjects were asked to be two hours post-absorptive, which resulted in a mean blood glucose level of 5.5 ± 0.57 mmol/l. After each 200 m-swim blood lactate, blood glucose, and heart rate were taken and values plotted against the velocity of each swim. A Glucose turn point (Gt) was observed and defined in this study as an upward deflection after which blood glucose continues to rise. The Dmax, Borch, and LogLog methods were used to calculate Anaerobic Threshold (AnT).
Significant differences were observed between Gt and all three methods of AnT for swim pace, heart rate, blood glucose, and lactate (P < 0.005).
Blood glucose profiles and the identification of Gt are not linked to AnT. Gt may be an effective tool for the observation of exercise intensity that is independent of the mechanisms underlying AnT.
Swimming, Blood glucose, Anaerobic threshold, Blood lactate, Step test
Physical exercise brings an increased demand for substrates to be metabolized in working muscle. Part of this requirement is met by glucose, circulating in the blood, released from an increase in hepatic glycogenolysis and through the use of glycogen in the muscle [1]. The movement of glucose from the blood into the muscle cell is mediated by GLUT-4 transporters [2]. It is well understood that this action is independent of, and additive to, the action of insulin. The demand for energy within the working muscle can regulate the degree and source of glucose made available to that muscle cell [2,3].
The level of Glucose-6-Phosphate (G-6-P) in the muscle cell exerts a controlling action over Hexokinase which moderates the transfer of glucose by the GLUT-4 carriers across the cell membrane [4]. The level of G-6-P therefore regulates the flow of glucose into the cell. Increase in glycogen use can raise the G-6-P level that prevents further influx of glucose into that cell. Different cells may express different requirements (1 increasing glucose uptake, the other blocking glucose uptake) depending upon the demands being made on the muscle at that time [5]. The rise in glucose use when looking at oxidation rates and focused on the crossover point between free fatty acid and glucose metabolism was observed to be at 65% of relative intensity [6].
"Saturation Kinetics" (where as much GLUT-4 carrier activity is increased to meet a demand within the cell) can therefore increase the velocity of transport of glucose across the membrane without significant change in substrate concentration within the cells. Other influences upon glucose transport can be modulated by catecholamines, hypoxia, growth factors and corticosteroids [7]. The action of each of these factors is relatively minor in relation to muscle fibre contraction and insulin effect. Although the velocity of transport across the cell membrane can increase markedly, the substrate concentration within the cell does not change significantly [8,9]. The changing demand for glucose utilization within the cell of contracting muscle may show as changes in blood glucose levels.
The use of a Maximal Lactate Steady State (MLSS) to identify the minimal lactate level during a step test following an all-out anaerobic effort has been demonstrated previously [10]. This methodology was further adopted where glycemia was measured while also measuring lactate, and demonstrated a similar power output value for both lactate minimum and glycemic minimum [11]. A similar lactate minimum and glucose minimum profile during incremental exercise following exercise induced lactate acidosis has also been demonstrated during B-androgenic blockage [12].
This study proposed that the glucose minimum value would be more affected by the initial high intensity bout of exercise. By carrying out an incremental test without the initial high intensity bout, and the associated increase in blood glucose levels, that a different response between lactate and glucose turn points may be observed.
Thirty-three national or international-standard swimmers (23 male, 10 female) participated in the study. The male swimmers (age 20.6 ± 2.04 years; body mass 85 ± 4 Kg; % body fat 9.4 ± 0.01) and female swimmers (age 20.4 ± 2.9 years; body mass 66 ± 3.93 Kg; % body fat 19 ± 2.4 %), all followed a similar program of training, involving 8-10 sessions of pool training per week. Training consisted of a mixture of low, moderate, and maximal intensity aerobic work, short sprints, and pool-based, stroke-specific drills and exercises. Weekly swimming training volume averaged 54 ± 19 km. All swimmers also carried out land-based resistance training, and flexibility work 3-5 times per week. The study was approved by the Christchurch College of Education Ethics Committee (09-2003), and informed written consent was obtained from all participants.
The subjects performed a graded sub-maximal swimming test consisting of 7 × 200 m swims, beginning each swim at 5 min intervals. The test was conducted in a 50 m pool. All swimmers were part of the same swimming squad who were midway through a training block, and had therefore undertaken an identical relative training load in the weeks prior to the test. Swimmers were asked to make no changes to their broader dietary practices, but were asked to be 2 h post-absorptive prior to the test. Glucose was sampled prior the first test swim. Pre-test warm-up was standardised at 1000 m. Each swimmer performed the seven progressive swims using free style and was instructed to maintain an even pace throughout each swim. This was in line with their normal training practices, so was a familiar task. The seven progressive target times for each swimmer was based upon each individual's personal best performance over that distance. The seven swims progressed from slowest to fastest in consistent increments over a range of approximately 30 s, equivalent to a rise in swim speed from about 70% of maximal race pace (first swim) to 100% of maximal race pace (seventh swim). Each 200 m swim began with a push start while the swimmer was partially submerged in the water.
Mean swimming velocity over the 200 m was calculated for each swim as well as the 100 m split times. Heart rate was monitored within 5 s of the completion of the swim with a Polar PE3000 heart rate monitor (Polar, Oy Kempele, Finland). Blood (25 μL) was collected from a finger-tip puncture from either hand prior to the first swim and 1 minute after the completion of each swim.
Lactate concentration and glucose concentration were analyzed by an ABL 700 Series Acid Base Analyzer (Radiometer-Copenhagen, Copenhagen, Denmark). AnT was calculated using three separate techniques: proposed by, Borch, Cheng and Kindermann [10,13,14].
The Glucose turn point (Gt) was used to compare results and was defined in this study as the first point in a group of three or more points that showed a continued rise in the level of blood glucose (Figure 1).
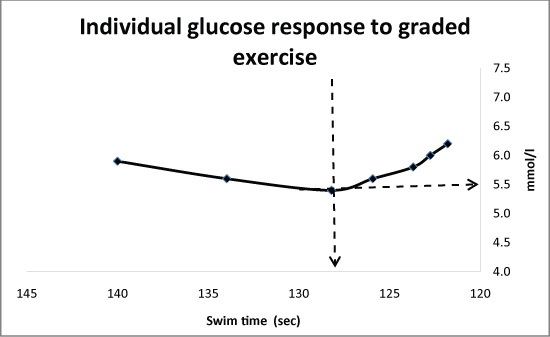 Figure 1: An example of an individual plot of the glucose values showing the Glucose turn point (Gt) from a discontinuous, incremental swim test. View Figure 1
The results were expressed as mean values ± Standard Deviations (SD). A one-way analysis of variance with repeated measures (glucose) was used to assess heart rate and swimming velocity at AnT, and Gt. T-tests were carried out to determine statistical differences between the markers as determined by the lactate or glucose profiles. Statistical analysis was completed with the Minitab (version 5) software package. Significance was set a priori at an alpha level of 0.05 and appropriate corrections made to account for multiple tests.
Typical fastest swim times (the 7th 200 m) were 121.27 ± 2.62 s (male) and 129.1 ± 3.33 s (female) giving an overall mean swim time of 125.2 ± 4.59 s indicating the highly trained nature of the subject group. Additionally, the heart rates achieved by the swimmers during the fastest swim (185 ± 11 beat/min - male; 182 ± 8 beat/min - female) and blood lactates recorded (11.9 ± 2.7 mmol/l - male; 10.8 ± 2.14 mmol/l - female) indicate the very high intensity of these swims.
The resting glucose for the thirty-three swimmers ranged between 4.5 and 6.7 mmol/l with a mean of 5.5 ± 0.57 mmol/l, which is in line with that previously observed in a training population [15] (Table 1).
Table 1: Comparison of responses of subjects at the three defined points. View Table 1
For each individual swimmer Gt was calculated and defined in this study as the lowest point prior to a group of three or more points that showed a continued rise in the level of blood glucose (Figure 1). This occurred during swim 1 (n = 5), swim 2 (n = 12), swim 3 (n = 12) and swim 4 (n = 4) at a mean level of 4.8 ± 0.39 mmol/l. The Gt occurred on average 0.73 mmol/l ± 0.53 mmol/l lower than the initial resting value (p = 0.0002) and 0.23 mmol/l lower than the subsequent high point at the end of swim 7 (p = 0.000).
The mean blood glucose response for all thirty-three swimmers during the progressive exercise is shown in Figure 2. The overall trend showed an initial decline in blood glucose, during the earlier low intensity swims, reaching a low point of 5.1 ± 0.45 mmol/l that was significantly different (p = 0.0002) to the resting value. This low point was followed by a steady rise as swim speed increased (as illustrated in Figure 2) resulting in a blood glucose level of 7.1 ± 1.1 mmol/l, at the end of the fastest swim that was significantly different to the glucose level seen at the lowest point (p = 0.0000).
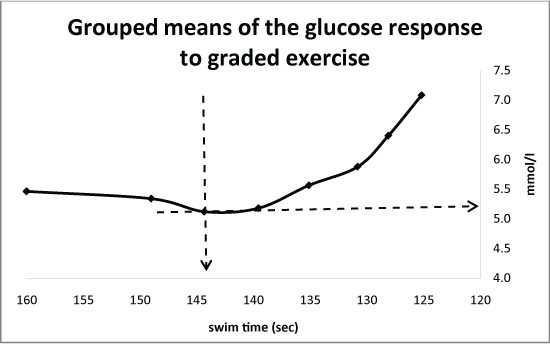 Figure 2: The group means of the glucose values showing the Glucose turn point (Gt) from a discontinuous, incremental swim test. View Figure 2
Blood glucose, was significantly different at Gt (4.8 ± 0.39 mmol/l) than at the three measures of AnT (Dmax - 5.59 ± 0.59 mmol/l; p = 0.000007; Borch - 5.58 ± 0.56 mmol/l; p = 0.0001; LogLog - 5.67 ± 0.80 mmol/l; p = 0.0003) (Figure 3 and Figure 3a).
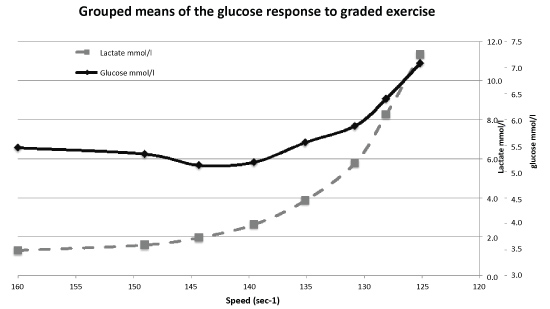 Figure 3: The group means of the glucose and lactate values from a discontinuous, incremental swim test. View Figure 3
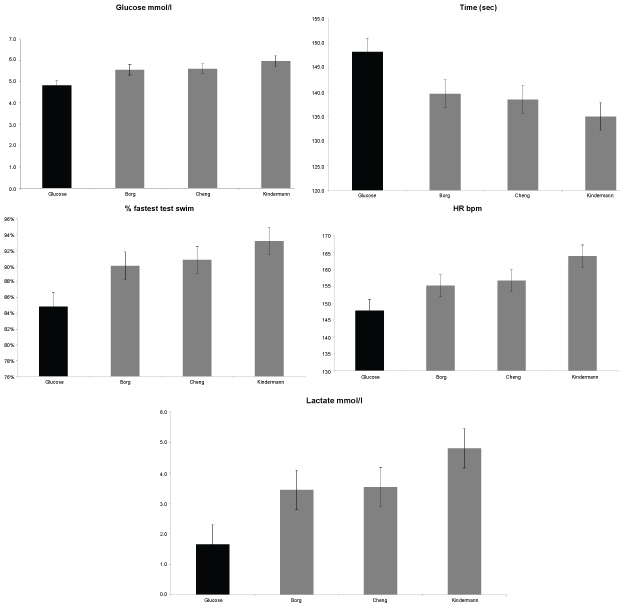 Figure 3(a-e): Significant difference in Gt and three methods of assessing AnT seen in Glucose, Time, Percentage of fastest test swim time, Heart Rate and Lactate. View Figure 3(a-e)
Swimming pace is represented by the average time (s) for completing 200 m. Swim pace at Gt (148.2 ± 7.07 s) was significantly different to swim pace at all three measures of AnT (Cheng - 136.4 ± 4.66; p = 0.0008; Borch - 137.5 ± 5.11; p = 0.012; Kindermann - 136.6 ± 7.00 s; p = 0.0002) typically occurring at a pace that between 8.5 s and 13.1 s slower than the AnT 200 m swim pace or meaning that Gt occurred at a pace that was between 6.08% and 9.69% slower than the pace at AnT (Figure 3b and Figure 3c).
The third measure used to represent intensity of exercise during the swim test was heart rate. There was a significant difference between the heart rates at Gt (147.2 ± 11.74 s) and heart rate at all three measures of AnT (Cheng - 153.9 ± 8.43 s; p = 0.0059; Borch - 153.5 ± 6.42 s; p = 0.0108; Kindermann - 157.0 ± 11.95 s; p = 0.00126) (Figure 3d).
The final measure that reflects the intensity of exercise, blood lactate, was significantly different at Gt (2.3 ± 1.12 mmol/l) to that seen at AnT (Cheng - 3.3 ± 0.94 mmol/l; p = 0.00002; Borch - 3.5 ± 0.79 mmol/l; p = 0.00001; Kindermann - 3.5 ± 2.32 mmol/l; p = 0.0008) (Figure 3e)
This study shows a clear turn point in blood Glucose (Gt) in relation to an increase in the intensity of exercise (Figure 2). The initial observed drop in blood glucose was similar to that sometimes seen during prolonged cycling and running [1] at the same intensity. Following the occurrence of Gt (4.8 ± 0.39 mmol/l), there was a significant rise in blood glucose through the following stages of the test, reaching its maximum (7.1 ± 1.1 mmol/l) at the point of highest effort Gt universally occurred at a lower exercise-intensity than AnT. This observation is supported by data from other researchers [6,15-19] who, although not directly identifying Gt, have suggested that factors other than the production of lactate influence carbohydrate metabolism prior to AnT. Irrespective of the method used to identify AnT (Borch, Cheng or Kindermann) and the method used to compare differences (glucose, lactate, heart rate or time), Gt occurred at between 6 and 10% lower intensity than at AnT.
Stimulation of the glucose uptake may occur prior to Gt (as was seen by the reduction in blood glucose of all subjects). Muscle contraction drives an increased uptake of glucose from the blood by stimulating Glut4 carrier proteins to proliferate to the cell membrane [3]. At lower intensities this appears to be additive to those stimulated by insulin [20]. Acute exercise increases the sensitivity of the cell membrane to insulin [21] further increasing the blood glucose uptake. As such, the increase in uptake of blood borne glucose is stimulated independently of the effect of insulin. This degree of effort may not require the use of any significant level of muscle glycogen until a potential "Threshold" requirement has been passed. This may also indicate the rate limitation of Glut-4 transporters [11], which would be additive to the occurrence of Gt.
As the relative intensity of exercise rose, a distinct upturn in the concentration of blood glucose was observed. It is known that the rate of appearance of hepatic glucose only rises marginally and would not account for this increase in blood glucose. More likely, the use of muscle glycogen creates sufficient G-6-P within the cell to prevent further circulating glucose from entering via the hexokinase route. The demand of increased intensity may see a proportional reduction in uptake of circulating glucose while the stimulus for glucose perfusion is not diminished (seen by a continual rise in hepatic glucose output). This would be supported by [22], who noted a significant increase in the use of muscle glycogen created by fast oxidative/glycolytic fibre recruitment. The critical switch point between circulating glucose and muscle glycogen use may be the Gt.
This consistent pattern of Gt occurring before AnT may support the premise that blood lactate is not the most sensitive indicator of the enhanced metabolism of carbohydrates in the muscle during exercise [23-25]: Gt appears to be an earlier indicator of this up-regulated glucose metabolism, and changeover in glucose source. These observations appear to support the view that the AnT may be related to the efflux of lactate from muscle and the uptake of lactate from the blood by other muscles and tissues rather than being a direct reflection of glycolytic activity per se [26]. Although in runners it was observed that the minimum glucose level occurred at the same intensity as AnT [11], this present study, disagrees with that finding. The current use of a different protocol, where there was no prior high intensity bout that would lead to both increased blood glucose and lactate acidosis, appears to show a glucose turn point occurring sooner that the observed AnT.
There are several potential mechanisms behind the changes observed in blood glucose. At lower intensities, uptake of glucose from the blood into the working muscle fibres (particularly by type 1 fibres) continues to rise as exercise intensity increases [19] prior to Gt. This may be responsible for the reduction of blood glucose observed prior to Gt. The rise in blood glucose observed with increasing exercise intensity may be the result of the increased percentage of muscle fibres recruited, and or the type of fibers recruited. An increase in the use of oxidative-glycolytic type II a [22] would increase the rate of glycolysis in the working muscle. This may also be linked to an increased rate of glucose oxidation prior to the rise in blood glucose. Such a response would support the suggestion that the events and mechanisms associated with glycolysis and muscle lactate accumulation take place prior to observable blood lactate increases [27,28].
It is proposed that Gt indicates an increased rate of glycolysis [28] or, more specifically, increased muscle glycogen usage. The potential "threshold" of glycolytic activity is then passed as the increased use of glycogen and formation of Glucose-6-Phosphate (G-6-P) will reduce the relative uptake of glucose from the blood while the rate of perfusion may also continue to increase [25]. It cannot be excluded that the rise in blood glucose is related to greater release of glucose from the liver due to increased catechol amines, which can be altered with training and mediate a change in the response of Gt [16]. Even when a β-adrenergic blockade was used, a similar blood glucose event to Gt occurred [12]. This suggests that in exercise the onset of Gt is independent of β-adrenergic influence. Gt may therefore show the point where the rate of glucose uptake is sufficiently decreased due to the rate of perfusion not being sufficient to maintain an effective energy balance within working muscle.
If there is a change in the metabolic activity as intensity rises from the Gt to the AnT, an increase in the use of glucose metabolism per se does not mean that there is necessarily an increase in anaerobic production of energy. The rise in the predominance of glucose metabolism may be an important marker for the increase in intensity of exercise if the source of the glucose comes increasingly from muscle glycogen, and may represent a situation where exercise glycogenolysis is so fast in the formation of G-6-P that the activity of hexokinase becomes limited to the point of reducing glucose uptake across the cell membrane. The uptake rate is only limited in oxidative fibres by the concentration of glucose available to be transported across the membrane [24]. The metabolic state and number of fibres recruited will therefore affect the overall blood glucose concentration [24,29].
The findings in this study may prove helpful for identifying the most beneficial exercise intensities to train the aerobic system to use a non-muscle glycogen fuel source. This is different from where previously Lactate and heart rate have been used [30]. This may also be useful for identifying for diabetics the intensity past which blood glucose will rise rather than fall. It is generally assumed that blood glucose will drop in diabetics with exercise. This may require further investigation and clarification as the findings of this study appear to suggest that once exercise intensity reaches a specific point the opposite may be true. Certainly observations in competition environments have suggested that the rise in blood glucose may create excessively high blood glucose readings in diabetics, but this is outside the scope of this study.
The Gt appears to be a marker of relative exercise intensity that fits between the crossover proposed by Brooks and traditional measures of AnT and may therefore be useful for monitoring intensity at levels at which athletes typically train. The Gt may be important in estimating the relative glucose oxidative ability of the working muscle that has been inappropriately assumed to date by relying on the accumulation of lactate in the blood. A rise in the predominance of muscle glycogen as a fuel would be an important marker for the increase in intensity of exercise, separate from lactate accumulation [31]. The findings of this study agree with previous studies [28,32] in that the events and mechanisms associated with glycolysis and lactate accumulation take place prior to observable increases in blood lactate. In this study Gt was clearly seen to be different from AnT. The Gt may be important for ensuring the correct prescription of exercise intensity for training.
The Gt may prove to be an important marker in the identification of exercise intensity. misconception's regarding the relative oxidative and glycolytic contributions at anaerobic exercise intensity were widely seen through using lactate alone. The identification of Gt may allow better assessment of the relative improvement or decrement of aerobic oxidative metabolism with training or detraining.