Computed Tomography (CT) is an efficient and non-invasive method to obtain data about internal structures of the human body. CT scans contribute with the highest absorbed doses in population due X-ray beam attenuation and it has raised concern in radiosensitive tissues. Techniques for the optimization of CT scanning protocols in diagnostic services have been developing with the objective of decreasing the absorbed dose in patient, aiming image quality within acceptable parameters for diagnosis by noise control. Routine head scans were performed using GE CT scan of 64 channels programmed with automatic exposure control and voltages of 80, 100 and 120 kV attaching the noise index in approximately 0.5%, using the tool of smart mA. Radiochromic film strips were placed into an anthropomorphic adult male phantom to measure the absorbed dose deposited in areas such as lens, thyroid and pituitary gland for study of dose deposited in these important areas containing radiosensitive tissues. Different head scans were performed using optimized values of mA.s for the different voltages. The absorbed dose measured by the film strips were in the range of the 0.58 and 44.36 mGy. The analysis of noise in the images is within the acceptable levels for diagnosis, and the optimized protocol happens with the voltage of 100 kV. The use of other voltage values can allow obtain better protocols for head scans.
Computed Tomography, Anthropomorphic Phantom, Dosimetry
Recently demand for diagnose images by CT has grown considerably, with the consequence that increases the radiation dose rates in the population. For this reason they seek and implement strategies to reduce the dose deposited in patients [1-3].
Automatic exposure control was introduced in CT in the decade of 1990 for procedures in nuclear medicine and radiation therapy [4], which consists in change levels of current that feeds the X-ray tube as soon as scanning takes place in proportion to the density of tissues which attenuate the X-ray beam. This type of control is used most frequently in chest routines because in this area has a higher variation in lateral and frontal diameters.
In sensitive organs to radiation scans are research topics by risks and high chances of developing serious illnesses such as for example the lens that may develop cataracts to have exposure greater than 2 Gy according to ICRP [5,6].
The objective of this study is to determine the rates of absorbed dose in lens; pituitary and thyroid using current levels optimized and voltage levels of the tube of 80, 100 and 120 kV, and perform analysis of image quality.
Experiments were performed a multislice in helical mode of a male adult anthropomorphic phantom. To study the deposited doses in lens, thyroid and pituitary gland, were used strips of radiochromic film.
The CT scanner used is a General Electric Discovery of 64 channels Equipment is of a multislice that enable explorations in helical mode.
The male anthropomorphic phantom, model Alderson Rando, was used for conducting head and neck examinations. This phantom is constituted by a human skeleton coated material possessing physical and chemical characteristics similar to the soft tissues of the human body. The phantom head and chest are structured in 34 slices of 2.5 cm thick, from which the first 11 slices were used for this study. In the interior of the phantom there are openings that allow to place of dosimeters for record doses. Figure 1 show the phantom positioned in the gantry isocenter of the CT scanner [7].
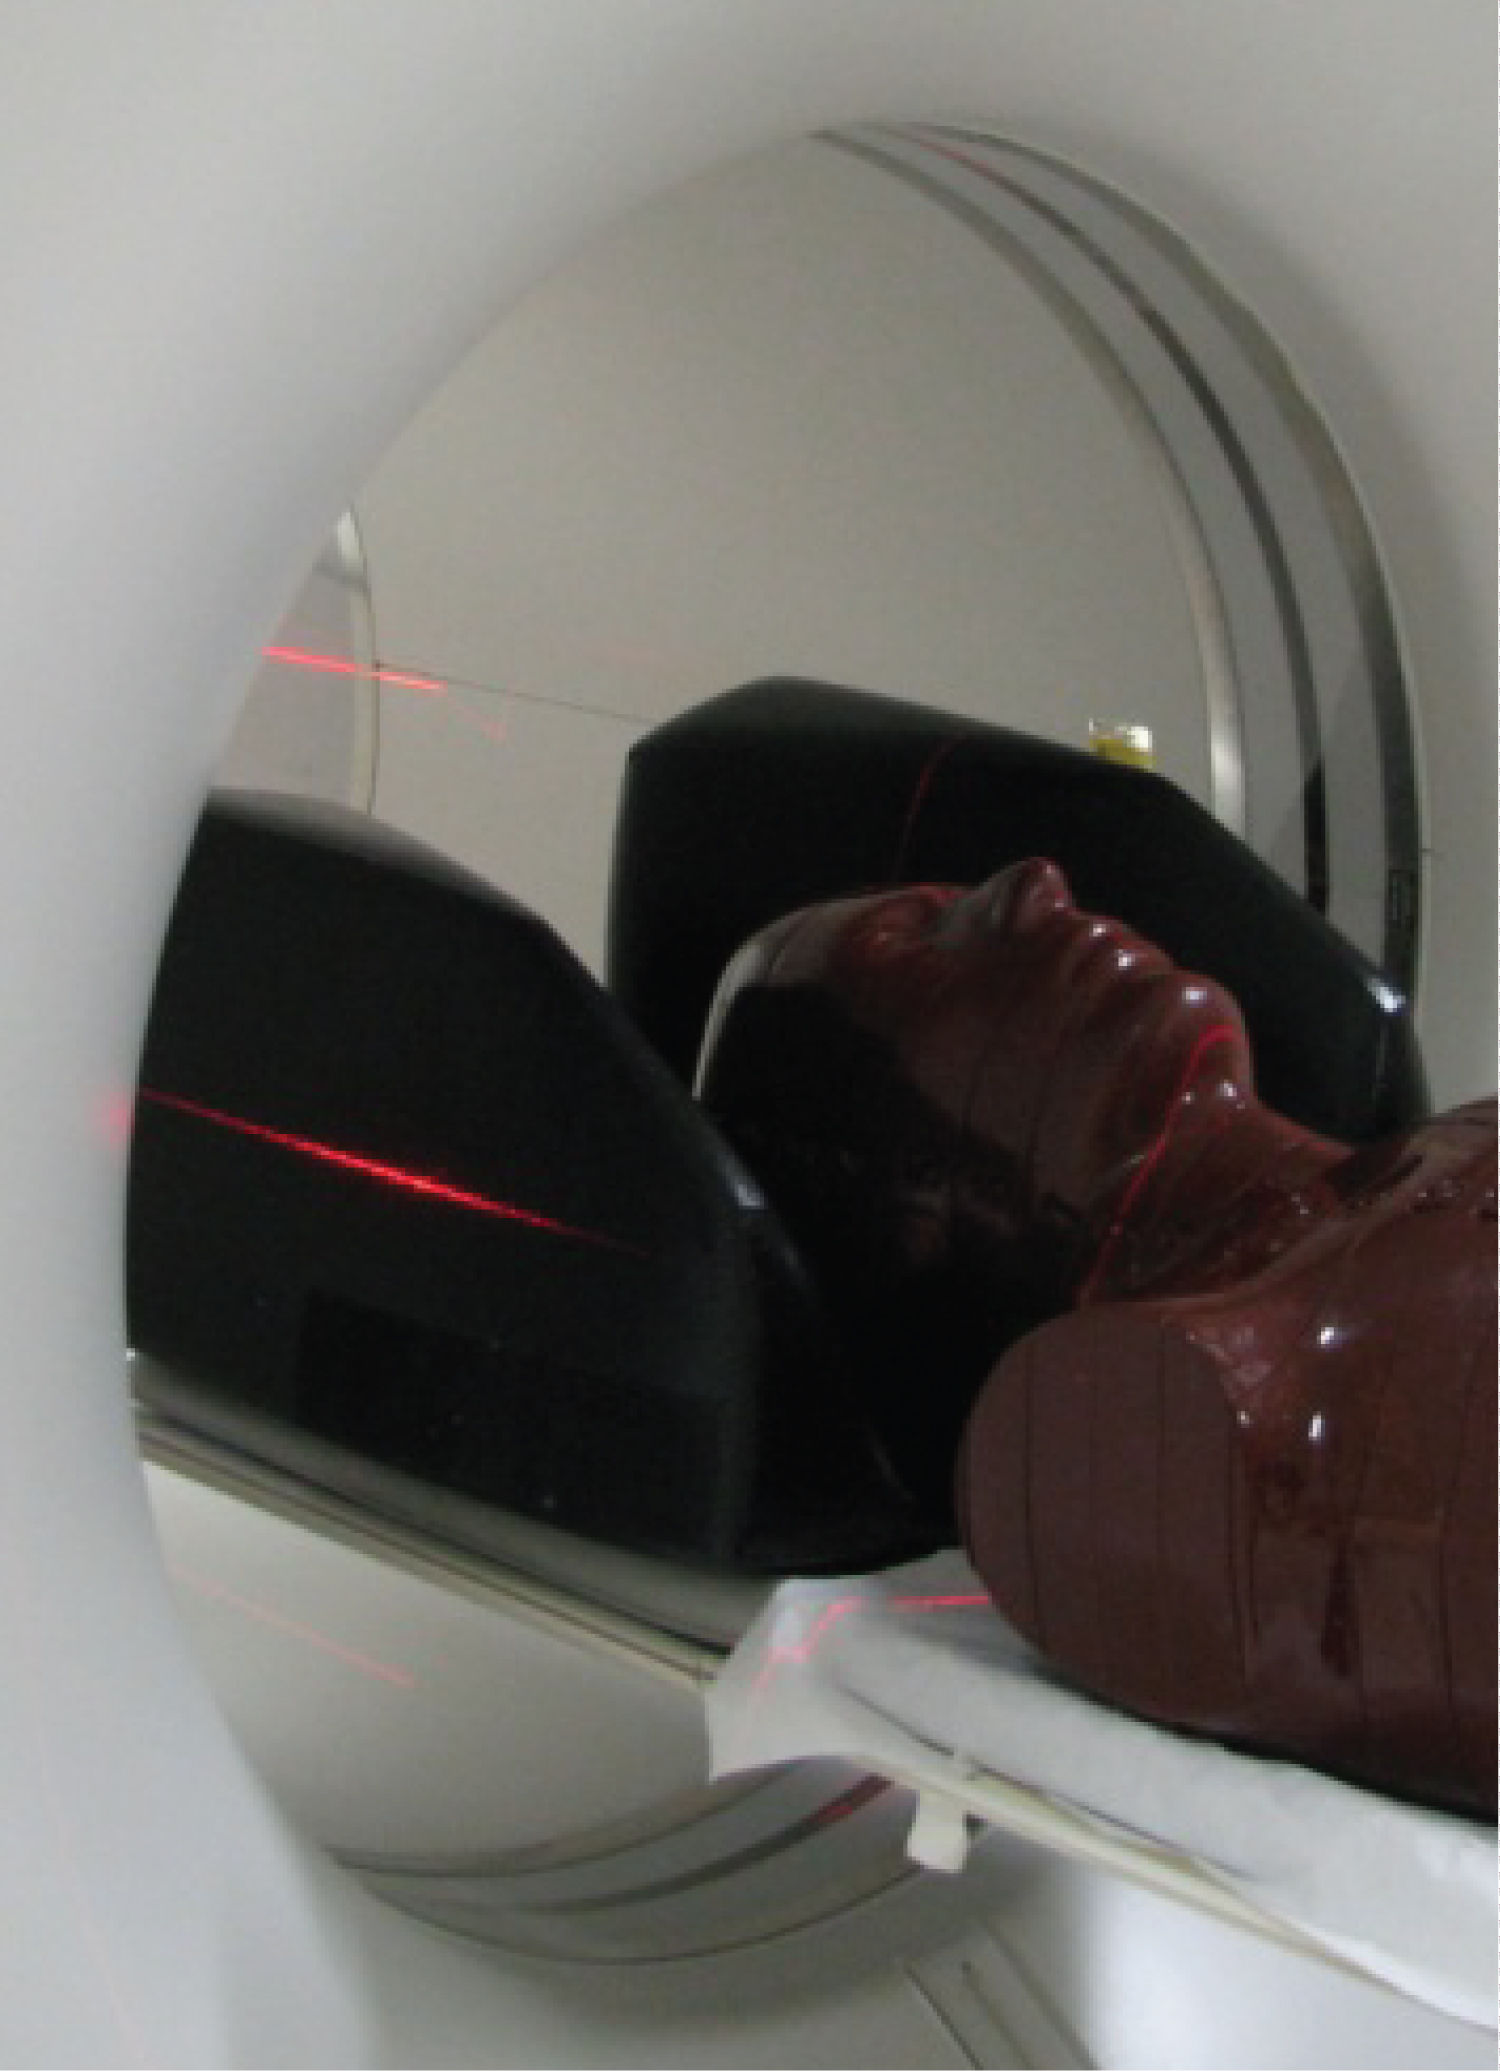 Figure 1: Phantom positioned in the isocenter of the gantry.
View Figure 1
Figure 1: Phantom positioned in the isocenter of the gantry.
View Figure 1
Preliminary scans were carried out using the automatic exposure control for each voltage value in order to determine the average current value and then used as a constant current value in the acquisition protocols that were made because head scanning is done with fixes current. Figure 2 presents the scout image of the head, and neck area and part of the chest such as delimitation of the scanning volume. In preliminary scans were not located for dose record films. The protocols used in the exploration of the central region of the phantom in helical mode, are described in Table 1.
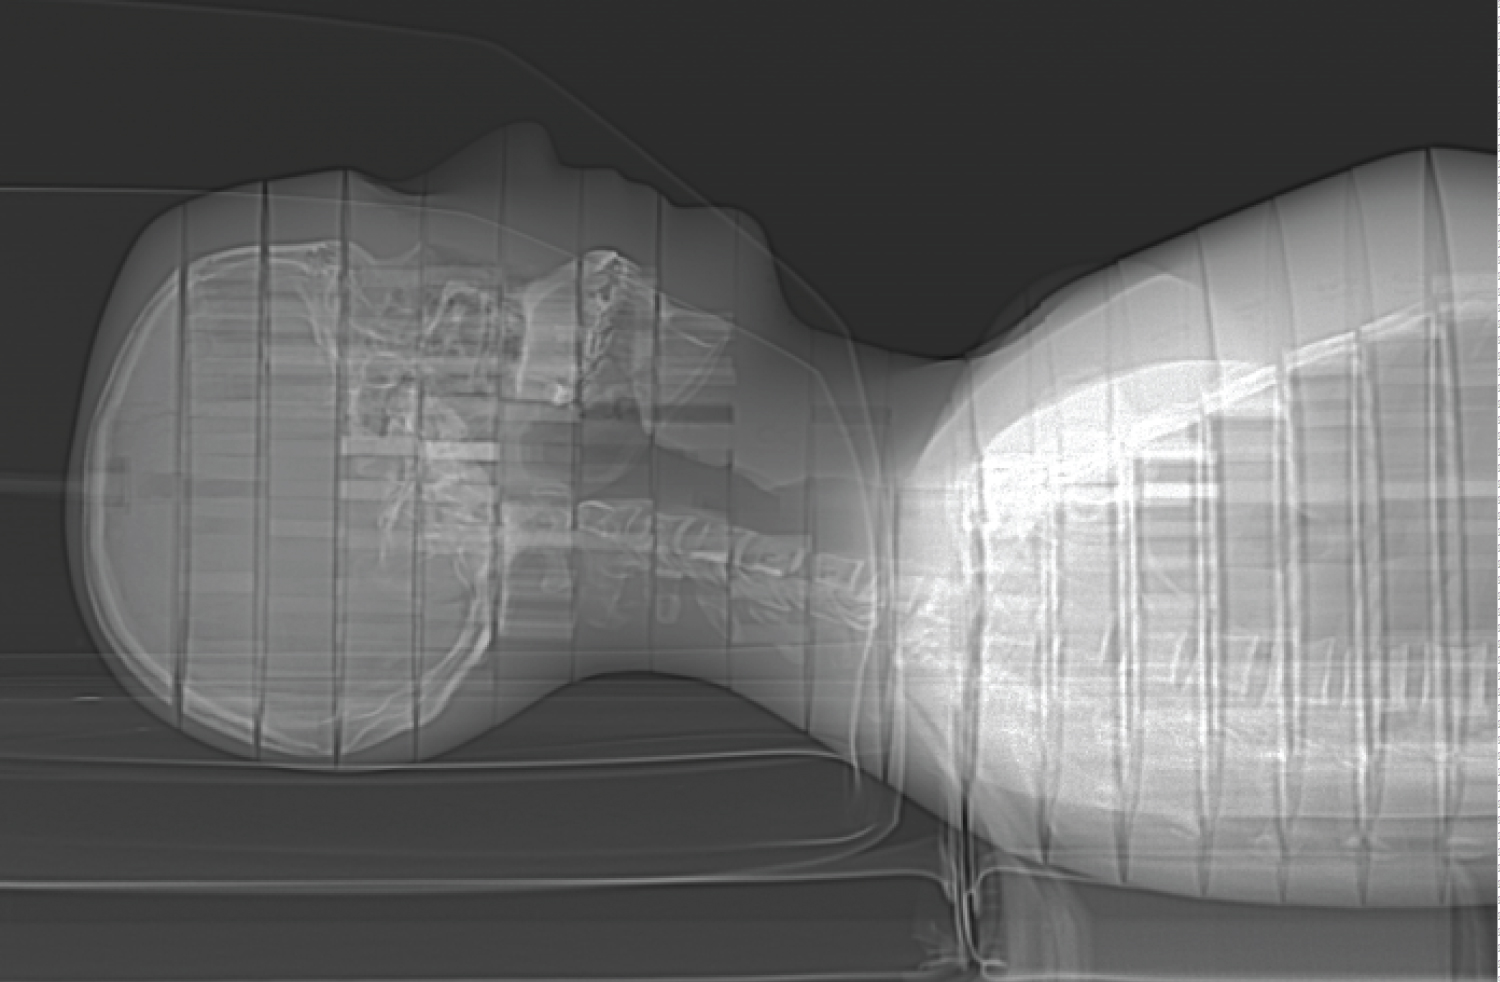 Figure 2: Scout of phantom without radiochromic films.
View Figure 2
Figure 2: Scout of phantom without radiochromic films.
View Figure 2
Table 1: Helical mode acquisition protocols. View Table 1
To determine the value of current average for each value of voltage used, were located the filmstrips being placed on the surface of the eye (left and right), throat and inside of the where lens, the thyroid and pituitary gland would be located. Figure 3 show the placed of radiochromic film strips on the surface of the phantom. The strips recorded dose in the pituitary gland is located in the interior of the phantom.
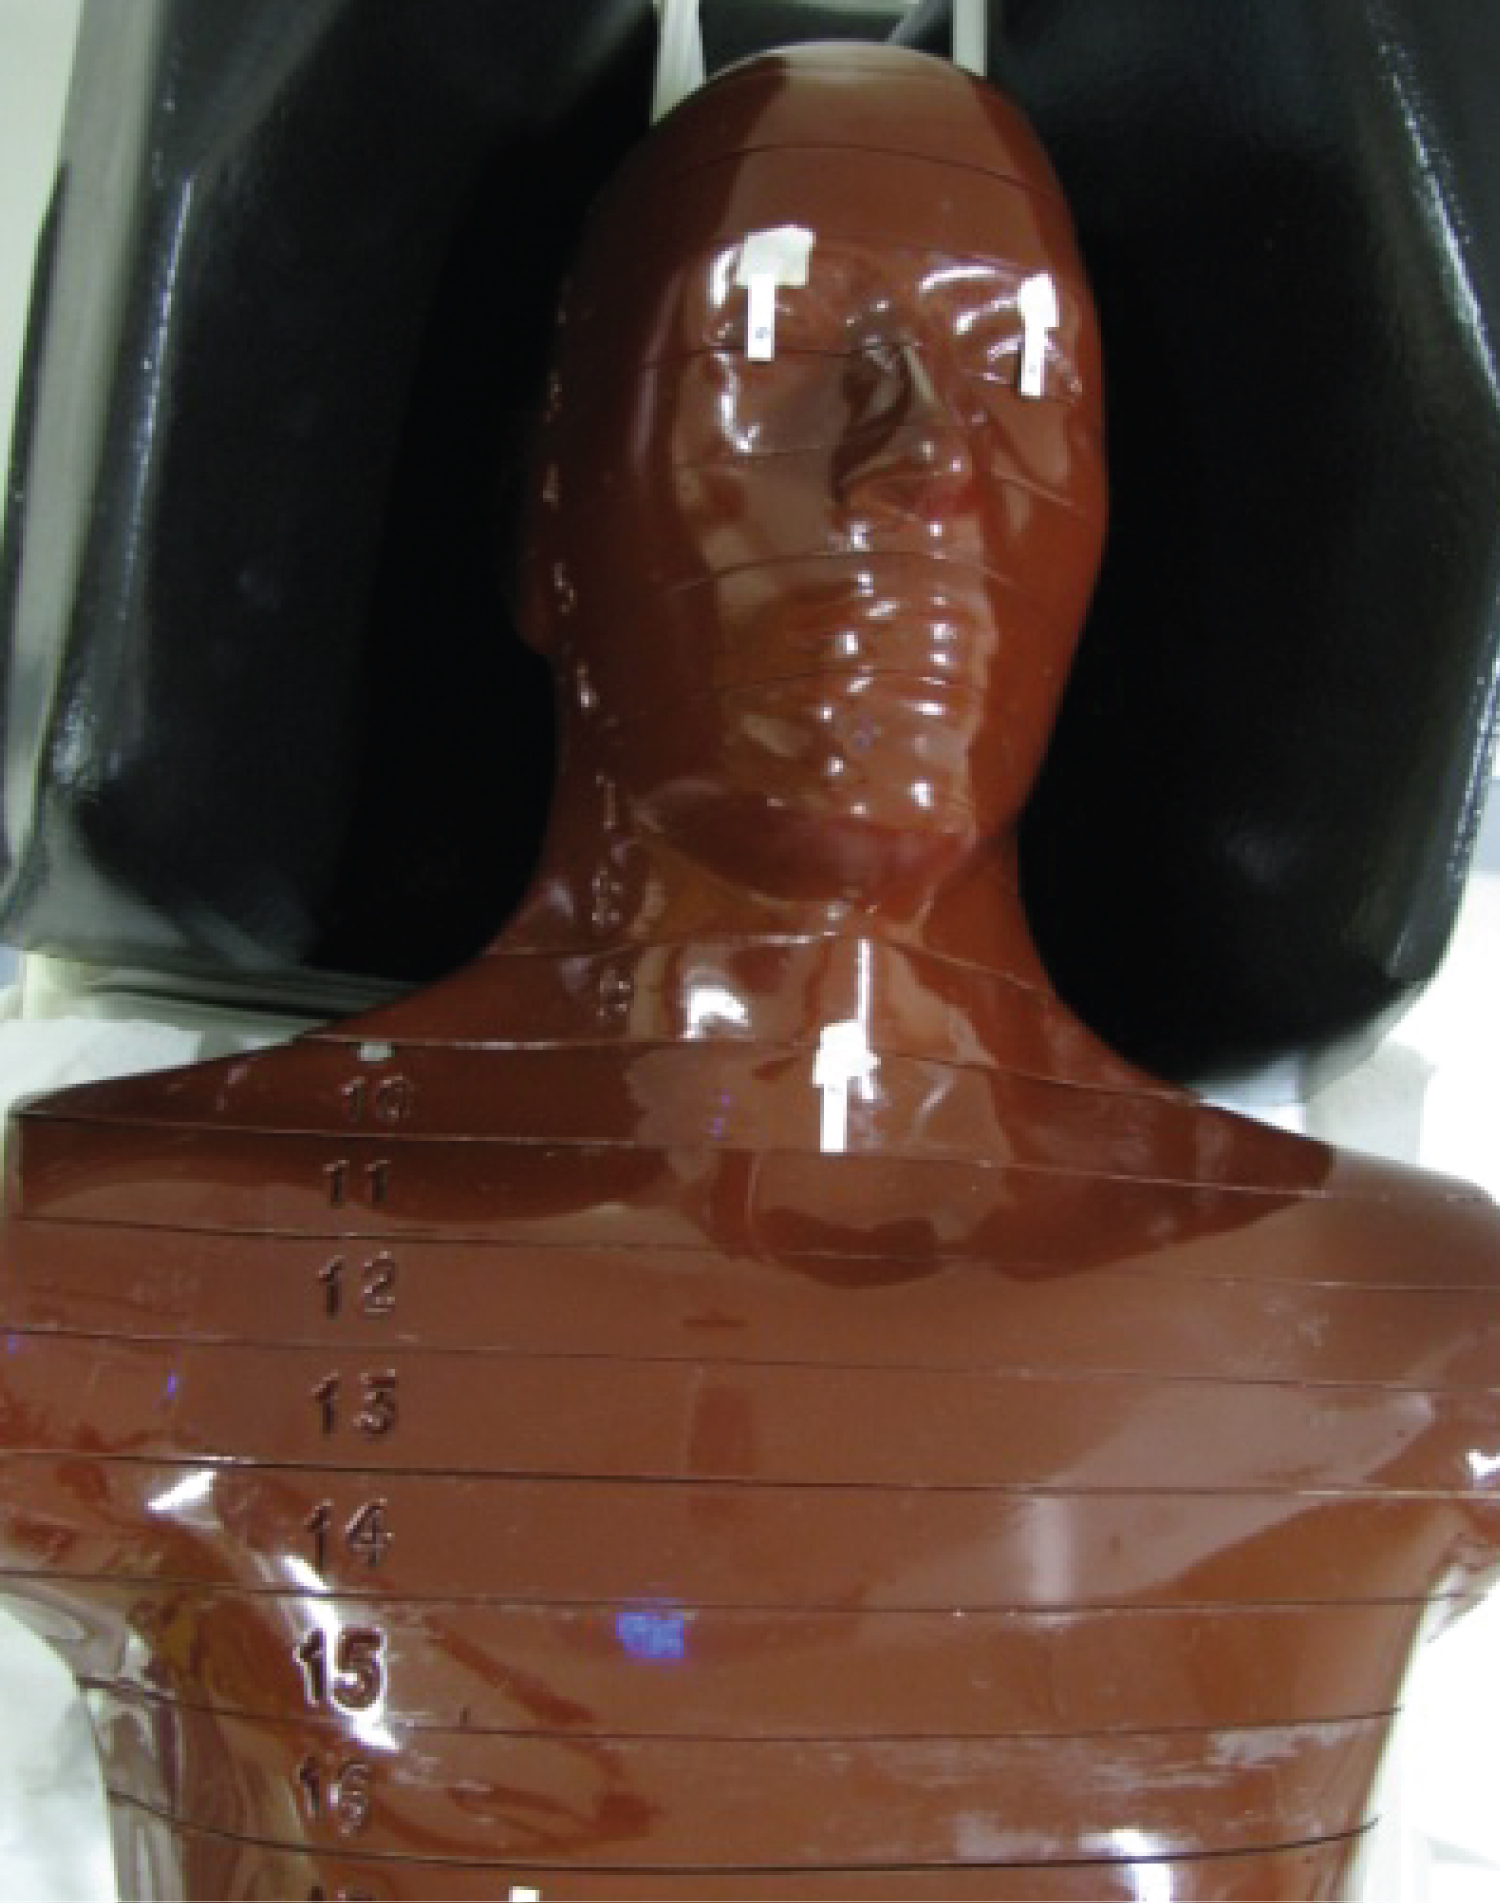 Figure 3: Film strips located on the surface of the phantom.
View Figure 3
Figure 3: Film strips located on the surface of the phantom.
View Figure 3
Absorbed dose measurements were performed using strips of radiochromic film GAFCRHOMIC XR-QA2 with dimensions of 0.5 × 2.5 cm2. The films show a proportional darkening to the amount of energy deposited when they are exposed to ionizing radiation.
These radiochromic films was developed for quality control of beams of ionizing radiation and are barely visible with light-sensitive response in the range of 0.1 to 20 cGy dose record and can be used for X-ray beams on a supply voltage of X-ray tube ranging from 20 kV and 200 kV [8].
The strips were tagged and identified for each protocol; each film strip was irradiated only once. It was considered a time of 24 h for the treatment of films post-irradiation [9,10]. They were scanned strips on a Hewlett Packard Scanjet scanner G4050 model, at a resolution of 300 ppi using ImageJ software performing RBG split color for darkening on scale of intensity values was selected the red channel.
From the curves of calibration of the films obtained for each voltage level, and corrected by the width of the X-ray beam, were calculated values of absorbed dose deposited in each of the strips [11,12].
For the analysis and validation of the image quality, it was selected the central slice CT image of the head region the image of the central slice with the purpose of studying the interference of the scattering radiation. For this, a region of interest (ROI) was defined in an image of each protocol to be compared within the parameters of diagnostic image quality.
Absorbed dose values reported by strips of radiochromic film for lens (left and right), the pituitary gland and the thyroid respectively are shown in Figures 4, Figures 5 and Figures 6.
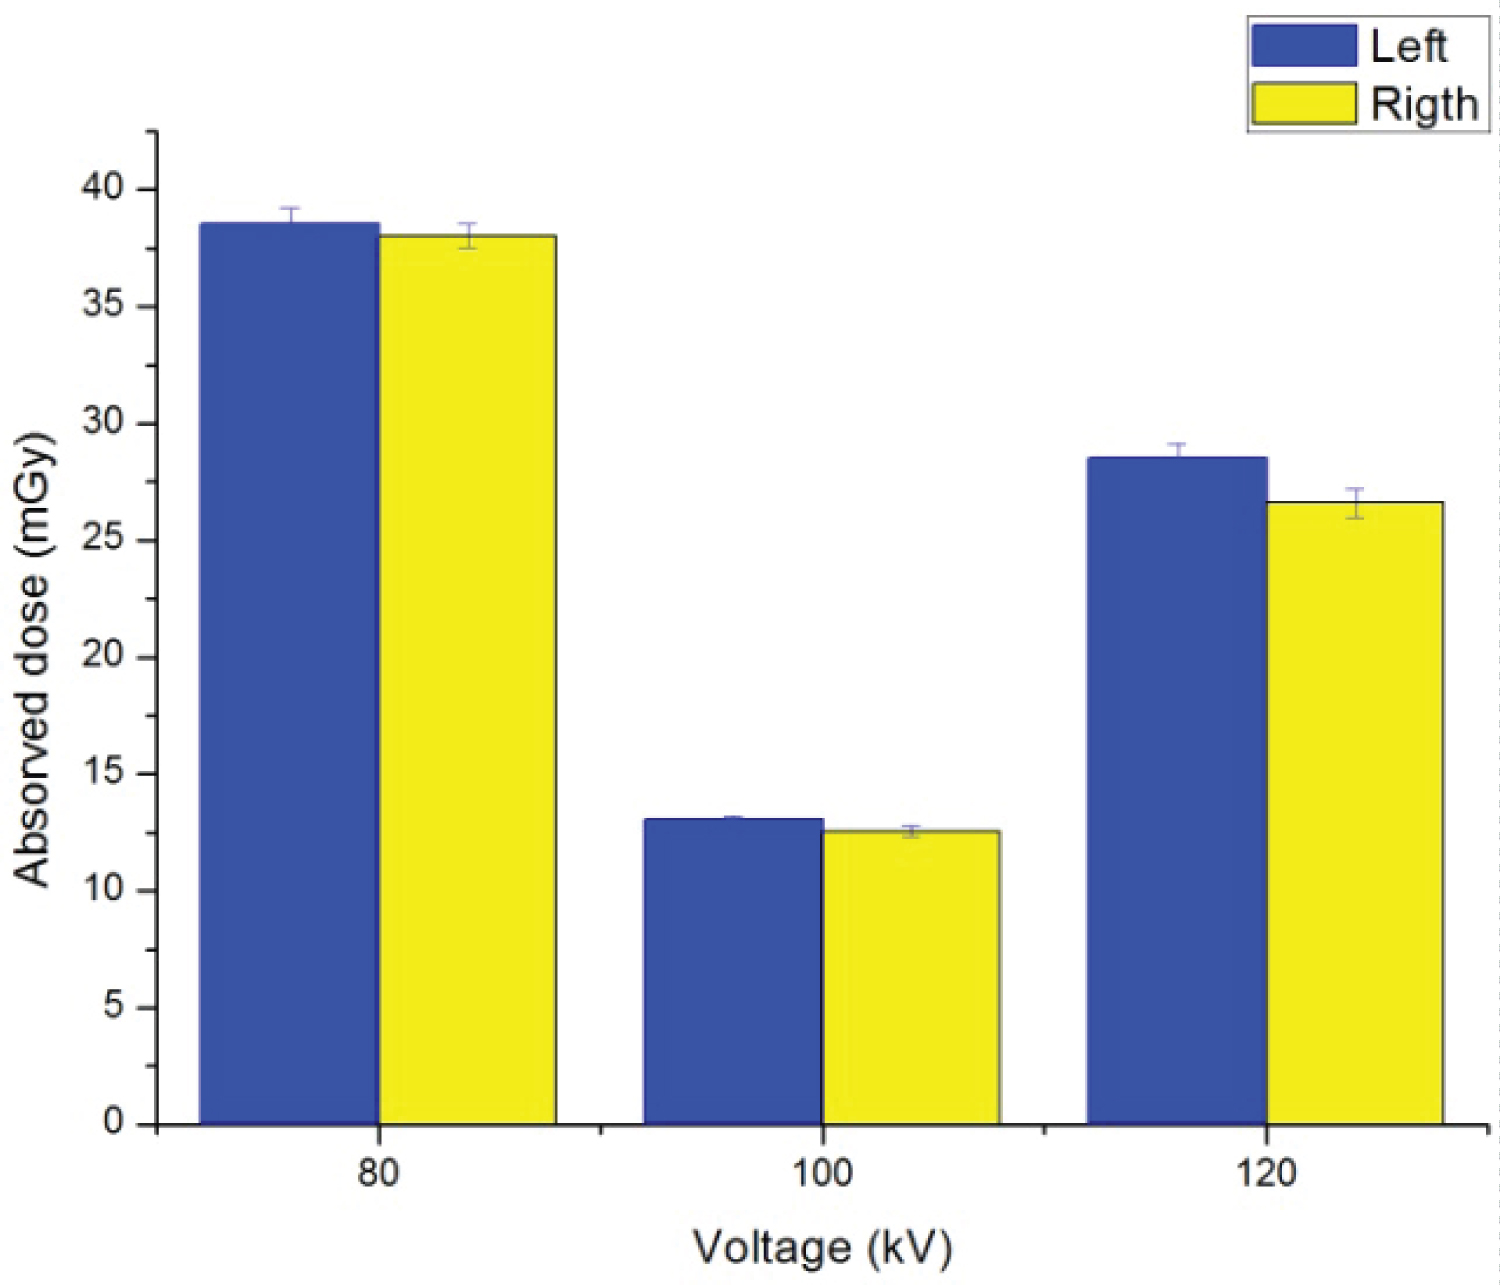 Figure 4: Absorbed dose recorded by the lens.
View Figure 4
Figure 4: Absorbed dose recorded by the lens.
View Figure 4
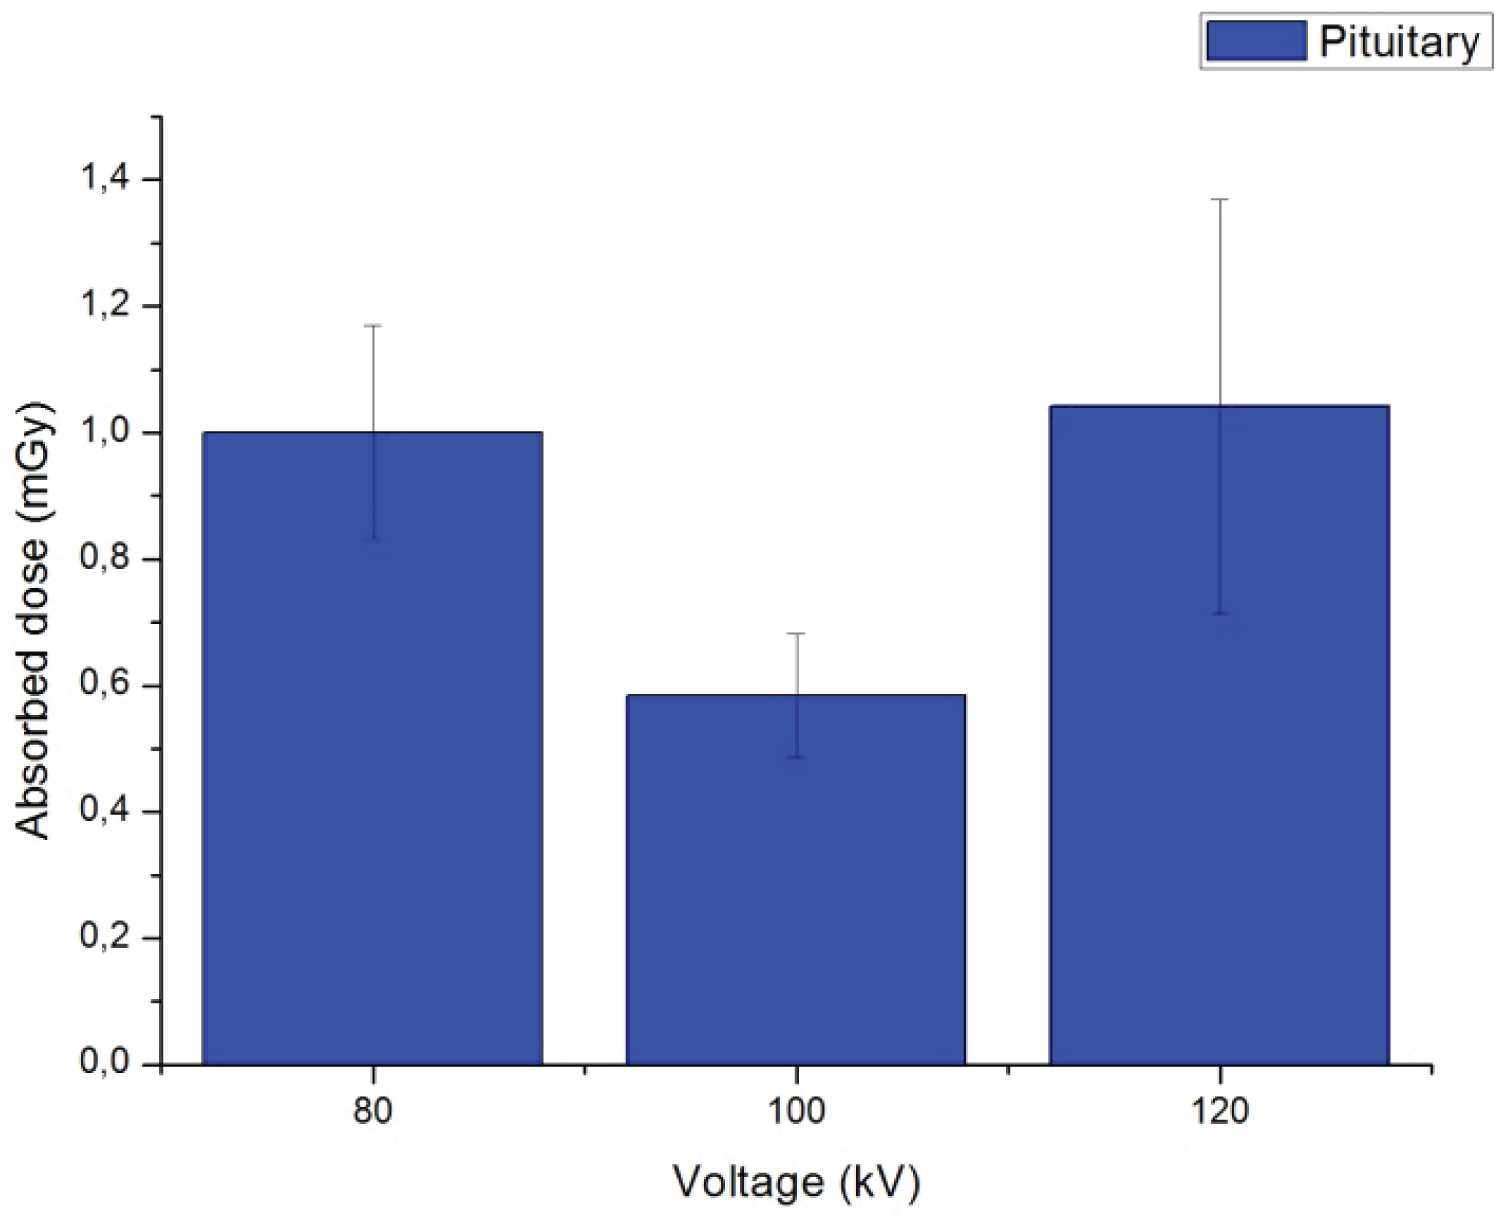 Figure 5: Values of absorbed dose in the pituitary gland.
View Figure 5
Figure 5: Values of absorbed dose in the pituitary gland.
View Figure 5
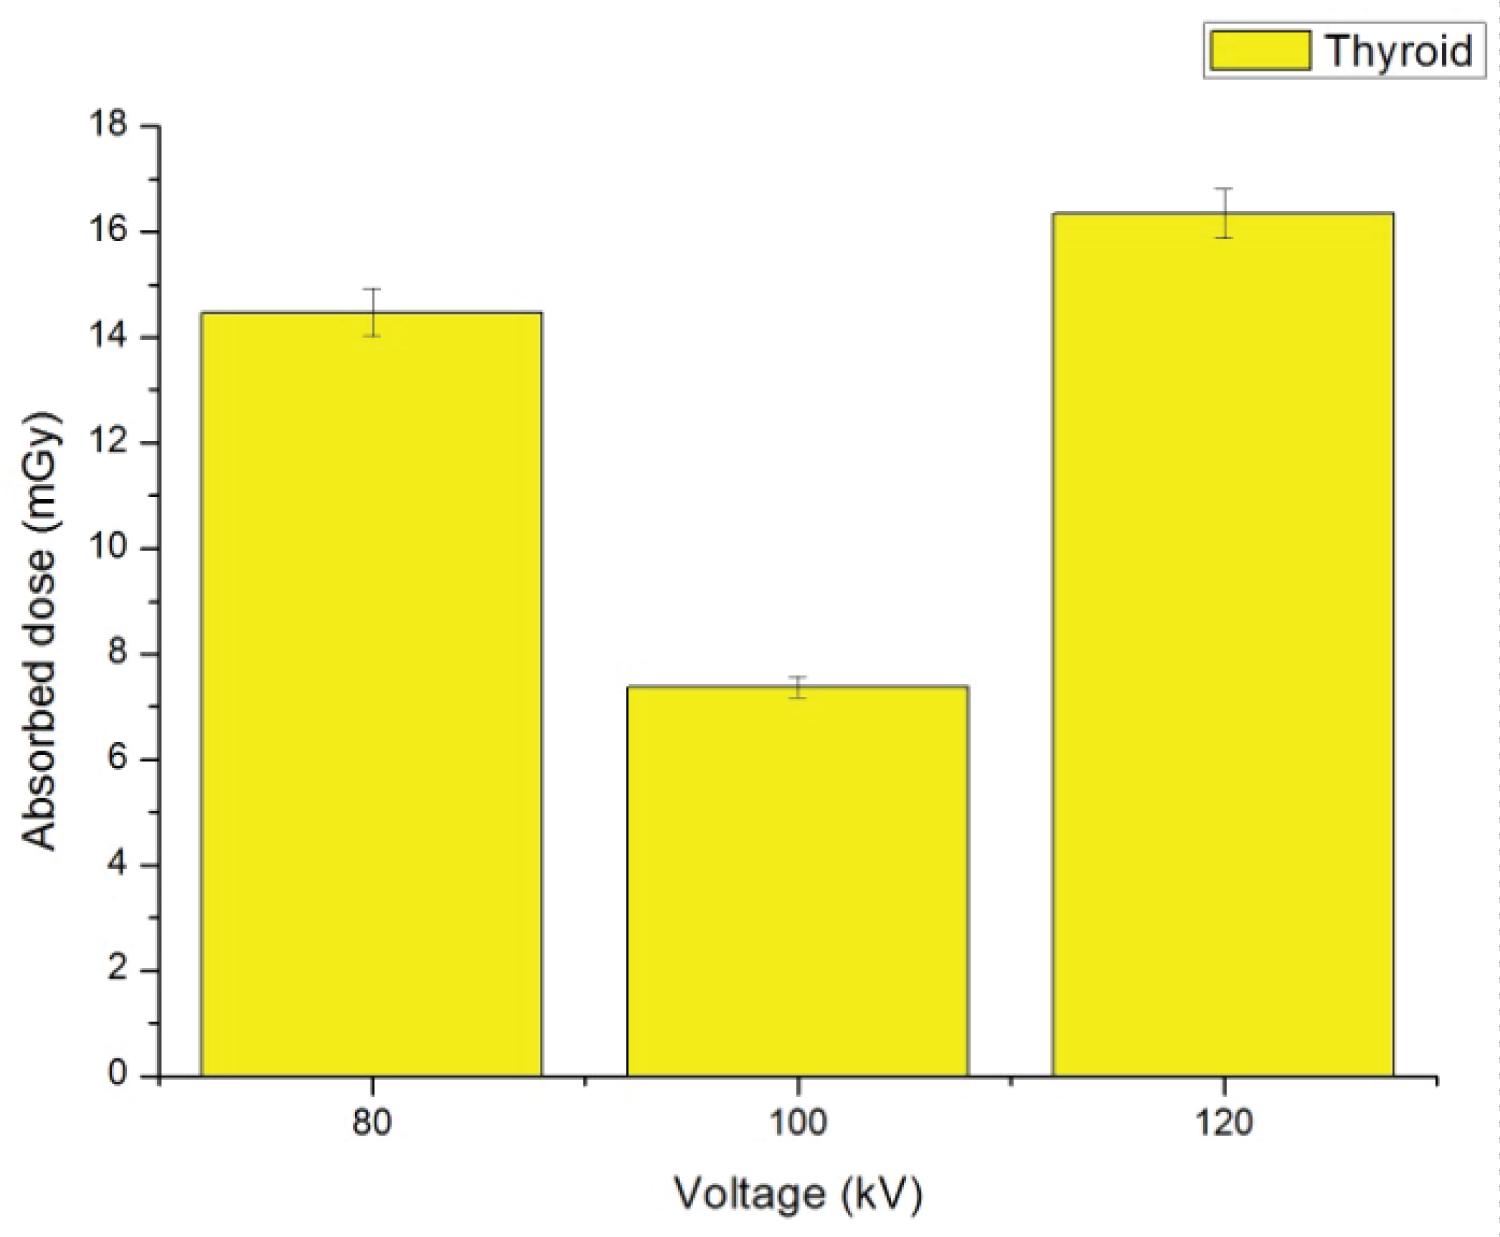 Figure 6: Absorbed dose registered in the thyroid.
View Figure 6
Figure 6: Absorbed dose registered in the thyroid.
View Figure 6
Absorbed dose values recorded by the film strips show higher values for the right lens for the three protocols used, with differences of 1.3% to 80 kV, 3.8% to 100 kV and 6.6% for 120 kV. Taking as a reference the values of absorbed dose for 120 kV, since that is the voltage used in the CT head scans in the service of radiodiagnostic, with 80 kV voltage right lens recorded an increase of 7.7% and 17.10% left. For the voltage of 100 kV decreases of 62.20% and 61.06% were recorded respectively. As the Protocol for the 80 kV voltage who deposited the highest values of absorbed dose in the lens. The absorbed dose values for lens reported by Fearon, et al. are lower because an image acquisition protocol was used using the 120 kV of voltage and a charge of 100 mA.s [13].
Film strips located inside of the phantom in the region where it is located the pituitary gland recorded, for the Protocol using 80 kV voltage, a decrease in values of absorbed dose of 28.94% and 115.89% for 100 kV in relation to the values recorded for the routine with 120 kV of voltage. The Protocol, which recorded higher values of absorbed dose for this organ was which used 120 kV of voltage. The higher Deviation Standard values are probably for scattering radiation from interaction between X-Ray beam and materials of anthropomorphic phantom.
Thyroid region shows significant decreases in the values of absorbed dose for protocols using voltages of 80 and 100 kV in relation to the routine protocol, to 80 kV voltage is recorded a difference of 39.84% and for the voltage of 100 kV 167.77%. Showing for this organ, the protocol whit 120 kV of voltage was that recorded higher values of absorbed dose.
The CTDIvol and DLP were recorded from the scanner and CTDIw for each voltage used in this study are shown in Table 2.
Table 2: CTDIvol, DLP and CTDIw values for each voltage of X-Ray tube. View Table 2
For process of protocols optimization in CT is necessarily make the comparison between the values used and reference values. According the European commission, the reference values for head CT scans are 60 mGy for CTDIw and 1050 mGy.cm for DLP [14]. The differences found between the CTDIw values used for each voltage and the reference values are 61.83%, 55.71% and 52.23% for 80, 100 and 120 kV respectively.
Analysis of quality of the images was performed using the RadiAnt software to obtain average values of intensity in Hounsfield scale (HU) and its standard deviation to calculate the percentage of noise that has images for each protocol used in this study. Table 3, shows the noise values used for each voltage.
Table 3: Noise percentage for each voltage. View Table 3
The ROI selected to perform the analysis for three levels of voltage are approximately in the central region of the phantom third slice. Using current values optimized for each protocol, there is that images have a noise around to 0.5%.
The values of absorbed dose in lens do not exceed levels recommended by the ICRP for a likely development of cataracts. However, the Protocol obtained higher concentrations of absorbed dose was 120 kV X-ray tube voltage.
The Protocol that used the voltage of 80 kV, same as the value of current (mA) was in comparison to the three protocols, which recorded higher values of absorbed dose in the lens. This protocol is the one with the smallest values of CTDIw and DLP when compared to reference values.
In the region of the thyroid, the protocol which recorded lower rates of absorbed dose was that used the voltage of 100 kV. It was therefore the optimized protocol which recorded the lowest values of dose in the three regions at the same time.
Found noise percentages, are within the parameters established for images of diagnostics, to be about 0.5% indicates that three protocols generate images with similar qualities for diagnosis.
The authors are thankful to CAPES, FAPEMIG for their support in developing this study & CDTN/CNEN for the loan of the phantom.