To evaluate the correlation of classified PI-RADS score 3 lesions in TZ with dynamic enhancement in multiparametric-prostatic MRI.
We reviewed retrospectively 24 patients over a period of two years. Contrast curve types of prostatic PI-RADS 3 lesions in the TZ were elaborated with a dedicated MRI-software. Histopathologic results after prostatic biopsies were evaluated to determine, if there is a correlation with any curve type after endovenous contrast medium.
We found no significant statistical correlation between the curve type and the histopathological results in the transition zone of the prostate.
Contrast enhancement evaluation to determine specific curve types in focal prostatic PI-RADS 3 lesions in the transition zone has no diagnostic value.
• Transition Zone (TZ) - prostatic cancer is better to detect with transperineal biopsy.
• Dynamic contrast enhanced perfusion - MRI does not improve the localization and characterization.
Prostate, Perfusion, Biopsy
TZ: Transition Zone; PZ: Peripheric Zone; PI RADS: Prostate Imaging Reporting and Data System; PSA: Prostate-Specific Antigen (PSA); DCEP-MRI: Dynamic Contrast-Enhanced Perfusion MRI; mp-MRI: Multiplanar-MRI; EWS: Extended Workstation (EWS); PZpm: Peripheric Zone Postero-medial; ROI: Region of Interest; BPH: Benign Prostatic Hyperplasia; TTPM/B: Transperineal Template Prostate Mapping/Biopsy; PSMA: Prostate Specific Membrane Antigen
Prostate cancer is the most frequent cancer type in males, but only about 20-30% of prostatic cancer originate in the TZ. The diagnosis is based on the prostate-specific antigen (PSA) screening in males over 40 years and transrectal or transperineal ultrasound-guided prostate biopsy. Prostate multiparametric MRI is indicated in patients with increasing PSA values (over 2, 5-3 ng/ml) and negative prostate biopsies and in patients with suspected trans-rectal palpation results.
Multiparametric-magnetic resonance imaging (mp-MRI) is indicated in localization and staging of clinically significant prostate cancer. Today every prostatic mp-MRI is performed with contrast agent, to assess the dynamic contrast perfusion (Dynamic Contrast-Enhanced Perfusion MRI) of prostatic tissue. In 2015, with the support of the American College of Radiology, was developed the PI‐RADS Version 2. The goal was to promote global standardization and to reduce variability in reporting Prostatic MRI [1]. DCEP MRI can be useful in combination with T2 Sequences and DWI Imaging in the characterization of focal prostatic lesions in the peripheric (PZ) and in the transition zone (TZ). Furthermore, enhancement alone is not definitive for clinically significant prostate cancer, and absence of early enhancement does not exclude the possibility [2].
The TZ surrounds the part of the prostatic urethra, that passes through the prostate. This zone gets bigger with increasing age, a condition called benign prostatic hyperplasia (BPH). TZ prostate cancers have a relatively lower Gleason score [3], local stage [4] and biochemical recurrence rate [5] in comparison with peripheral zone cancers prostate cancer. Transition zone (TZ) tumors are estimated to account for approximately 30% of prostate cancer cases and pose a clinical challenge because of the difficulty of their detection [6,7].
This single center retrospective study was performed from two radiologists with an experience over 10 years. There wasn't a conflict of interest anytime. We conducted a systematic review to identify patients with typical PI-RADS 3 lesions in the TZ.
All patients presented a previous negative transrectal ultrasound (TRUS) guided prostate biopsy and were sent by urologists after performing PSA blood test and negative transrectal examination. Median age of all patient was 65 and the median PSA level was 8 ng/ml. Exclusion criteria of our study were patients with active surveillance biopsies, a bad compliance with consecutive motion artifacts and patients with first biopsies. All 24 patients showed an increase of their PSA-levels and our urologists sent these patients for MRI examination.
We retrospectively found 24 patients with clear radiological diagnosed PI-RADS 3 lesions in the TZ. MRI examinations were performed all on the same MRI scanner manufactured by Philips at a field strength of 1.5 Tesla using a standardized MRI protocol that included T2-weighted imaging in axial, sagittal and coronal axis (TR: 3000-4761,01; TE: 120; slice thickness: 3-3.5 mm; Percent Phase Field of View of 100; Acquisition Matrix: 216 × 175), an axial T1- weighted imaging (TR: 427,59; TE: 10; slice thickness: 5 mm; Percent Phase Field of View of 90.48; Acquisition Matrix: 300 × 293), axial DWI sequences (single-shot spin-echo EPI sequences with b-values from 0-2.000 s/mm2; TR: 3000 ms; TE: 94.62 ms; slice thickness: 3.5 mm; Percent Phase Field of View of 88.89; Acquisition Matrix: 68 × 67) and a axial DCE-MRI sequences (TR: 3.89; TE: 1.82; slice thickness: 4 mm; Percent Phase Field of View of 90.29; Acquisition Matrix: 176 × 174l, 30-40 phases) after a bolus of Gd- DTPA (Gadovist, Bayer AG) at a constant dose of 0.1 mmol/kg and a rate of 2 ml/s for all patients. After the exam all sequences were sent to the Med Station (Extended MR Workstation (EWS). To evaluate a specific curve type (0 = non-diagnostic curve, 1 = curve type 1, 2 = curve type 2 and 3 = curve type 3), we positioned an oval ROI over every suspected T2 lesion in the TZ with signs of DWI-restriction signs.
TTPB (trans perineal template prostate biopsy) was performed in a gynecologic position. After antibiotic prophylaxis and calculating the prostatic volume, an 18-gauge biopsy needle was directed through the template grid to obtain biopsies under direct ultrasound guidance. Our urologists in collaboration with two resident radiologists targeted cores from PI-RADS 3-MRI visible lesions, using MRI-ultrasound fusion software. Reviewing all T2 and DWI 1000b images on MRI, urologists decided to take about 3-6 cores.
Data was analyzed using R-Studio version 3.3.2. P values < 0.05 were considered statistically significant (Figure 1 and Figure 2).
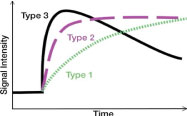 Figure 1: Curve types. View Figure 1
Figure 2: The orange numbers represent the different histopathologic results and the blue numbers the different curve types. View Figure 2
All 24 patients with confirmed radiological PI-RADS 3 lesions in the prostatic transition zone are presented in Table 1. We correlated the histopathological results with specific numbers (Table 2), to calculate the Pearson's product-moment correlation between curve types and histopathological results with a value of R correlation of -0.0787, and a p-value of 0.7148 (Table 3). Although technically a negative correlation, the relationship between our variables was only weak (the nearer the value is to zero, the weaker the relationship). In our retrospective study the size of the suspected T2 lesions in the TZ wasn't considered. We found 9 patients with curve type 0 (37.5%), 4 patients with curve type 1 (16.6%), 10 patients with curve type 2 (41.6%) and 2 patients with curve type 3 (8.3%). Forms of chronic prostatitis were the most histological result (18 patients - 75%). Clinically significant adenocarcinoma was found in only 4 patients (16.6%).
Table 1: Location, curve types and histopathological result. View Table 1
Table 2: Correlation between curve types and histopathological result. View Table 2
Table 2: Result details and calculation. View Table 3
Prostatic lesions located in the transition zone are detected first with T2w sequences, the dominant sequences in PI-RADS v2 [8]. Signal intensity in a lesion should be visually compared to the average signal of "normal" transition zone. PI-RADS 3 lesions are characterized as heterogeneous signal intensity with obscured margins (and include characteristics that do not qualify as PI-RADS 2, 4, or 5), together with focal mildly to moderately hypointense on ADC, and isointense to mildly hyperintense on high b-value DWI. The interpretation of the transition zone is considered to provide a greater challenge than the peripheral zone. While a normal peripheral zone is brightly hyperintense on T2w images, and therefore hypointense abnormalities can be easily identified, the transition zone shows heterogeneous signal intensities related to the presence of nodules of benign prostatic hyperplasia, and therefore the identification of suspicious abnormalities can be more difficult [9]. In our opinion radiologist tend sometimes to overestimate prostatic suspected lesions in the TZ, so a second opinion from another radiologist is indicated. We also reviewed the sizes of each T2-lesion in the TZ which we characterized as PI-RADS 3 lesions. The 4 lesions that resulted as prostatic carcinoma had a maximal axial diameter of 5 mm, 8 mm, 9 mm and 8 mm, considering, that our study has several limitations, like the small number, the single center study and the lack of interobserver reliability.
To understand the contrast distribution in pathologic TZ tissue, we must analyze the microscopic architecture. A study from 2012 revealed that the microvasculature of transition zone tumor showed increased heterogeneity compared to benign prostatic hyperplasia and peripheral zone tumors, possibly explaining the difficulty of TZ tumor detection on DCEP‐ MRI. Comparing TZ tumor to normal TZ, a tendency towards an increase in the extend of the vascularity was observed in TZ tumors [10]. There is a similar study from 2015 [1], analyzing the perfusion curve types from prostatic adenocarcinomas, but in the peripheric zone. To understand the micro-perfusion of chronic prostatitis in the TZ we must analyze the "prostatic microcosmos". The key histologic features of prostate carcinoma pertinent to MR imaging are increased cellular density, decreased luminal volume reduced extracellular space, and neoangiogenesis [11]. A study from 2010 showed the histologic mimickers of prostatic adenocarcinoma, like atrophy, crowded benign glands, adenosis (atypical adenomatous hyperplasia), and basal cell hyperplasia, depending on the study and type of tissue sample. In a review of 535 consecutive needle biopsies, 7 (1.3%) were classified as false positives. These 7 cases comprised 5 cases of adenosis (atypical adenomatous hyperplasia) and 2 cases of atrophy. A second investigation on needle core biopsy tissue found partial atrophy and crowded benign glands to be the most frequent benign mimickers of prostatic carcinoma [12]. In prostatitis, a frequent finding in our study, an increased vessel leakiness can mimic a curve type 3 with rapid contrast extravasation and slowly "wash out". The problematic of prostatic tissue characterization, in particular of the TZ, is the post biopsy microarchitecture transformation of prostatic tissue, although a study from 2017 concluded that a biopsy-induced hemorrhage in the prostate gland is not absorbed sufficiently over time and the extent of hemorrhage and the short interval between biopsy and MRI may not impair tumor detection or staging on multiparametric MRI [13]. In our opinion another fact to consider is the post-biopsy focal fibrosis formation in the TZ, a factor that can cause alteration of prostatic perfusion and of the curve types. In conclusion, we suggest, that radiologists should overthink contrast administration in non-suspected PI-RADS 4 or 5 lesions after visualizing T2 and diffusion weighted images.
Another diagnostic method is the use of PET with PSMA. Is is generally reserved for patients with histological diagnosis of prostate cancer at high risk (PSA > 20, clinical stage > T2 and Gleason score ≥ 8) and at very high risk (PSA > 20, clinical stage ≤ T3b, > withdrawals with Gleason score ≥ 8, Gleason score 9-10) during staging of patients with prostate cancer. Specifically, the goal of PET with PSMA is to identify oligometastatic patients susceptible to radical treatment: to evaluate the possible dissemination of the neoplasm to the pelvic and/or retroperitoneal lymph nodes to improve the therapeutic program with extension of the lymphadenectomy during radical prostatectomy or extension of radiation fields during radiotherapy treatment. Likewise, PET with PSMA allows early and more precise identification with respect to conventional imaging (abdomen CT and bone scan) of the possible polymetastatic dissemination in which primitive treatment of the neoplasm would not guarantee oncological radicality, in order to modify the therapeutic program towards systemic therapies. Furthermore, PET with PSMA is used in restoring prostatic neoplasia as it allows early identification (with lower PSA values) and with greater precision the presence of a clinically evaluable recurrence both local and systemic (lymph node, bone or visceral) in patients already subjected to primitive treatment (surgical or radiotherapy) in order to be able to treat the recurrence site in a more selective and curative way. Finally, PET with PSMA is used to monitor the response or progression of patients with advanced prostate cancer treated with systemic therapies (hormonal and/or chemotherapeutic) as it allows a more precise definition of systemic staging performed with a single exam that allows evaluation all body districts with respect to conventional imaging (CT, MRI and bone scan).