Diffusion-weighted imaging (DWI) is an MRI technique that has shown to be a very promising in facilitating the differentiation of subtle pathological changes within different tissue. However, to date, a conclusive physical basis for the signal contrast on DWI of the Achilles tendon (AT) is yet to be available in literature. The purpose of this work is to evaluate the diagnostic impact of echo planar DWI in distinguishing normal and abnormal AT using ADC mapping as a qualitative and quantitative assessment tool.
Initial scanning was done to enable DWI sequence optimization for application on the AT. This was then tested on 19 healthy volunteer which were scanned using the optimized DWI sequence. An expert musculoskeletal radiologist reviewed and scored the resultant MR images. OSIRIX software was used to generate ADC maps and values for the healthy 19 ATs to generate a threshold ADC for the symptomatic phase.
Symptomatic patient scanning phase involved the scanning of 28 patients referred for AT MR scanning. For each subject the left and right AT (n = 74) was scanned. Symptomatic patients were scanned at initial symptom onset, after 4 to 8 weeks and 16 weeks using routine and DW-Echo Planner Imaging (EPI) sequences. Expert radiologists qualitatively assessed the images, and ADC values were evaluated at different diffusion weightings (b-values = 0, 40, 273, 800 s/mm2). ROI coordinates (10 pixels) were determined using OsiriX software. Statistical analysis was then performed using SPSS and MAGIC software.
In the initial phase, DWI's scored a visibility rate of 79% (diagnostically acceptable). The normal AT displayed low signal intensity in ADC maps (mean 0.091 × 10⁻³ mm2/s and 95% CI: 65.92% to 83.99%).
Symptomatic patient's findings correlated with routine MR images. High signal changes were found in complete and partial tears, and low signal changes were dominant in healthy and inflamed (e.g. thickened) ATs. Quantitative DW-EPI demonstrated differences between AT pathologies, the ADC values measured were highest in complete and partial tears (mean 1.52 × 10⁻³, SD 0.4646). Inflammation and healthy ATs returned mixed values characterised by lower ADC measurements. Repeated ADC measurements of patients at imaging time intervals identified changes in ADC values as healing progressed.
DW-EPI sequence acquired at 3T generated a number of artefacts due to differences in the fat-to-water ratio, which could the efficacy of magnetic field shimming. Despite this, visibility of the AT and other ankle joint anatomy in the DW-EPIs were not compromised. DW-EPI differentiated AT related pathologies and indicated the severity of specific pathological changes over time.
Disorders of the Achilles tendon (AT) affect a wide range of age groups [1], and as a result of the increase interest in sporting activities over the past decades more and more occurrences of overuse injuries and complete to spontaneous ruptures of the AT are noticed [2]. Research has shown that acute AT ruptures occur predominantly in men between 30 and 50 years of age, in association with intermittent sports activity [3]. The aetiology of tendinopathy of the AT is known to be multi-factorial, with many cases occurring suddenly, without any preceding signs or symptoms. This has resulted in a lack of specificity in the presenting clinical features of this pathology, such that clinicians can be principally dependent on medical investigations to determine the pathology involved, and to make decisions regarding the future management of AT pathology.
While there are a number of imaging modalities appropriate for use in the evaluation of the AT, magnetic resonance imaging (MRI) has been documented to be highly accurate in identifying AT pathologies (e.g., tears, micro-tears and ankle injuries) [4,5]. In addition, MRI facilitates differentiation of tissue types for the identification distinctive anatomical features and/or functional significance [6]. Although, MRI help in avoiding needless diagnostic invasive procedures by accurately showing the size, location and characteristics of the pathology, using MRI in differential diagnosis of the AT could be complicated, as some pathologies may appear hypointense (i.e., invisible) similar to the contrast generated by normal AT [7,8]. This is an important issue in clinical practice when differential diagnosis of subtle pathological changes can make a difference in patient treatment management. Advances in MRI technology have facilitated newer sequences that can improve the quality of routine MR imaging protocols, thereby increasing diagnostic accuracy. These new techniques introduce a more complex assessment of pathology, specifically in regions of muscles, nerves, ligaments and tendons [9].
One of which is diffusion-weighted imaging (DWI) which is an MRI technique based on the thermal molecular movement of molecules within body tissues. This has been very promising technique in the differentiation of subtle pathological changes within different tissue types [10]. DWI qualitatively has been shown to have the potential to facilitate the detection of structural and biochemical changes in tissue, while the quantitative ADC measurements provide early diagnostic indicators of the presence of pathological changes and of monitoring tissue damage [11]. The practical medical value of DWI in a clinical setting has been well documented [12], diffusion as a technique is not new it is well established in brain imaging as it offers high sensitivity to acute ischemic damage in the brain, as well as strongly impacting on the management of stroke-induced brain injury [13]. Outside the brain, the application of DWI appears to be more challenging and it is only in recent years, with the emergence of advanced MR scanning systems and faster, improved sequences, has interest shifted towards using DWI in anatomical areas outside the central nervous system (CNS).
The aim in this work is to optimise a DW-EPI sequence at 3T for suitable clinical application on AT volunteer based on recommendations by research and practiced work. Furthermore, provide expert reviews that evaluate the validity of the optimised sequence for AT imaging using visual analysis and, ADC measurement techniques of normal AT. Once finalise the DWI-EPI sequence is applied on symptomatic patients for qualitative and quantitative grading correlate with routine conventional MR images.
Institutional ethical approval was attained for all clinical scanning. Initial testing was done for optimisation of a DW sequence. Once an optimised sequence was established, volunteer clinical scanning of 19 consenting healthy subjects was done: (Mean age 30-years; M:F/8:11). Inclusion criteria for the volunteer cohort included: 1) Healthy AT, with no recent or past injury to either ankle joint or AT; 2) No history of arthritis or joint disease, and 3) No safety-related contra-indications for the MRI examination. Exclusion criteria included: 1) Contra-indication with MRI (i.e. metal implant, pacemakers), 2) Abnormality or injury to the AT or surrounding tissue, 3) Previous surgery on the AT.
28 patients referred for AT MRI scanning (18 males and 10 females, median age 47.5 years) were scanned over a time period of thirteen-months. The scanning protocol (depending on the pathological changes) was applied as follows: 1) Initial MRI scans, both ankles (normal and affected AT) at time of initial symptom onset (n = 28); 2) Follow-up scan: Only the affected AT identified as having AT pathology based on the appearances of their initial MRI findings at a time period of 8 weeks for acute pathology and 4 weeks for chronic pathology (n = 12); 3) Further follow-up scan: A re-scan of patients from phase two at a time frame of 16 weeks from the initial scan (n = 6). Exclusion criteria for the clinical trial included, contraindication to MR examination (e.g., pacemaker, metal implants), history of arthritis or joint disease, and major trauma to the ankle. Inclusion criteria included, symptomatic for AT pathology (e.g. pain, swelling, tenderness) and/or, positive for AT injury upon initial clinical examination.
Scanning was undertaken on a 3Tesla Philips Achieva (40 mT/m, 200 mT/m/msec) MR scanner together with a dedicated boot-shaped eight-element SENSE foot/ankle radiofrequency (RF) coil. A sagittal STIR sequence (TR/TE/TI: 3278/60/200 msec; NEX: 2; Matrix: 160 × 160; FOV: 272 × 187; Slice/Gap: 3/0.3 mm) was prescribed from localiser images to depict the insertion and vertical long axis of the AT. Axial SE-EPI-DW test sequences were then acquired with diffusion gradients in three orthogonal directions and b-values of b = 0, 40, 273 and 800 s/mm2. The optimisation process involved the independent, sequential application of a range of MR imaging techniques to the SE-EPI-DW sequence tested, which included: 1) Frequency selective fat suppression: SPIR (Spectral Pre-saturation with Inversion Recovery), or SPAIR (Spectral Adiabatic Inversion Recovery), is tested to select which achieves more uniform fat suppression. Once chosen, a frequency offset is tested to fine-tune fat suppression the B0 field. Since the frequency offset affects the whole slice, fat suppression is optimised in the area of interest. Literature recommends that the optimal way to do this is to compare images acquired at different frequency offset values. 2) Low bandwidth: DWI normally has a low SNR especially when high b values are acquired [12]. Thus, it is necessary to recover as much signal as possible. In order to increase the SNR, a narrow bandwidth can be used which results in less noise being sampled relative to signal, producing higher SNR. 3) Diffusion-weighted whole-body imaging with background body signal suppression (DWIBS): Allows acquisition of volumetric high CNR diffusion-weighted images of the body [14]. Achilles tendons of the 19 healthy volunteers were done using the optimised SE-EPI-DW sequence incorporating b-values of 0, 40, 273, 800 s/mm2, and where evaluated according to: 1) The efficiency of fat-saturation its uniformity; 2) Detail of the AT and differentiation from surrounding anatomy, 3) Reduction of SE-EPI-DW related artefact (i.e., ghosting and distortion) [15].
MR images were acquired using a Philips 3 Tesla Achieva scanner together with an 8-element phased array boot-shaped, dedicated foot/ankle coil. MR-scanning protocol was applied for all patients and included: Routine T2W and T1W FSE and STIR, and the additional, SE-EPI-DW pulse sequence in three orthogonal directions, with b-values of b = 0, 40, 273 and 800 mm2/s Technical details regarding the sequence parameters are presented in Table 1. MR scanning protocol was based on non-contrast imaging, and as such, did not require the administration of a Gadolinium-based contrast agent. Patients were positioned supine feet first with their ankle immobilised with proper pads for 25-30 min/per ankle.
Table 1: Pulse sequence parameters for the Achilles tendon MR scanning protocol used to image all patients. View Table 1
OsiriXTM medical imaging workstation was used for display and evaluation of the MR images. A consultant musculoskeletal radiologist (> 20 years clinical experience) reviewed all images. They were rated based on the degree to which specified anatomical structures and features of the AT were visible. Visual grading analysis (VGA) of the quality of each of the volunteer image data sets was performed with specific emphasis on identifying the AT, the surrounding anatomy, the presence of any artefacts and any other image quality features. Assessment criteria included: Visibility of the boundaries of the AT, consistency of the size and shape of the AT, and visualisation of the expected hypointense signal within the normal tendon. Table 2 summarises the grading scale used for the image quality grading process.
Table 2: Image scoring system for visual grading analysis of DW MR images. View Table 2
To generate ADC maps for quantitative diffusion measurements, SE-EPI-DW images were transferred to OsiriX software. The ADC measurements were calculated using an ADC plugin added to the OsiriX software. Absolute ADC measurements were quantified using the 'Grow Region', a tool that allows for similar pixel densities to be selected (e.g., 3D or 2D, and segmenting, drawing or single point ROIs) to generate ADC values of desired ROIs, which were applied on both axial and sagittal DW images of each volunteer scanned [16] (Figure 1). According to Luna, Ribes & Soto, [17], there is a lack of consistency in the methodology of generating ADC values; thus, at this stage in the research, several techniques were applied to ensure the consistency and reproducibility of generated ADC values for evaluation of healthy ATs. Each technique specification and advantage is displayed in (Table 3). All data from the scoring and ADC quantification were transferred to the statistical package for social sciences software (SPSS Inc. Ver. 20.0) to facilitate mean, standard deviation and histogram analysis of ADC values. ANOVA testing [18], was used to investigate the statistical significance between applying these different ADC measuring techniques, and whether using axial or sagittal orientation to generate ADC values present statistical differences.
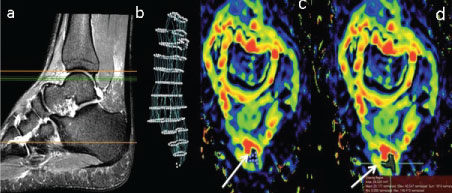 Figure 1: Use of OsiriX software for semi auto (segmentation) of the AT (a): Sagittal T2W FSE + FS image of the AT to localise the area where axial images at anatomical levels c and d are selected (green lines); (b) Segmented image of the AT after 3D selection points were placed along the long axis of the AT as displayed in the sagittal image (a). (c,d): Selection of the ROI defining the AT to generate AT ADC segmentation (white arrows). View Figure 1
Table 3: Summary of the techniques used to measure ADC values from ADC map images generated by OsiriX. View Table 3
Two expert musculoskeletal radiologists independently assessed all the images for signs of pathological changes within the AT. The image reviewers were asked to evaluate the images qualitatively, depending on MRI signal intensity hypo-intense, intermediate or hyper-intense visualised in two consecutive images (eliminate artefact), and in both imaging planes (Table 4), AT pathologies were then categorised by type and frequency. All findings (routine MR images, DW images and ADC map) were then scored by using a grading score sheet. All MR images were reviewed at a dedicated OsiriX workstation at the clinical centre dedicated for display and viewing of diagnostic images.
Table 4: AT pathology qualitative classification for DW and ADC images graded in accordance with physical performance and clinical examination scores applied, cell structure and MR signal appearance on routine images. View Table 4
ADC values were measured using a manual Region of Interest (ROI) placed on the superior, middle and inferior aspect of the tendon on two consecutive MRIs and mean ADC values were generated twice for consistency and accuracy. Statistical analysis was performed using the IBM SPSS statistical software (SPSS-Inc., version 20). Fisher's exact test p value was used to test association of routine MR image findings relative to DW and ADC findings. Quantitative ADC values using a 'Type III Test of Fixed Effectsa' table were evaluated with pathology as random, and; time (initial, 1st follow-up and 2nd follow-up scans), side (left or right AT), and type of injury (e.g., tears, tendinosis, thickening, inflammation) are the fixed effect. A value of p < 0.05 was considered to be statistically significant.
Based on findings form the intimal optimisation testing; SPIR vs. SPAIR, A medical physicist and two clinical/academic specialist MR reviewers qualitatively compared diffusion images acquired with SPIR and SPAIR techniques. It was found that, SPIR and SPAIR both suppressed fat signal; however, fat suppression was more improved with SPAIR compared to SPIR. Frequency-offsets, an offset value of 200 performed best relative to the other offset values. Low BW and DWIBS, Using either a low (narrow) receiver BW, or the DWIBS sequence generated extreme artefacts within the images. Both sequences performed poorly in producing DW images of diagnostically acceptable image quality. The appearance of artefact was noted in both images; using a narrow BW generated more severe artefacts than the DWIBS sequence; however, visualisation of anatomical regions was not acceptable in images incorporating either of these techniques. A final series of changes were applied to the DW-EPI sequence chosen to facilitate: 1) Optimal demonstration of image quality in terms of SNR, spatial resolution (SR) and contrast resolution (CR); (best seen with SPAIR), and; 2) Minimal artefact in the region of the AT; (best seen with a frequency offset value of 200). This was then used on the 19 healthy volunteers, and generated images were quantitatively analysed by the expert musculoskeletal radiologist, it was concluded that the AT outline was visualised in 80.7% and the AT size and consistency could be appreciated in 78.95%. Although the DWI scored a low 42.98% in terms of visualisation of the hypo intense interior of a healthy AT, the expert reviewer scored 79% of the DWI as diagnostically acceptable, despite the presence of some distortion and ghosting artefact (Figure 2).
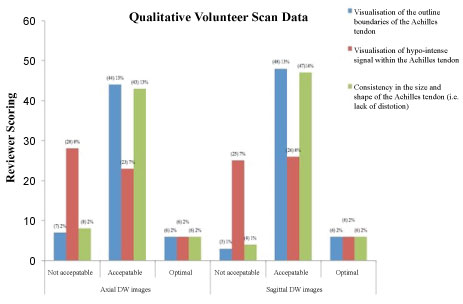 Figure 2: Summary of the quantitative VGA scoring of SE-EPI-DW ankle joint and AT images acquired from healthy volunteers. View Figure 2
Normalised ADC values calculated for the healthy AT presented a collective mean and SD of 0.091 ± 0.116 (× 10-3 mm2/s), with a 95% CI* of 65.92% to 83.99%. Furthermore, statistical analysis of data to determine the degree of consensus in terms of reproducibility of ADC values for the healthy AT, it was found that when applying different measuring techniques for generating ADC values results no significant difference in ADC values, p = 0.597. Similarly, when testing for differences in the generated ADC values depending on the orientation of ADC map, it was determined that orientation did not have a significant effect (p = 0.124). A comparison of all ADC measuring techniques indicated that the one point value method was most accurate (0.0250 × 10⁻³ mm2/s), followed by the one point segmentation method (0.0734 × 10⁻³ mm2/s), the pencil draw technique (0.0994 × 10⁻³ mm2/s), 3D segmentation method (0.1102 × 10⁻³ mm2/s) and finally, the 2D segmentation method (0.1489 × 10⁻³ mm2/s).
Qualitative findings for all AT pathologies on both routine MRI and DWI were correlated (Figure 3). DWI demonstrated a 61.7% sensitivity and 96.3% specificity (p = 0.001) for pathology detection relative to routine scan MRI findings with PPV of 96% and NPV of 59%. Similarly, ADC images were correlated and showed 90.2% sensitivity, and 85.1% specificity for detection of pathology relative to routine MR findings, with PPV of 90.2% and NPV of 69.6%, and p = 0.001. A "Type III Tests of Fixed Effectsa" of significance was applied to the ADC values and a significant difference in the ability to differentiate the type of AT pathology p 0.001 < 0.05 was noted (Table 5). However, when correlating ADC with the time point of the initial and follow-up scans, or the side of injury (left/right AT), values were not significantly different, p values were respectively p 0.802 > 0.05, p 0.334 > 0.05.
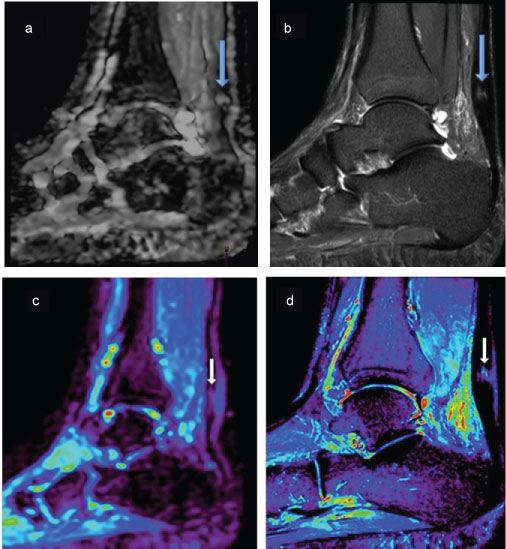 Figure 3: Figure of two different patients top and bottom, Top Images (a) Sagittal DW; (b) STIR, both images are of the same pathology (big arrows) partial tear of the AT, the images display qualitative approach to pathological findings. Bottom images; (c) ADC map; (d) STIR images, these are of the same patient (small arrows) showing a micro tear of the Achilles tendon the ADC maps were used for Qualitative values of the pathology using the ROI method, once corelated with STIR images. View Figure 3
Table 5: Summary of generated ADC values correlated with AT pathology visualised by routine FSE and STIR MR images. View Table 5
The use of routine conventional MR imaging based on FSE and STIR images for the evaluation of Achilles tendon pathology, has been considered as the gold standard in clinical practice [19]. According to Kahn, et al., [20], when testing for Achilles tendinopathy MRI demonstrated sensitivity of 95%, specificity of 50%, positive predictive value of 56% and negative predictive value of 94%. MR imaging continues to expand to play an important role in verifying tendon structure with the aim of improving clinical decision-making. An example of such is an expansion in the application of MRI techniques such as DWI and associated ADC mapping. These techniques represent new applications relative to musculoskeletal imaging, while the majority of DWI studies performed clinically to date have focused on the measurement of extra-cellular water mostly in the brain, principally applied to evaluate pathologies of the central nervous system (CNS). DWI has expanded more into the evaluation of body tissues outside the CNS [12,17]. Though, Limited literature focuses on findings of AT pathology using DWI imaging, and to date evidence does not support or negate applying DWI to detect AT pathology. Similar studies of musculoskeletal DW body imaging, specifically on the knee have indicated that using DWI for musculoskeletal intracellular diagnosis is controversial. While, Mason, et al., [21] reported a sensitivity of 100% and specificity of 86% in detecting meniscal tears of the knee. Khoo, et al., [10] found that at present DWI appears only to add slightly to the overall diagnostic yield of conventional pulse sequences. In this work, the focus was to investigate DWI and ADC mapping for detecting and characterising AT pathology. Qualitative evaluations showed DWI showed a higher specificity (96.3%), and lower sensitivity (61.7%) in detecting AT pathology, in comparison to ADC, where sensitivity (90.2%) was higher than specificity (85.1%). This indicates that DWI has the potential to rule out AT pathology, and confirm the presence of a normal, healthy AT, whereas, measured ADC values have a higher ability for detecting pathology. Usually, DWI is combined with ADC maps to produce higher accuracy for detecting pathology. When both DWI and ADC are combined the specificity showed 100%, indicating that DWI and ADC correlated well for negative data when the AT was healthy (i.e. with no abnormal signal intensity changes).
This work also provided a novel quantitative approach to report on ADC values of different AT pathologies correlated to various indices (e.g., time, side, type). Quantitative analysis of ADC maps correlated with type, side and time of injury indicated that ADC values were statistically significant when differentiating type of AT pathology; ADC values showed that an increased ADC is evident in patients presenting with complete, partial and, micro tears within the AT (1.68 × 10⁻³, 1.546 × 10⁻³ and 1.224 × 10⁻³) compared to inflammation, thickness or tendinopathy of the AT (0.151 × 10⁻³, 0.343 × 10⁻³ and 0.174 × 10⁻³). Also, it was seen that when the tendon has multiple pathologies ADC is higher; for example, complete and partial tears have a greater effect on the measured ADC values (thickening + tear: 1.88 × 10⁻³) compared to a combination of lower grade pathologies (tendinopathy + thickening: 0.351 × 10⁻³), this may be attributed to the increased diffusion of water molecules associated with high-grade pathology compared to lower grade pathology [22]. No significance was found in relation to side (right or left), or the time at which patients were scanned following the initial occurrence of their AT pathology, these findings were attributed to the decline in the number of patients thought out the follows up, and the inconsistencies in the degree to which certain pathologies healed and/or progressed over time.
ADC values can help suggest an approach into Artificial intelligence planning, knowing specific values and thresholds for subtle and changes in pathology can provide AI for faster diagnosis. And this technique could be further related to other MSK regions.
Steady-state Free Precession (SSFP) techniques have also been used for diffusion-weighted MR imaging of the musculoskeletal system, with reported adequate image quality, signal-to-noise ratio and relatively short acquisition times [23] (Figure 3). Few studies have reported on the potential application of DW-SSFP for imaging of the AT. However, this was not included in this study because of T2-contamination and other confounding relaxation effects, and DW is difficult to quantify in SSFP and in this study, ADC values of the AT are a focus for further clinical trials on AT-related pathology [23] (Figure 4).
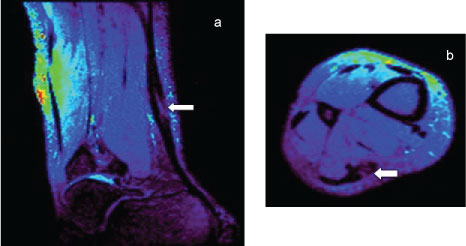 Figure 4: Sagittal (a) Axial; (b) Images of abnormal AT using a DW sequence based on SSFP technique. Both images demonstrate high image resolution regarding differentiating AT hypointense signal relative surrounding anatomy, with an increase in signal shown where a abnormally (tear) within the tendon (arrow). View Figure 4
In clinical practice, DW sequences can be modified and applied in a number of ways to optimise resultant image quality in terms of signal-to-noise ratio, and facilitate scanning efficiency by minimising scan time [24]. These advantages can in turn facilitate a reduction in image artefacts and/or increased spatial resolution. DWI outside the brain remains in the preliminary stages of technical optimisation because the range due to MR scanner's functional options and there influences on SNR and image quality [25]. As a result, there is debate regarding the most appropriate choice of parameters including b-values and factors affecting SNR and spatial resolution for DW imaging of anatomy outside the brain [26]. This potential for variability highlights the importance of understanding the balance between MR scanner characteristics and DW pulse sequence parameter settings when undertaking DW musculoskeletal MRI.
For example, the choice for conventional spin-echo sequence sensitised for DWI for imaging of the ankle correlated with prior research outlining its success for diffusion measurements in body imaging [11,27]. According to Trattnig, et al., [28], SE-DW sequences are considered the gold standard for clinical applications; however, using a spin-echo sequence is associated with the limitation of long acquisition time, with the subsequent increased sensitivity to motion artefacts. To compensate and produce faster imaging sequences, echo planar imaging (EPI) is most commonly used, and its applications have been documented in the literature for diffusion measurements of the brain [28,29] and body [30-32]. EPI suffers from two major sources of artefacts: N/2 or Nyquist ghosts and geometric distortion. Ghosting artefact, when present, degrades image quality and SNR, while geometric distortion makes it difficult to co-register EPI images with conventionally acquired anatomical MR images [33,34]. Literature suggests that parallel imaging or spectral suppression (SPAIR, SPIR) techniques could be applied to reduce the effect of EPI on image quality [10,15,33,35]. Parallel imaging was used in conjunction, with both SPAIR and SPIR to reduce EPI-related artefact, however it was no completely eliminated.
There have been few studies evaluating diffusion-weighted MR imaging of ligaments, cartilage or musculoskeletal tissues with a similar collagen fibre based structure [22,24]. Body DWI offers good sensitivity to detect cellular-dense lesions and has several applications in oncological imaging [10]. Published literature regarding the applications of DWI has yet to address a broad range of examinations within the human body, specifically regarding the tissues comprising the musculoskeletal system, i.e., nerves, muscles and tendons [35]. There are several techniques can be used to obtain DWI, differences in the imaging sequences employed makes it difficult to compare findings with existing reported literature. Several studies involving the application of DWI of the musculoskeletal system at different b-value have shown that in addition to confirming provisional clinical diagnoses, the technique is promising in facilitating differentiation between specific pathology and subtle changes [36,37]. This additional information has the potential to improve patient management by taking into consideration the effect of subtle injuries.
While the volunteer population size was small (n = 19), the volunteer cohort size matched those reported in similar studies [38,39]. In addition, validation of the role of DWI in depicting and evaluating the AT is difficult due to a paucity of literature addressing DWI of musculoskeletal structures, particularly tendons. Manually generated ADC values might cause some intra- and inter-rater discrepancies between the participating subjects. However, in this study all rating was done by trained professionals to reduce potential for inter-rater variability. Also, the lack of data relating to musculoskeletal DWI and ADC values in published literature, in relation to pulse sequence and selected b-values made it difficult to correlate the results of this study with those of others published. It was challenging to generate stronger association between ADC values and pathology due the cohort of patients scanned and the potential for variation in pathology and further research is recommended to involve larger patient numbers.
This work produces a preliminary novel approach into quantifying information of normal and abnormal AT and evidences the future potential of non-invasive imaging techniques particularly for the characterization and differentiation of intracellular AT pathology. The findings evidence the potential benefit of DWI and ADC map images within routine clinical MR imaging practice through the significant contribution in detecting AT pathology in this research. Further prospective studies involving larger numbers of patients to improve on DWI and ADC contribution in detecting and characterizing AT pathology are recommended to strengthen the evidence as to whether or not DWI and derived ADC values could replace some of the more routine pulse sequences involving the imaging of tendons, ligaments, muscle of the musculoskeletal system.
This study was undertaken as part of PhD research at University College Dublin, Ireland. The PhD study was funded through a scholarship program sponsored by the Kuwait Government (Ministry of Health). 1 Permanent address: Kuwait, Kuwait City, al-Qurain, Block 3, Street 36, House 14, Tel: 0096599195122.