With the rise of the COVID-19 pandemic, several changes occurred in the lifestyle and habits of human life. These include various voluntary and mandatory governmental restrictions, limiting social interaction by encompassing social distancing, travel limitations, social gatherings, personal mobility, as well as closures and reduced capacities in sectors such as retail, restaurants, and the entertainment industry. The purpose of the restrictions ideally intended to reduce the transmission rate of COVID-19 by limiting the overall movement of individuals, thus preventing the spread of the virus. As a result, this study seeks to identify whether regulatory restrictions posed an overall significant impact on mobility in the United States by conducting multiple linear regression analysis studies on predicting average statewide mobility (in kilometers) based on the factors of daily cases, daily deaths, and imposed governmental restrictions. By identifying the significant changes in mobility across the continental United States, a baseline can be established in order to evaluate upon the efficacy of government-imposed restrictions and extend to further implementation of policies to minimize mobility and disease spread simultaneously. Additionally, with increasing concerns about a second wave or outbreak of COVID-19, this study will seek to establish inferences to re-evaluate and improve upon the existing regulations, control measures, and disease mitigation techniques used to combat the spread of COVID-19 and the potential for any other similar diseases or epidemics in the future.
COVID-19, Coronavirus, Linear regression model, Mobility Index
The COVID-19 disease (Coronavirus 2019) is caused by and attributable to the virus known as Severe Acute Respiratory Syndrome Coronavirus 2 (SARS-CoV-2). The first instance of the disease introduced itself in late December 2019 in the Hubei province of China and ever since has drastically proliferated to reach a pandemic status accruing over 10 million cases and 500,000 deaths globally as of present-day. The United States alone accounts for over 2.5 million of those cases and over 125,000 deaths [1]. While the origins of COVID-19 are unknown, it is presumed to have ties with the form of a human to animal (zoonotic) interaction; possibly identified as chiropteran origin [2]. COVID-19 continues to pose a severe public health catastrophe with far more significant consequences, like the ability to damage and halt economic growth permanently. Juxtaposed with a second wave or outbreak on the near horizon, the motive of this study was to use publicly available and anonymous cell phone GPS data as a direct measure of human mobility for the period of March 10, 2020, to May 28, 2020, to form a basis on evaluating the governmental restrictions that took place in the United States in mid to late March 2020. The scope of this study was narrowed down to the five most populous states (California, Florida, New York, Pennsylvania, and Texas) as we believe these states would comprise the majority influence in decision making and changes in future regulations for imposed restrictions for individual states as well on the national scale.
Unlike defined physical processes, the evaluation of human psychological behavior in this context spanning human responses to imposed government mandates is challenging to analyze due to a lack of a quantifiable metric. For this reason, it was hypothesized that the ideal metric to investigate in terms of evaluating the overall response of such restrictions would be in the form of a distance measure or Mobility Index as defined in the context of this study. The mobility data originates from the anonymous and commercial collection of cellular GPS data and is publicly available from Descartes Labs. As a result of GPS data collection, several metrics or mobility measures can be defined such as the maximum mobility from the initial location of an individual for a given day (Mmax), bounding mobility (Mbb) and the convex hull (Mch) all in terms of distance traveled [3]. To investigate the validity of imposed restrictions, the decided metric of interest to represent as the Mobility Index was the maximum distance traveled on a given day (Mmax), as the fundamental notion behind any COVID-19 related restriction is to minimize the distance people typically travel. Due to anonymity restrictions of personal data, the direct data values of maximum distance are not accessible; thus, the median of the maximum distance produced over a random set of individuals that reside in the same county is used instead; hence for the capital M in the naming convention of all mobility-related metrics. Using the median values for mobility will also provide a more accurate depiction of the actual values as compensation for abnormalities taking place in errors that can manifest as GPS malfunctioning, GPS inconsistencies, and the accidental capture of abnormally high or low traveling distances in individuals (Figure 1).
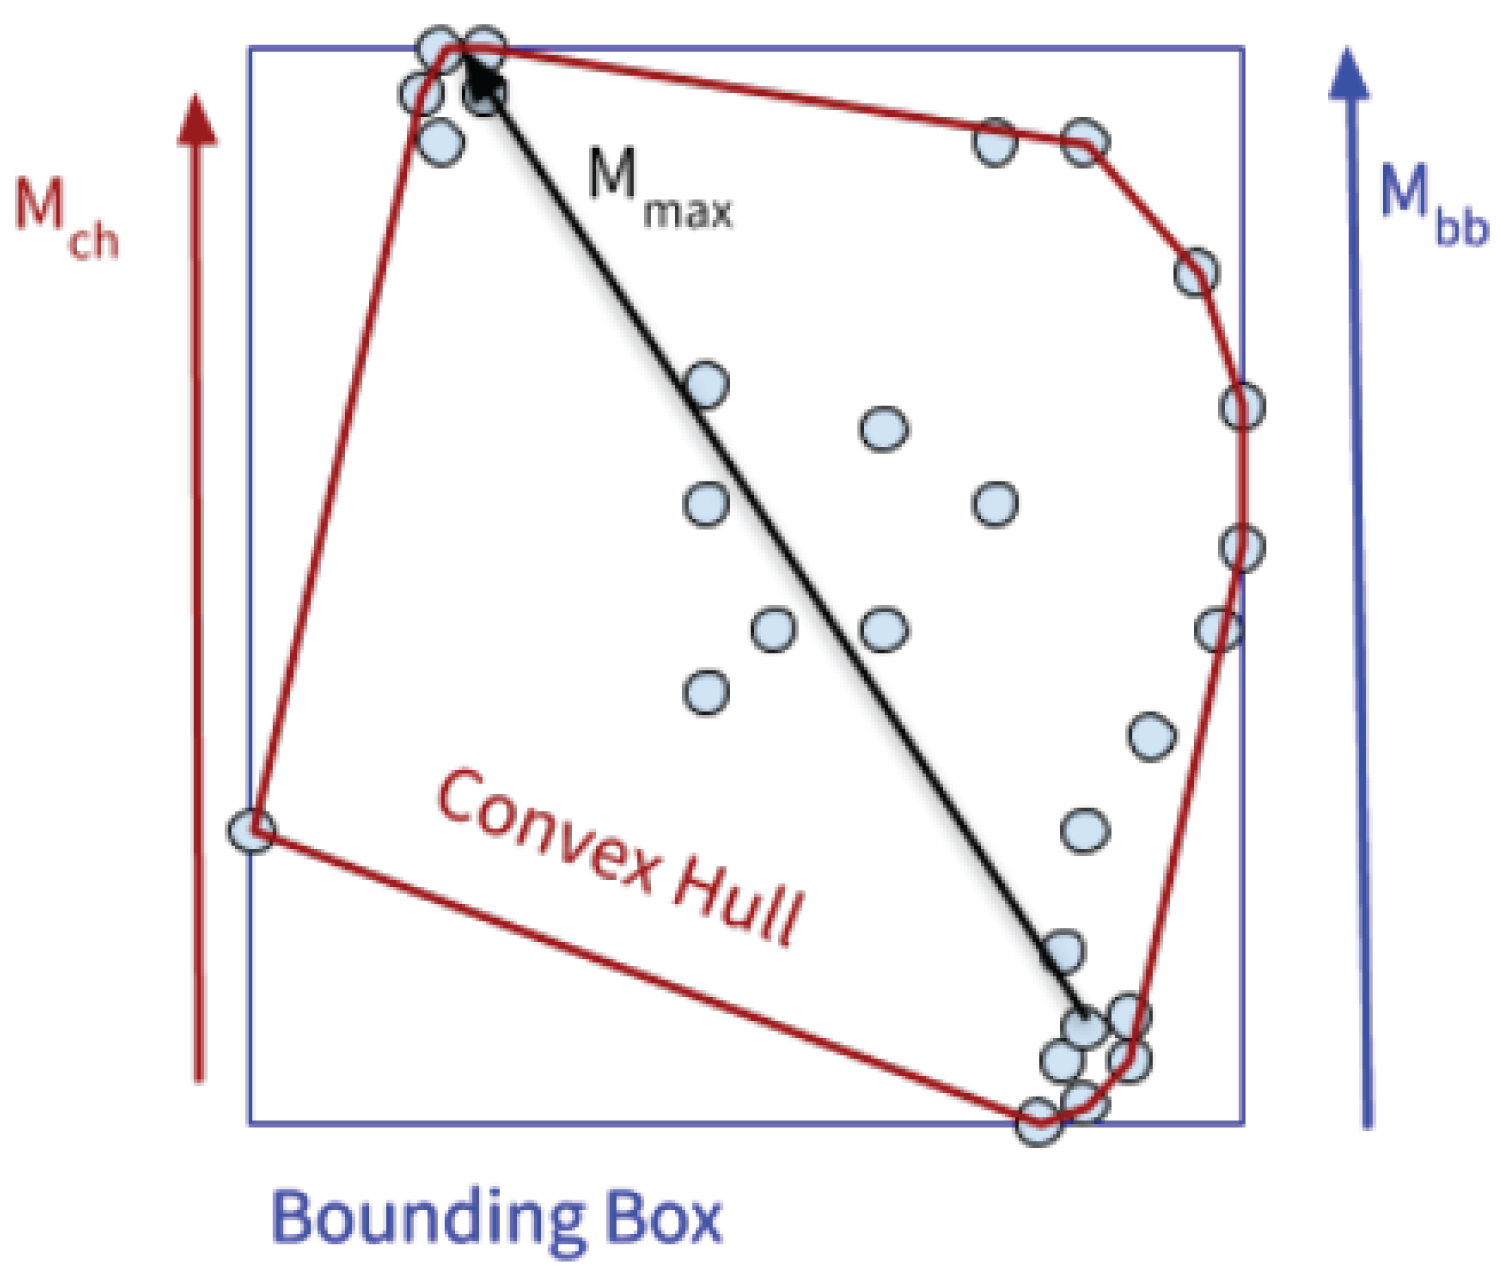 Figure 1: Visualization of anonymous mobility metrics obtained from GPS data and Mobility Index illustrated as Mmax as from Figure 1 of Warren M, et al. [3].
View Figure 1
Figure 1: Visualization of anonymous mobility metrics obtained from GPS data and Mobility Index illustrated as Mmax as from Figure 1 of Warren M, et al. [3].
View Figure 1
To the best of our knowledge, the published literature on the fitting of Mobility data for COVID-19 is not available yet. The objective of this paper is to fit several regression models on mobility index of the five states and investigate the effect of Government restriction on mobility index during the COVID-19 pandemic. In addition, we have developed a combined regression model using data of the top five populous states.
The organization of this paper is as follows: The data sources, data descriptions, data cleaning and processing are given in section 2. The statistical models and data analysis are provided in section 3. Finally, some concluding remarks are added in section 4.
The primary source of data used in this experiment to collect mobility information was made publicly available by Descartes Labs, a founded company from researchers and scientists from Los Alamos National Laboratory, and focuses on large-scale computing, artificial intelligence, and satellite imagery and create solutions targeting Data Modeling and Analytics [4]. The hosting and online access of the data utilized www.data.world, a Public Benefit Corporation that provides a cloud-native solution for hosting publicly available and open-source data repositories along with API and software integration for tools such as Python, R, SQL, and Excel. To visit and explore the direct data source, navigate to https://github.com/descarteslabs/DL-COVID-19, and for more information on Descartes Labs, please visit https://www.descarteslabs.com/company/#about. Additional secondary data sources were used to compile detailed information relating to the statewide data of daily confirmed cases and deaths. These secondary data sources originated from the Johns Hopkins University Center for Systems Science and Engineering (JHU CSSE) [1], Worldometer [5], and lastly from the Institute of Health Metrics and Evaluation (IHME) [6] and were respectively combined into further columns of Cases and Deaths for each date in the time period between March 10, 2020, and May 28, 2020.
The overall process of extracting the primary data (State, Date, and Mobility) involved utilizing SQL queries to filter out the Descartes Labs data set in groupings for the individual states of California, Florida, New York, Pennsylvania, and Texas. Additionally, another partition was applied on the date in the form of a range in order to maintain consistent statewide data from March 10, 2020, to May 28, 2020. Once completed and initially filtered under the above two constraints, an API call was created from www.data.world to be read and manipulated further via the Python programming language (Python 3.8.1). Likewise, a Python script was created to preprocess the dataset by managing and organizing the filtered data into data frames, which will be combined with the data from the secondary sources and represented as the remaining variables (Daily Cases and Daily Deaths). Additionally, to construct a variable for the effect or contribution of government-imposed restrictions, a logical comparison was implemented to make a binary coded variable that would take assigned values of 0 (No Restriction present) or 1 (Restriction present) based upon the respected date values from the data found in the Tracking Involuntary Government Restrictions (TIGR) Dataset [7]. The Cases and Deaths data were compiled from JHU CSSE [1], Worldometer [5], and IHME [6] and integrated into the same Python script, adding on to the initial data frame. At this point, the dataset for analysis is completed and requires transformation for analysis and migration to R. As a result, a random subset of the data was taken for each of the individual states (20%) via Python's random sample() function and flattened as averages to yield distinctive data records for each date in the range as depicted below in Figure 2. Finally, a conversion of the data's format (DataFrame to CSV) took place, which enabled the migration directly to RStudio (Version 3.6.3) for performing statistical modeling and analysis. A variety of packages were utilized in RStudio namely broom [8] for summarizing the model results, ggplot2 [9] as a graphical visualization tool, readr [10] to process the CSV data file, dpylr [11] for data manipulation, lindia [12] for creating regression diagnostic plots along with verifying linear model assumptions, and knitr [13] for printing and exporting the results of our analyses. A sample of the finalized data after the preprocessing and manipulation stage is depicted in below in Table 1.
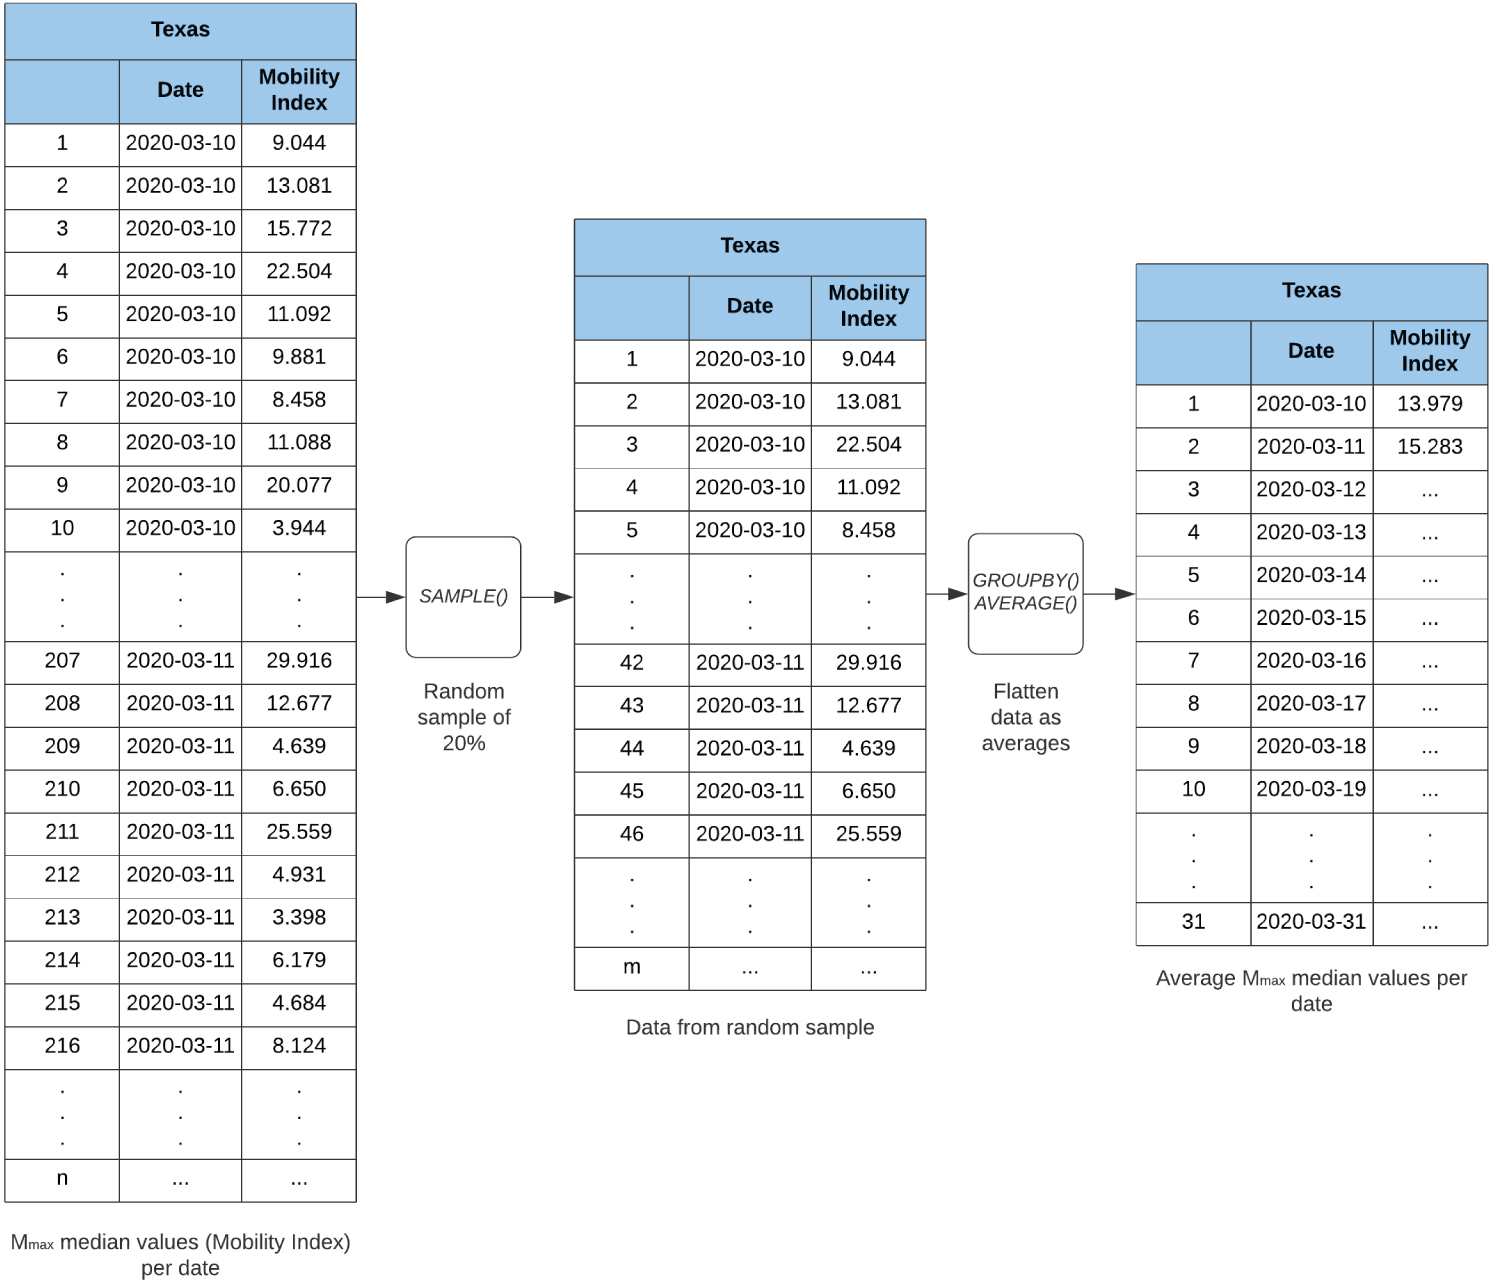 Figure 2: Final stage of data preprocessing before appending external data.
View Figure 2
Figure 2: Final stage of data preprocessing before appending external data.
View Figure 2
Table 1: Example of final data (random 5% subset from 395 records total) with appended external data after preprocessing and manipulation stages. View Table 1
The above Figure 2 and Figure 3 serve as an example of the data processing stages for an individual state for graphical purposes. It is important to note that this process is repeated for each of the states (California, Florida, New York, Pennsylvania, and Texas). Once the data processing stage was completed, external data of Cases, Deaths, and Restriction were appended to the data for final use. An example of the finalized data is shown below in Table 1.
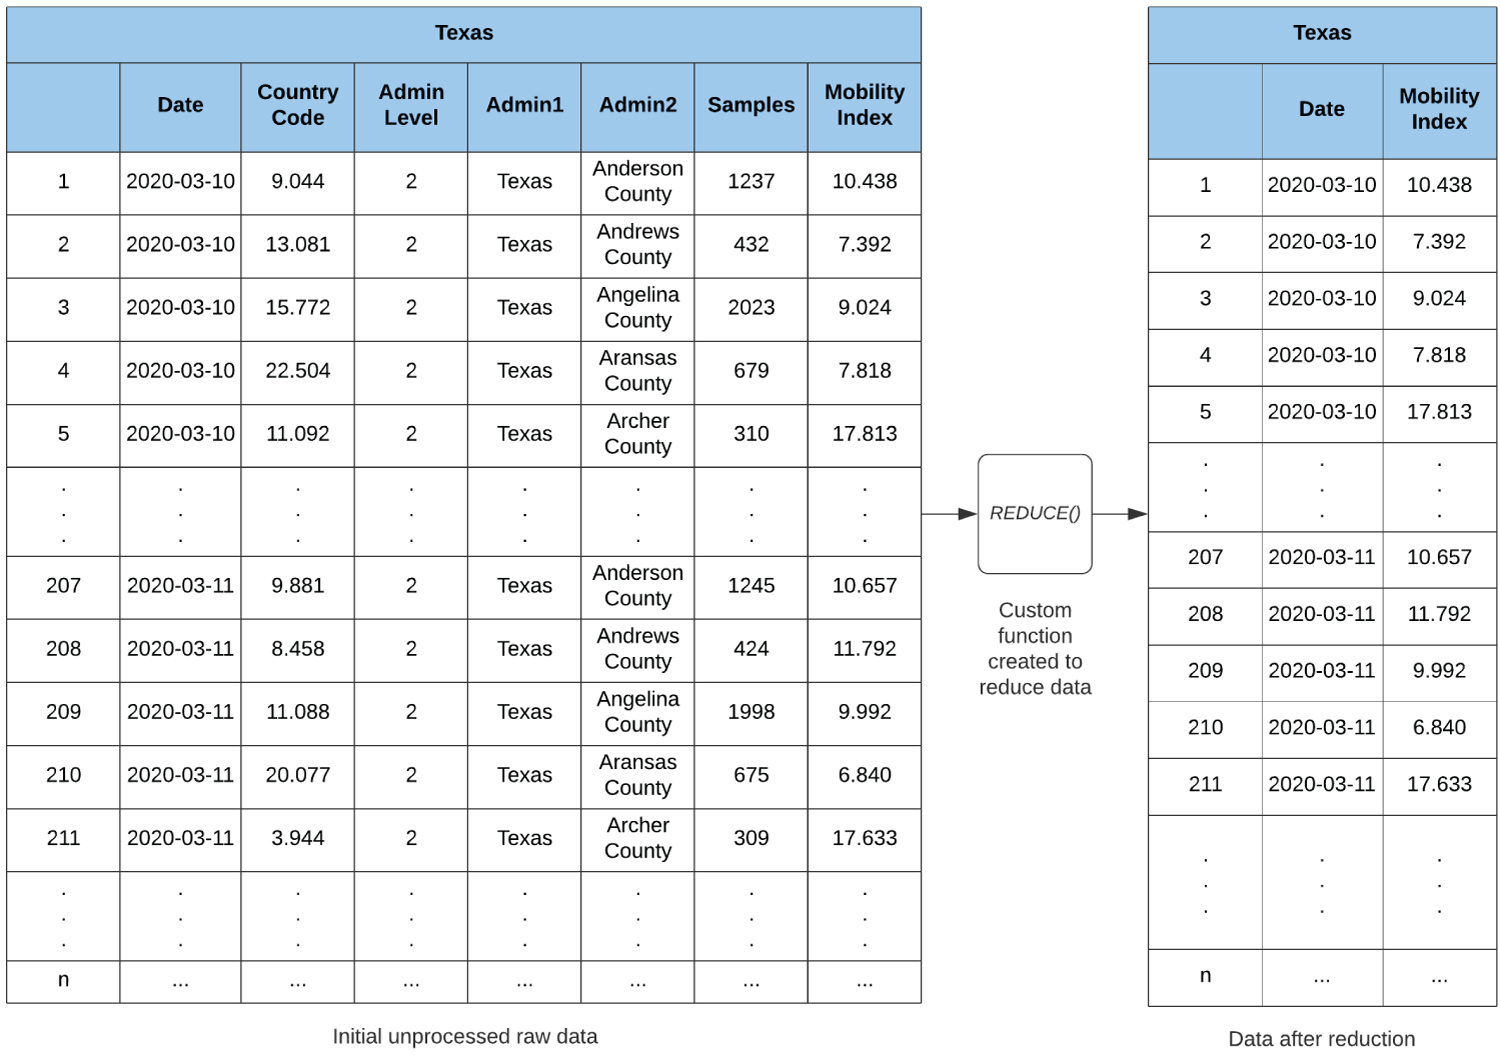 Figure 3: Initial data format and manipulation process leading to the reduced dataset.
View Figure 3
Figure 3: Initial data format and manipulation process leading to the reduced dataset.
View Figure 3
To analyze the data, we consider the following multiple linear regression models:
where Y = Mobility Index, X1 = Restriction, X2 = Cases and X3 = Deaths. We assume that has a normal distribution with zero mean and unit variance. We also assume that the regressors, and are independent. The five implemented models for the five individual states follow equation 3.1.
Before proceeding in performing analysis on any of the models, baseline evaluations were conducted on each of the models and included Shapiro-Wilk normality tests, calculations of Variance Inflation Factors, as well as exploratory plots of Standardized residuals to investigate the validity of the normality assumptions and verify multicollinearity was not present in the model itself. Based on these results, each state model, except for Florida, underwent a square root transformation in the dependent variable (Mobility Index) to satisfy the Shapiro-Wilk normality test or removal of an insignificant regressor(s). A recurring theme displayed that the Deaths regressor proved statistically insignificant in several of the models (under α = 0.05), and hence, was removed from the model where necessary. As a result, all model descriptions in the following sections will refer to the revised versions of the regression models.
In the final fitted multiple linear regression models of California, New York, and Texas the associated regressors of Restriction and Cases show statistical significance at α = 0.05. It is important to note that the adjusted R-squared values (0.42, 0.59, 0.34) demonstrate a weak, moderate, and weak fit respectively. For the remaining final fitted multiple linear regression models of Florida and Pennsylvania, all the associated regressors of Restriction, Cases, and Deaths show statistical significance at α = 0.05. Similarly, it is important to note that the adjusted R-squared value (0.48, 0.35) demonstrate a moderate and weak fit respectively for the models.
An important observation from the results as seen in Table 2 are the consistent negative coefficient values for the Restriction variable across all individual state models which serves as an indicator that a negative linear relationship exists between the factors of Mobility Index and governmental restrictions. This finding supports and extends on the primary basis that government restrictions play a critical role in reducing the typical mobility of individuals.
Table 2: Final individual state linear models (summary output). View Table 2
In this section, we will investigate a combined model using the State as a categorical variable. The regression analyses for all states are presented in Table 3. It is observed that the associated regressors of restriction, cases and in part components of the categorical state factor (Florida and Texas) show statistical significance at α = 0.05. It is important to note that the adjusted R-squared value (0.69) demonstrates a moderate fit for the model. Additionally, government restriction proves to be a significant factor for Mobility Index in both the individual state models and combined model.
Table 3: Final combined state linear model (summary output). View Table 3
The importance of the imposed government restriction factor may possibly benefit and stem from the inclusion of two main effects: The direct restrictions on personal mobility and the restrictions in place on social distancing. The CDC recommends social distancing to control COVID-19 spread and government restrictions are one of the most influential factors in controlling the implementation of social distancing standards which in effect explains the limited mobility of individuals. The performance of the categorical state factors can be partly explained as Texas and Florida have an overall higher mobility compared to the other three states of California, New York, and Pennsylvania. Both Texas and Florida have shown cases spiking only recently, while New York and Pennsylvania had a significantly higher number of cases from the very beginning. On the other hand, California has many IT companies and Hollywood film industries for which employees are either transitioning to work remotely, already working from home, or the industry closed completely due to COVID-19.
It is evident from Figures 4 and 5 that the normality and constant variance assumptions have been met to some extent.
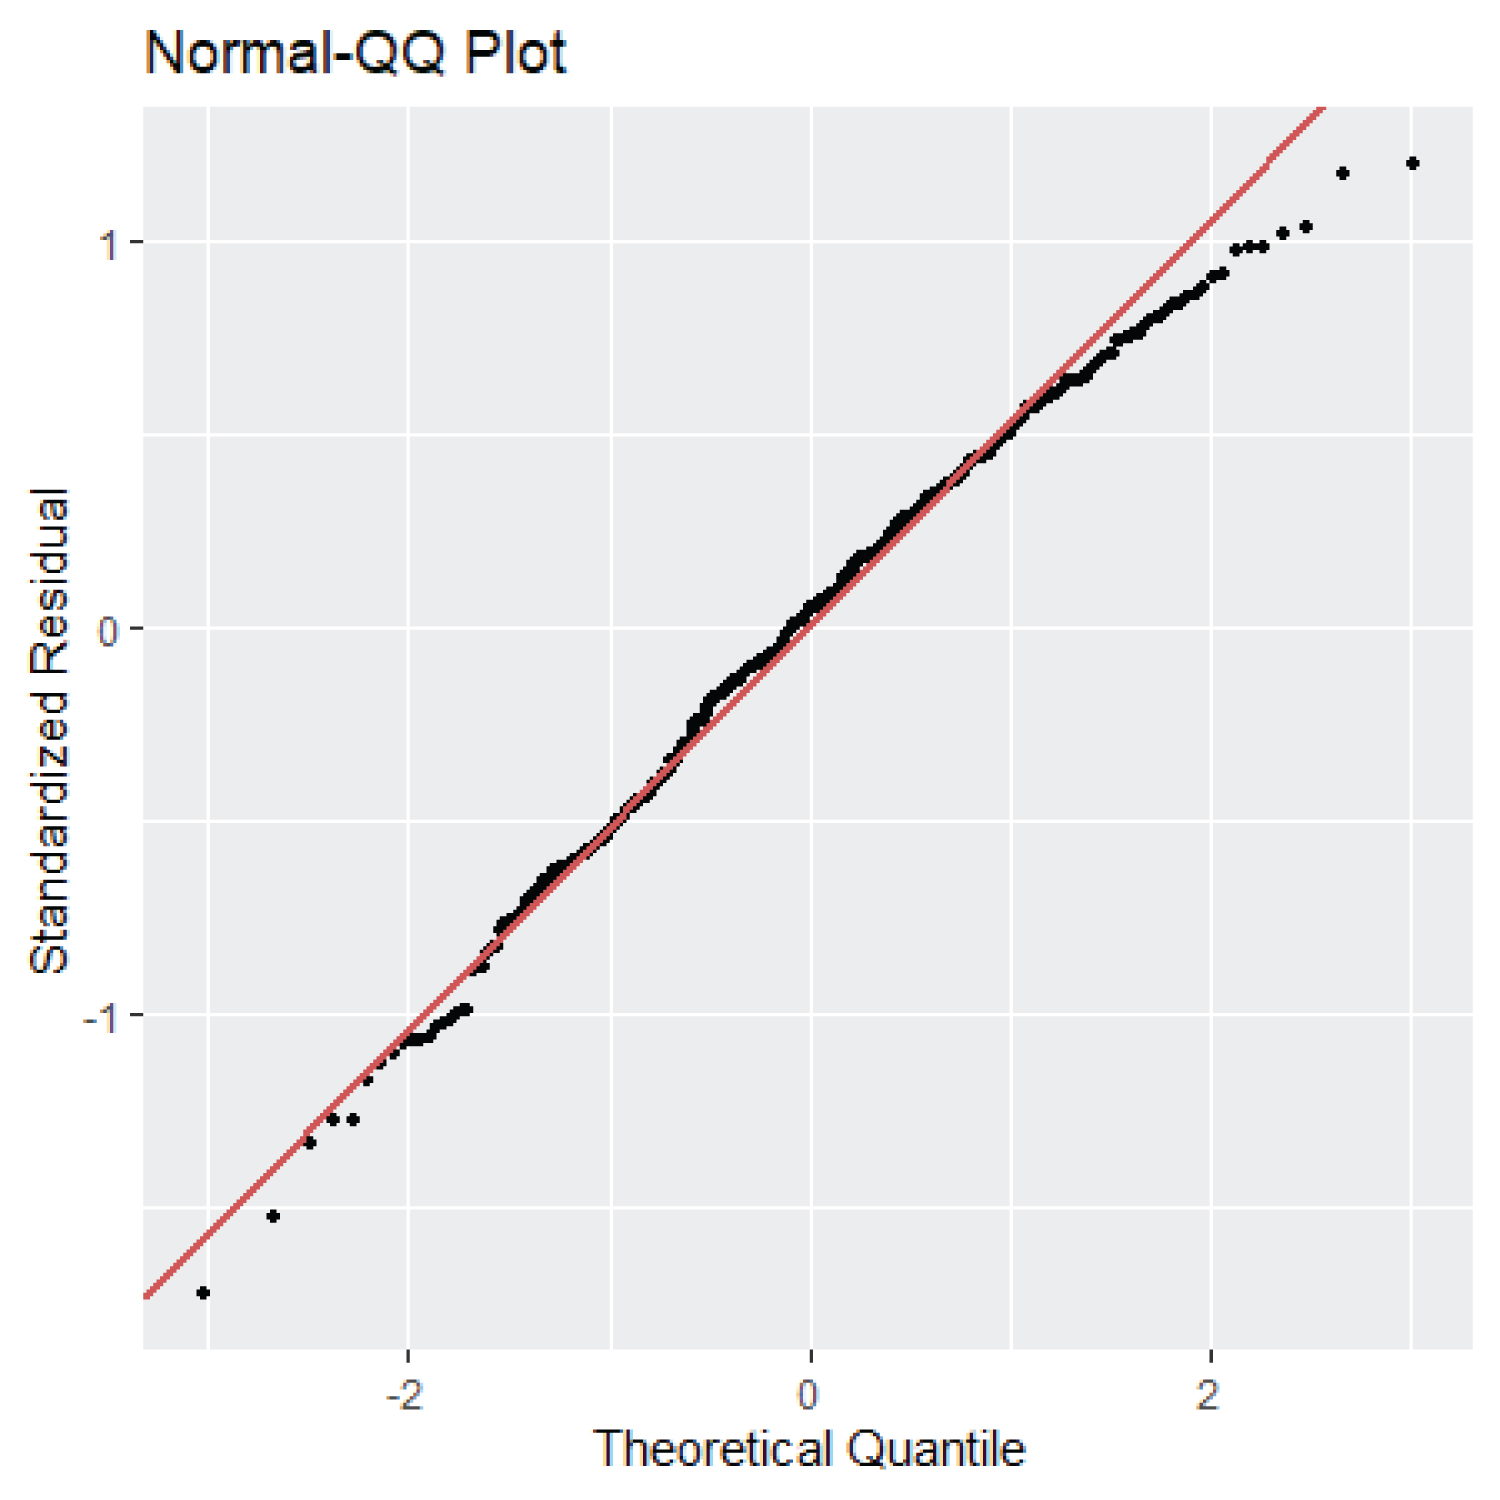 Figure 4: Final combined state linear model (Normal QQ Plot).
View Figure 4
Figure 4: Final combined state linear model (Normal QQ Plot).
View Figure 4
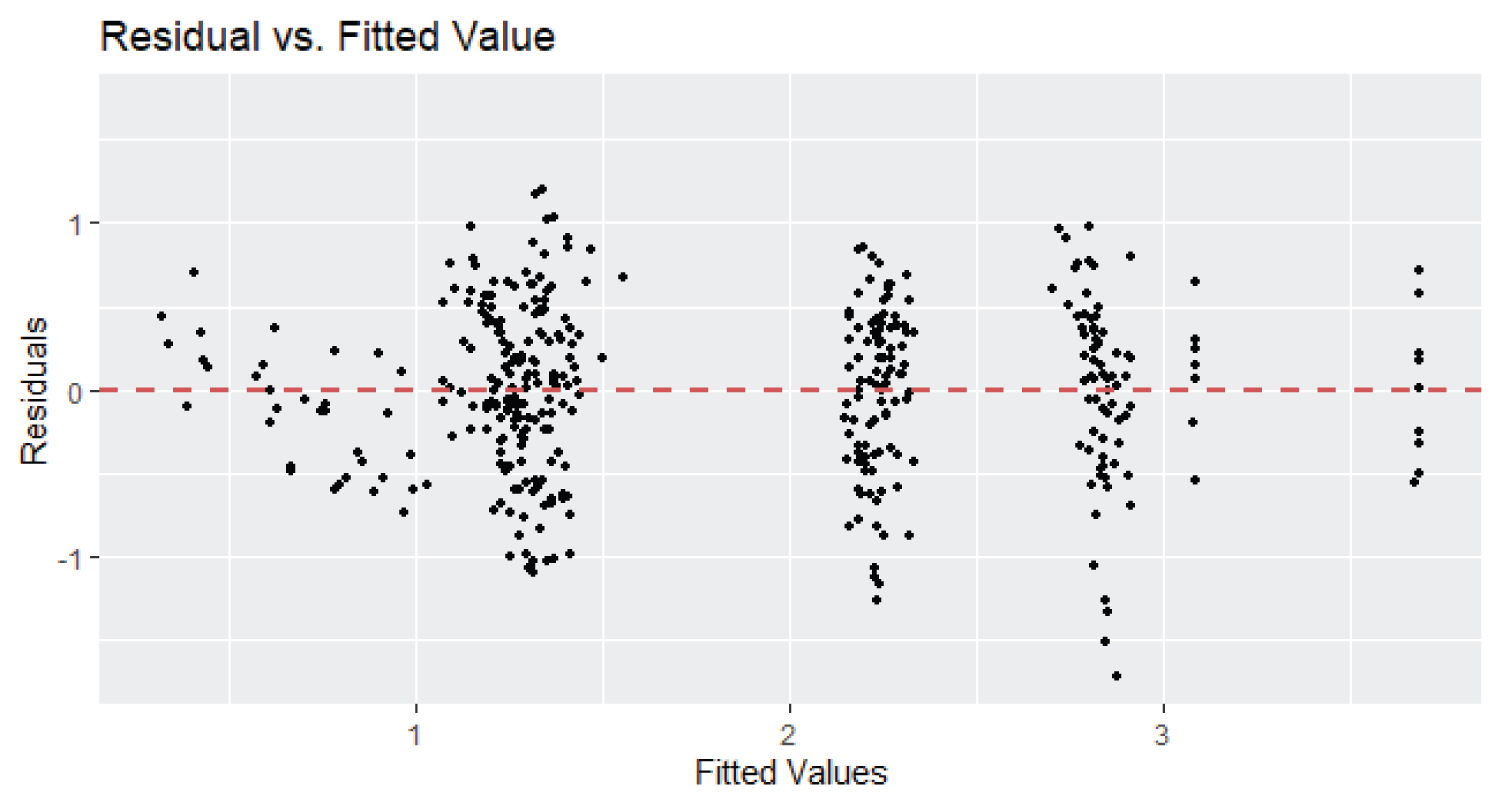 Figure 5: Final combined state linear model (Residuals vs. Fitted Plot).
View Figure 5
Figure 5: Final combined state linear model (Residuals vs. Fitted Plot).
View Figure 5
Upon constructing and identifying the ideal model out of the initial and final models for each of the individual states of California, Florida, New York, Pennsylvania, and Texas, it is clear that the overall trend for mobility is decreasing as government restrictions came to implementation; hindering on social gatherings, personal mobility, restaurant capacity/usage, as well as in the general business domain whether it be entertainment or the retail industry. The model that demonstrated the most success was the Combined State model which displays a relatively high adjusted R-squared value compared to all of the individual models.
Some of the limitations and challenges identified during this study were the repeated insignificance of the deaths regressor, the lack of additional regressor variables, and biased comparison of statewide mobility without normalization. The possible cause in the pattern of the insignificant deaths regressor could have an association with a delay in the number of confirmed deaths from the instance of infection to the reporting stage as no exact method or central guidelines have been established in reporting death data, leading to inconsistent results. The issue could be further exacerbated due to the dependencies on a variety of factors such as the varying duration of the incubation period for an individual, age of the individual, and any pre-existing comorbidities [14]. Additionally, the models created for this project involved at most four regressors to estimate the Mobility Index value, and in further research, additional regressor variables can be explored to better the fit of the model and explain more in the overall variability. It is also important to note that each state has varying population densities and geographic sizes; as a result, the descriptive statistics and current data for these individual states may not be the best for direct use or judgment in analysis and a method for standardization or normalization of the Mobility Index distance can improve upon the validity of the models and may remove the need of transformation in the model entirely. Another consideration involves the decreased or decaying effect of restrictions as time progresses. Due to the implementation of policies and related logistics to policymaking, restrictions have not been officially deemed as lifted and are instead related to an "easing" state, in which case it would be beneficial to consider this effect.
Authors are grateful to the anonymous referees and the Editor-in-Chief for their valuable comments and suggestions, which certainly improved the quality and presentation of the paper. We wish to dedicate this paper to all of those who have been lost or greatly affected by the COVID-19 pandemic.