For two independent random variables , let , where is some covariate of interest. For m values of the covariate, , the paper deals with the goal of testing in a manner that controls Family Wise Error Rate (FWE), the probability of one or more Type I errors. If m is relatively small, extant multiple comparison methods can be used to control FWE. But if m is relatively large, the actual level can be substantially smaller than the nominal level, raising concerns about relatively poor power. The paper describes a method for addressing this issue when is estimated via a running interval smoother.
Effect size, Smoothers, Multiple comparisons
For two independent groups, let be some random variable associated with the group. As is evident, one approach to comparing these groups is in terms of some measure of location. As is well known, there is vast literature regarding how this might be done. Another approach is to focus on
the probability that a randomly sampled observation from the first group is less than a randomly sampled observation from the second group. In the event tied values can occur, (1) is replaced with
Cliff [1], Acion, et al. [2], Kraemer and Kupfer [3], and Vargha and Delaney [4], among others, summarize arguments for focusing on p when comparing groups. Indeed, it seems fairly evident that p provides a useful perspective.
Certainly the best-known method for making inferences about p is the Wilcoxon-Mann-Whitney (WMW) test. It is well known, however, that under general conditions, the WMW method uses an incorrect estimate of the standard error. Numerous methods have been derived for dealing with this issue. Wilcox [5] summarizes the relevant literature.
This paper is focused on comparing two independent groups based on p when there is a covariate, say X. Let denote the value of p given that . Here, no particular parametric model is assumed regarding the nature of . Rather, is estimated with a particular nonparametric regression estimator, which is described in section 3. Let , where are m covariate values to be determined. The basic goal is to test
for each such that the family wise error rate (FWE), meaning the probability of one or more Type I errors, is equal to some specified value, . If the number of covariate values, m, is reasonably small, one can simply proceed along the lines in Wilcox [5]. A concern, however, is that important differences might be missed due to using too few covariate values. A guess is that a method in Wilcox [5] is readily adapted to the situation at hand when dealing with a large number of covariate values, but preliminary simulations made it clear that this approach is unsatisfactory. The actual FWE can be substantially smaller than the nominal level.
The goal is this paper is suggesting a modification of the method in Wilcox [5] that performs better in simulations. The proposed method is based in part on Cliff's [1] method for testing (1). Cliff's method was chosen based on results in Neuhauser, et al. [6] where several techniques were compared [7]. Particularly important here, for reasons made clear in section 2, is that Cliff's method has been found to perform relatively well even with sample sizes as small as eight.
The paper is organized as follows. Section 2 reviews Cliff's method. Section 3 describes the proposed method and section 4 reports simulation results. Section 5 illustrates the method using data from a study dealing with the emotional and physical well being of older adults.
Momentarily ignoring the covariate, Cliff's method for making inferences about p is applied as follows. Let be a random sample of observations from the group. Let
An estimate of is
Let
Then
estimates the squared standard error of . Let z be the quantile of a standard normal distribution. Rather than use the more obvious confidence interval for δ, Cliff [1] recommends
Cliff's confidence interval for is readily modified to give a confidence for p. Letting
and
confidence interval for p is
Now let be a random sample with the covariate, , included. The proposed method is based in part on a basic component of the running interval smoother, which has been studied extensively [5]. Momentarily focus on a single value of the covariate , in which case the goal is to test . The basic strategy is quite simple: Compute a confidence interval for p based on the values such is close to .
The precise details are as follows. For the group, let be the usual sample median and compute the median absolute deviation estimator , which is the median based on
. Under normality, estimates the standard deviation. Let
where the constant f, called the span, is to be determined. That is, for fixed , indexes the observed covariate values that are close to x. The values for which are called the nearest neighbors. Let be the estimate of based on the values for which . Choices for the span that generally perform well are (e.g., Wilcox) [5]. Here is used. As is evident, can be tested simply by applying Cliff's methods using the values for which .
There remains the problem of choosing the covariate values. In some situations there might be substantive reasons for using particular values. But otherwise it is clearly prudent to choose a reasonably wide range of covariate values. Here, two approaches are described and there relative merits are discussed in section 4.
To describe the first approach, let denote the cardinality of the set . The basic strategy is to focus on covariate values where , where η is some constant to be determined. That is, focus on situations where the sample sizes are sufficiently large when applying Cliff's method. Given , let be the smallest value such that simultaneously . In a similar manner, let be the largest value such that simultaneously . Let . The covariate values are taken to be the m values evenly spaced between and , inclusive, which are labeled c. Here, is used. Extant results suggest that Cliff's method performs reasonably well when is used henceforth unless stated otherwise. This approach to choosing the covariate values will be called method henceforth.
The second approach to choosing the covariate values is as follows. Let be an estimate of the quantile of the covariate associated with the group, . Let and . The covariate values are taken to be m values evenly spaced between and . Here, both q = 0.1 and 0.05 are considered. This alternative approach to choosing the covariate values will be called method Q henceforth. The relative merits of methods S and Q are summarized in section 6.
There remains the issue of controlling FWE. There is a wide range of techniques that might be used (e.g., Wilcox [5]). One possibility is to use the sequentially rejective technique derived by Hochberg [8], which has been found to perform well in simulations when m = 5. But as m increases, this approach results in FWE levels well below the nominal level. A similar concern arises using a critical value based on Studentized maximum modulus distribution (with infinite degrees of freedom) as well the method derived by Hommel [9]. This is not surprising for the following reason. Note that in various situations, the set , will not be empty, in which case the test statistics corresponding to these two covariate values will be correlated. In terms of controlling FWE, what is needed is a method that takes this into account. Results in Wilcox [5] suggest how to proceed. The basic idea is to determine a critical p-value, , when both Y and X have a normal distribution and there is no association between and . Then simulations are used to check on the impact of non-normality as well as situations where there is an association between and .
To be a bit more precise, let be the p-value when testing . Let denote and let denote the quantile of . So for any , is rejected when , in which case FWE will be equal to . So the strategy is to use simulations to determine when both and are independent and both have a standard normal distribution. Then simulations are used to determine the impact on FWE when and are dependent and when has a non-normal distribution.
Table 1 shows estimates of when using method S, m = 25 and = 0.05 and there is a common sample size n ranging between 30 and 800. (The same values are used by method Q). These estimates are based on 2000 replications. When n is small, execution time is reasonably low, but as n increases, execution time becomes an issue. Note that generally the estimates of decrease as n increases Overall, the rate of the decrease is very small, particularly for . Here, for sample sizes not included in Table 1, Cleveland's [10] smoother is used to estimate based on 1/n and the values in Table 1. (The R function l plot. pred in Wilcox, 2017, is used here) [5] For unequal sample sizes, is determined for both and and the results are averaged.
Table 1: Estimates of , = 0.05, when m = 25. View Table 1
This section reports simulation results on the ability of the methods in the previous section to control FWE under non-normality and when there is an association between and .
Data were generated based on
where is some random variable having a median of zero and a = 1 or 2. The distribution for the error term, , was taken to be a one of four g-and-h distributions [11] one of which is the standard normal distribution. If has a standard normal distribution, then by definition
has a g-and-h distribution where and are parameters that determine the first four moments. The four distributions used here were the standard normal a symmetric heavy-tailed distribution , an asymmetric distribution with relatively light tails , and an asymmetric distribution with heavy tails . Table 2 shows the skewness and kurtosis for each distribution. Figure 1 shows plots of these distributions. Additional properties of the g-and-h distribution are summarized by Hoaglin [11]. The results reported here are for situations where the distribution of was taken to be standard normal. A few simulations were run where and have the same g-and-h distribution, no new insights were found, so the results are not reported.
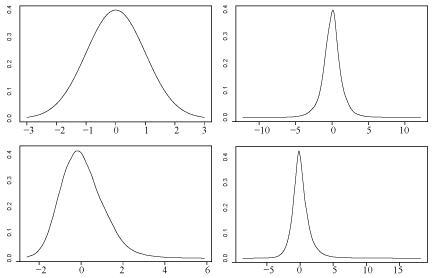 Figure 1: The four distributions used in the simulations. The upper left is (g, h) = (0.0, 0.0) (standard normal), the upper right is (g, h) = (0.0, 0.2), the lower left is (g, h) = (0.2, 0.0) and the lower right is (g, h) = (0.2, 0.2).
Y-axis = likelihood; X-axis = f(x). f (x) is the probability density function. View Figure 1
Table 2: Some properties of the g-and-h distribution. View Table 2
It is noted that if there is no covariate, transforming to some g-and-h distribution does not alter the results based on Cliff's method because it depends only on the ranks of the data. But when there is a covariate and there is an association between and , this is no longer the case. So an issue understands the impact on FWE when there is an association.
Table 3 shows the results for a = 1 and 2 and sample sizes (n1, n2) = (30, 30), (30, 60) and (150, 200), where the covariate values were chosen based on method S. Again 2000 replications were used. Although the importance of a Type I error depends on the situation, Bradley [12] suggested that as a general guide, when testing at the 0.05 level, the actual level should be between 0.025 and 0.075. Based on this criterion, the proposed method is satisfactory for all of the situations considered when a = 1. However, when a = 2, this is no longer the case. For (n1, n2) = (30, 60) and , the estimate is 0.079. For (n1, n2) = (150, 200), estimates are approximately equal to 0.1. For sample sizes (n1, n2) = (40, 100), and (n1, n2) = (50, 100), not shown in Table 3, again estimates exceeded 0.075. Lowering the span to 0.8 and even 0.6 does not correct this problem. Using η = 14 was found to be unsatisfactory as well. A closer examination of the simulation results revealed that when a = 2, inferences based on the more extreme covariate values result in FWE values greater than the nominal level. This motivated the second approach to choosing the covariate values, method Q in the previous section.
Table 3: Estimates of FWE when testing at the α = 0.05 and using Method S to choose the covariate values. View Table 3
Some additional simulations were run where , where the indicator function ; otherwise . The results were very similar to those where a = 1. So there are indications that method S can perform reasonably well when the regression line is not straight. But if there is sufficient curvature for the more extreme covariate values, this is no longer the case.
Table 4 shows the simulation results when using method Q. As can be seen, now the largest estimate is 0.066. Note that given the sample sizes, altering the distribution of the error term has an even smaller impact on the estimate of FWE compared to method S. The main difficulty is that the estimate drops below 0.025 in some situations, the lowest estimate being 0.020. For a = 2 and (n1, n2) = (600, 600), the estimates are nearly identical to those when (n1, n2) = (150, 200). For (n1, n2) = (50, 600), and a = 2 the estimate is 0.050. Simulations were also run using q = 0.05. The estimates differed from those in Table 4 by at most three units in the third decimal place.
Table 4: Estimates of FWE when testing at the α = 0.05 and using Method Q to choose the covariate values. View Table 4
Data from the Well Elderly 2 study [13] are used to illustrate the proposed method. A general goal in the Well Elderly 2 study was to assess the efficacy of an intervention strategy aimed at improving the physical and emotional health of older adults. (The data are available at http://www.icpsr.umich.edu/icpsrweb/landing.jsp). A portion of the study was aimed at understanding the impact of intervention on a Measure of Meaningful Activities (MAPA). A covariate of interest was the Cortisol Awakening Response (CAR), which is defined as the change in cortisol concentration that occurs during the first 30-45 minutes after waking from sleep. (CAR is taken to be the cortisol level upon awakening minus the level of cortisol after the participants were awake). Extant studies [14,15] indicate that the CAR is associated with various measures of stress. Here, a control group is compared to a group that received intervention.
Figure 2 shows the estimate of , where is the MAPA score before intervention, is MAPA after intervention, and is CAR. (Leverage points, outliers among the CAR values, were removed). Selecting covariate points via method S, significant differences are found for CAR ranging between -0.36 and -0.27. Plots of the regression lines, using Cleveland's [10] method, suggested that there is little or no curvature, which in turn suggests that method S controls FWE reasonably well. So there is an indication that when the CAR is sufficiently negative (cortisol increases after awakening), MAPA scores tend to be higher for the group receiving intervention. The covariate values used by method S range between -0.38 and 0.32. In contrast, when using method Q with q = 0.1, they range between -0.19 and 0.15 and no significant results are found. For q = 0.05 the covariate values range between -0.27 and 0.22 with a single significant result when the CAR is equal to -0.24.
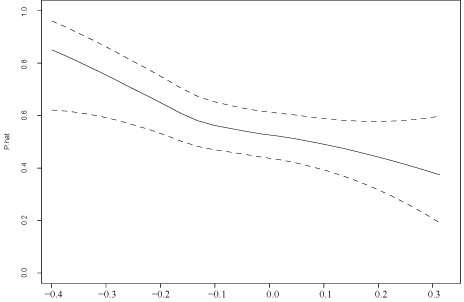 Figure 2: The solid line indicates the estimated probability that a randomly sampled individual from the control group will have a lower MAPA score than a randomly sampled participant in the experimental group. The dashed lines indicate a confidence band having, approximately, simultaneous probability coverage 0.95.
Y-axis = likelihood; X-axis = f(x). f (x) is the probability density function. View Figure 2
In summary, all indications are that method S for choosing the covariate values performs reasonably well except when there is a sufficient amount of curvature near the extreme ends of the covariate. Method Q avoids FWE well above the nominal level in situations where method S breaks down. But method S has the potential of providing comparisons for a wider range of covariate values. As was illustrated, this can make practical difference.
A criticism of method S is that there is no formal method for justifying the assumption that curvature among the more extreme covariate values is not an issue. For now, the best that can be done is to inspect the plot returned by some nonparametric regression estimator. So an argument for using method Q might be that it is safer in terms of controlling FWE.
Finally, R functions for applying methods S and Q are available at Dornsife.usc.edu/cf/labs/wilcox/wilcox-faculty-display.cfm and are stored in the file Rallfun- v34. The function ancdetwmw applies method S and ancdetwmwQ applies method Q.