Muscle ultrasonography is an upcoming tool in the evaluation of neuromuscular disorders. It is easily applicable in multiple clinical settings, has no contraindications, and provides a cost-effective alternative to other imaging modalities such as MRI. However, a known disadvantage of ultrasound is its dependence on examiner expertise. Furthermore, the assessment of muscle quality is done mainly through an assessment of muscle echo intensity, which is affected by machine/system settings, hampering comparison across centers. Over the years new methods have been developed to make results more objective and comparable for the assessment of myopathies. In this review, we will examine the role of ultrasound in the evaluation of idiopathic inflammatory myopathies (IIM), a heterogeneous group of autoimmune disorders which may be treatment-responsive. Studies have shown that ultrasound can be useful both for diagnosis and follow-up of IIM, particularly for dermatomyositis and inclusion body myositis. The addition of other ultrasound modalities such as Doppler and elastography, as well as the application of machine learning, appear promising for IIM. Further developments of these techniques are expected and will lead to more widespread use of ultrasound in the clinical assessment of IIM.
Imaging, Ultrasound, Ultrasonography, Myositis, Polymyositis, Dermatomyositis
Idiopathic inflammatory myopathies (IIM) are a rare group of heterogeneous autoimmune muscle disorders that are seen in both children and adults. They primarily affect the muscles presenting with weakness, although extra muscular manifestations involving the skin, joints, lungs or heart may occur due to the systemic inflammatory nature of these diseases [1]. Using the recent EULAR/ACR classification criteria, the IIMs can be classified into the following subgroups: polymyositis (PM), inclusion body myositis (IBM), dermatomyositis (DM), amyopathic DM, juvenile dermatomyositis (JDM), and juvenile myositis other than JDM [2]. IMNM is a newly recognized distinct clinical entity defined primarily by muscle necrosis on biopsy with little inflammatory infiltrate, however due to small sample sizes has been included in the subgroup of PM [3]. DM and PM are both treatable forms of IIMs and typically present with proximal limb weakness, with accompanying distinct skin manifestations in the case of DM. IBM is the most common IIM above the age of 50 and is characterized by progressive muscle weakness in both proximal and distal muscles with no currently effective treatment [4].
Although imaging methods have not yet made their way into classification criteria of myositis, the use of muscle imaging in the assessment of IIMs has grown over the years. Different imaging techniques have proven useful, but MRI remains the gold standard for imaging muscle. MRI imaging can sensitively visualize the distribution of muscle involvement, both changes of activity and damage [5,6]. Fat suppressed T2 weighted or short-tau inversion recovery sequences are very sensitive in detecting muscle or fascial edema, which show as hyperintense areas on the MRI image [5]. T1-weighted images are useful in detecting fatty infiltration of the muscle, with fat replacement leading to an increase in intramuscular intensity. These changes, however, are not unique to myositis and can be seen in other conditions like trauma and rhabdomyolysis [6]. Drawbacks of MRI include it being expensive, time-consuming, not widely available, and difficult to obtain in those with metal implants or pacemakers.
A cost-effective alternative to MRI is ultrasound, and advancement in ultrasound technology has enabled the development of new techniques to analyze muscle inflammation. A variety of studies have been conducted to evaluate the potential of ultrasound as a tool for both diagnosis and follow-up of myositis. In this review we aim to give an overview of the different ultrasound techniques that have been studied, and to provide insight to the current role of ultrasound in the field of IIMs.
Ultrasound (US) is a non-invasive modality that allows real-time imaging with high spatial resolution. It is easily applicable in the clinical setting and has virtually no contraindications for the patient [7]. It has increasing utility for soft tissue assessment and is currently used across a broad spectrum of medical subfields.
Healthy muscle tissue, when seen in cross-section, is relatively hypoechoic. This is thought to be the result of high profusion of blood in muscle tissue [8]. It shows a moderately echogenic speckled pattern caused by reflections of perimysial connective tissue [7]. In the longitudinal plane, reflections of perimysial connective tissue result in a linear, pennate or triangular pattern. The epimysium, a sheath of fibrous elastic tissue surrounding the muscle, appears hyperechoic (or white) on ultrasound. This makes it easy to discriminate muscle tissue from its surrounding tissues. Bone, and very dense calcium deposits, which reflects all ultrasound waves, appears white or hyperechoic with posterior acoustic shadowing [8].
When the muscle becomes abnormal, various changes can be seen structurally. With muscle conditions that cause fat replacement and fibrosis, the muscle turns whiter as a result of an increase in the number of reflecting surfaces within the muscle [9]. Depending on the severity, the underlying bone echo can become reduced or absent. This observation was first described by Heckmatt, et al. in 1980 [9], who later proposed a four-point scale to classify the intensity of echo reflected from the muscle which is currently known as the 'Heckmatt criteria': grade 1 -normal; grade 2 - increase in muscle echo while bone is still distinct; grade 3 - marked increase in muscle echo and reduced bone echo; grade 4 - very strong muscle echo and complete loss of bone echo [10]. Furthermore, changes in muscle thickness can also occur in affected muscles and can be measured using a digital caliper (Figure 1).
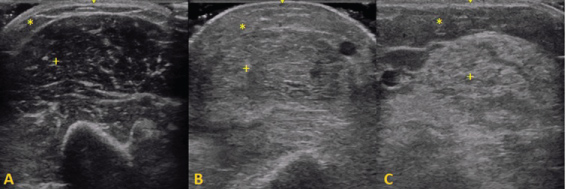 Figure 1: Representative ultrasound images of the biceps brachii muscle: + - muscle tissue, * - subcutaneous fat. A) Normal muscle: hypoechogenic muscle tissue with speckled pattern of echogenic reflections from perimysial connective tissue; B) Dermatomyositis: an increase in muscle echo intensity and increased echogenicity of subcutaneous fat; C) Inclusion Body Myositis: A marked increase of echo intensity due to fatty replacement of muscle tissue. View Figure 1
In order to perform accurate US analysis, there are multiple factors that can influence the measurement of parameters of muscle that must be considered. First, it is important to standardize machine settings, plane of view and position of the patient, as these can each affect the measurement of echo intensity and muscle thickness [7,10-12]. Conventionally, a linear ultrasound probe with enough frequency (at least 6-12 Mhz) to image peripheral skeletal muscle is used. Due to differences in structural composition of the muscle tissue, echo intensities of healthy muscles may differ between muscle groups and therefore it is best to only compare echo intensities among the same muscle groups [11]. Muscle echo intensity shows a slight increase with age and tends to be higher in females than males [13-15]. This effect is associated with replacement of contractile tissue by other tissues such as fat [15,16]. Muscle thickness on the other hand is higher in males than females and seems to gradually decline with older age [15]. Muscle thickness also relates to weight and use of the muscle such as with left- or right- handedness [15]. There is some evidence that higher subcutaneous fat thickness leads to increase of echo intensity, thought to be due to associated increased intramuscular fat [17]. Finally, muscle contraction and a post exercise state are both associated with an increase in muscle echogenicity and size [18-21].
Various structural changes can be seen in pathologic muscles. Chronic muscle changes like atrophy and fat infiltration are more easily discriminated than acute manifestations such as edema and inflammation. Muscle atrophy, which is associated with a decrease of muscle parenchyma, leads to an increase in muscle echo intensity which makes the muscle appear smaller and whiter on the US image [9,13]. Atrophy can also be appreciated by comparing the atrophic muscle with a contralateral limb or an adjacent healthy muscle. However, mild bilateral muscle atrophy or more diffuse involvement that can be seen in myositis could be difficult to detect. Fatty replacement in chronic muscle inflammation also results in increased muscle echo intensity.
Acute muscle inflammation is histopathologically characterized by perivascular, endomysial, and/or perimysial infiltrations of immune cells [12]. Remarkably, it appears that acute muscle inflammation also leads to increased echo intensity even when structural changes in muscle tissue are not yet expected [22,23]. Some studies explain this increase in echo intensity as the result of a combination of acute inflammation with accompanying edema [12,24,25]. However, some studies suggest that muscle edema, which histopathologically appears as loosely packed peri- and endomysial connective tissue, shows on US image as swollen muscle fibers with increased muscle thickness and a decrease in muscle echo intensity [13,22,23,26]. As the current literature is slightly contradicting in this aspect, intramuscular edema is not yet as well-characterized on US as it is on MRI and will need further study.
Other pathological changes in muscle tissue, like contusions, and muscle tears, can also be well-visualized on US. Muscle contusions appear as circumscribed lesions with either anechoic or mixed echogenicity [27,28]. The presence of coagulated blood and edema results in a more mixed echogenicity than a fully liquefied hematoma. Interstitial bleeding with dislocated intramuscular fasciculi, commonly caused by stretching injury, shows as a diffuse increase in muscle echogenicity and increase in muscle size on US image [27]. Muscle tear appearance on US can range from subtle low echogenic areas with swelling and local ultrastructural disruption, to complete loss of longitudinal muscle integrity, depending on the severity of the injury [28]. Assessment of the gap within muscle fibers can be studied dynamically using active muscle contraction and passive motion, which can be helpful in deciding operative management [29]. Scar tissue typically forms after more severe muscle injuries and shows as a hyperreflective area sometimes surrounded by a zone of lower reflectivity [28,29]. Rhabdomyolysis or necrosis of skeletal muscle shows on muscle US as thickened myofibrils with loss of the striate muscle pattern and regional areas of increased echo intensity [25,28,30]. Exudates can surround the necrotic muscle tissue and show as hypo-reflective pockets. The heterogenic appearance is not very specific and can easily be confused with other muscle abnormalities like hematomas. Subcutaneous and intramuscular calcifications are easily detectable as highly echogenic structures with posterior acoustic shadowing [12].
US imaging can also be used to evaluate physiological properties of the muscles, most often used in the field of sports medicine or physical therapy [8]. Frequently measured parameters include muscle thickness, width and cross-sectional area, which are commonly measured before and after an intervention. During contraction, the muscle increases in cross-sectional size and decreases in length longitudinally, while echo intensity increases as the muscle bundles thicken [8]. Increase in pennation angle of muscle fibers can also be observed during muscle contraction [31]. In the case of exercise-induced muscle damage resulting in soreness, an increase in cross-sectional area of the muscle has been seen, thought to be due to muscle edema [19]. Additionally, there can be an increase in echo intensity of the muscle, and the pennation angle of damaged fibers is larger [31].
Echo intensity is the main outcome parameter for most ultrasonography studies on IIMs. In 1989 Heckmatt, et al. introduced a method to quantify the measurement of muscle echo intensity by determining a region of interest (ROI) of the muscle tissue in the US image and calculating the mean gray scale within this ROI [32]. This method is now commonly used in the research field in addition to subjective analysis alone. The benefit of this quantitative manner of analysis is that it is less dependent on subjectivity and operator experience compared to visual interpretation. This makes results more comparable and objective [33]. Additionally, quantitative measurement tends to reach higher sensitivity than subjective analysis as it can detect abnormal echo intensity in muscles where the changes on the conventional ultrasound image are subtle [34]. It is important to note that echo intensity values from different machines are not directly comparable due to system-specific influences on grey-scale values. A requirement for the use of quantitative analysis for diagnostic purposes is that hardware- and software-specific reference values from healthy muscles are available [33,35].
On ultrasound, muscles affected by PM and DM show higher echo intensities than healthy muscles [13,36-41]. Echo intensity seems to increase with longer duration of disease because of greater atrophy and fat replacement in the muscles [13,37]. It can also normalize after start of treatment, paralleling improvement in clinical condition [38]. A recent study with mostly PM/DM patients found that US findings correlated well with disease activity [42]. Stonecipher, et al. has described an increase in echo intensity of deltoid, biceps and triceps muscles in patients with DM even when muscle enzymes were normal [36]. As normal muscle enzymes can be seen in DM despite active disease [43,44], this suggests that a positive ultrasound may indicate – in the presence of a normal creatine kinase level- subclinical, but also clinically overt disease.
One of the earliest studies by Reimers, et al. tried to correlate US images with histopathological findings in muscle biopsy. Their study showed that muscles in PM and DM with histopathologically proven edema were significantly less echogenic than those without edema, while muscle thickness was higher in those with edema which may be due to swelling of fibers [13]. On the other hand, muscles with fat infiltration showed higher echo intensities and lower muscle thickness pointing to concurrent atrophy. An interesting observation has been a notable alteration of echo intensity of the muscle with changes in angulation of the transducers in acute DM. The authors have thought this to be related to the perifascicular atrophy, although this effect has also been described in healthy muscles [12,41].
Muscle size is also known to be altered in patients with PM/DM. It seems that acute myositis is associated with normal muscle size or slight muscle swelling, whereas chronic myositis presents with decreased thickness due to related atrophy [13]. Maurits, et al. [14] and Bhansing, et al. [45] also found a decrease of muscle thickness in DM and PM compared to normal controls. Chi-Fishman, et al. studied the muscle diameter during contraction in 9 patients mostly consisting of PM/DM [46]. Their study showed that the contraction-induced changes in muscle diameter of the rectus femoris are smaller in muscles affected by myositis compared to healthy muscles.
Fascial thickness can also be measured on ultrasound, and notable thickening of the deltoid fascia in patients with DM and PM has also been described, pointing to fasciitis [45].
Similar to DM in adults, muscle echogenicity is higher in affected muscles than in healthy controls [22,23,41]. Collison, et al. showed in a retrospective study that after an average of 10 years after onset of symptoms, 6 of 10 patients with JDM still had increased echogenicity in at least one muscle group even though they underwent treatment and were believed to be in remission, indicating possible residual fibrotic changes in these muscle groups [47]. Habers, et al. observed in a prospective study that echo intensity increases in the first 3 months after start of treatment in JDM before it normalizes, while muscle thickness decreased in the first month after start of treatment [22]. This effect is presumed to be the result of reduction of edema, which would have a lowering effect on echo intensity. Bhansing, et al. found that muscle echo intensity was able to discriminate between high and low disease activity in JDM [23]. A significant correlation was found between echo intensity, childhood myositis assessment scale (CMAS) and muscle enzyme levels. This illustrates that US might be a useful tool in follow-up in JDM, which is advantageous given its ease of use in children.
Echo intensity is higher in muscles affected by IBM on US and appears to follow a specific pattern of muscle involvement that can be quite characteristic [39,40,48]. In a study with 6 IBM patients, Noto, et al. found higher echo intensities of the flexor digitorum profundus (FDP) in IBM compared to PM, DM and ALS while the flexor carpi ulnaris (FCU) remained markedly unaffected [39]. They showed that the FDP/FCU ratio could potentially be used to discriminate between these diseases. Nodera, et al. studied both finger flexors and triceps surae and observed a higher echo intensity in the gastrocnemius than in the soleus, resulting in a sensitivity of 72.7% and 100% specificity for IBM compared to PM and DM [40]. A larger study explored the pattern of muscle involvement in IBM compared to PM/DM and normals and concluded that the FDP, gastrocnemius and rectus femoris were the muscles most discriminating for IBM when scanning for seven muscle groups [48]. A heterogeneously increased echo intensity in muscles affected by IBM was also seen, in severe cases described as a 'popcorn' pattern.
Ultrasound image analysis is notoriously dependent on subjectivity and operator experience. Grey-scale analysis is a simple technique to quantify results, but it relies heavily on machine-dependent values and is therefore difficult to compare across centers. Thus, there is a need for new techniques in US with universally comparable outcomes [33]. Advancements in technology have made room for new modalities to overcome this challenge of quantification in sonographic assessment of IIMs.
Doppler is used in ultrasonography of IIMs to look at vascularity and blood flow in the muscles. Meng, et al. used Power Doppler Sonography (PDS) to score vascularity using a numerical scale of 0 - 4 in 37 patients with IIMs and found mildly elevated vascularity scores in IIMs that did not reach statistical significance [37]. However, the difference in peak vascularity did reach significance (p = 0.007). Vascularity scores tended to be more abnormal, showing higher vascularity, in the shorter duration disease subgroups. Even fascia can be looked at with Doppler---Yoshida, et al. used PDS for detection of increased vascularity in the fascia [49]. Four out of 7 patients with DM showed fasciitis on biopsy, while increased blood flow signals in the fascia were observed by PDS in 6 patients. None of the PM patients showed signs of fasciitis or increased vascularity in the fascia. PDS proved to be useful for detection of fasciitis associated with DM, especially in the early stage of disease.
Weber, et al. analyzed the muscle vascularity using CEUS (contrast-enhanced ultrasonography), a technique that relies on replenishment kinetics of 'microbubbles' that send high-energy US pulse after destruction by high-ultrasound signal [50,51]. Blood flow showed to be the best CEUS parameter, and sensitivity and specificity of 73% and 91% was reached for a diagnosis of DM or PM (compared to 100% and 88% using MRI). Edema was detected in all patients with confirmed myositis and was associated with increased perfusion detected by CEUS. Of note, vascularity was higher in PM than in DM and may reflect the capillary loss known to occur in DM. The study suggests that an increase of microcirculation could be a possible mechanism of muscle edema in myositis and can be picked up with this technique.
In texture analysis, differences in echo intensity distribution patterns in the muscle are used as a discriminative tool. Aside from subjective pattern observation, more advanced techniques have been studied to quantify texture differences.
In 2003 Mittal, et al. used perimysial septa count per 1 cm muscle width to quantify the muscle texture, with > 12 being abnormal [38]. Mean perimysial septa count was 14.6 in patients with IIMs compared to 10.8 in healthy controls and reverted to normal with clinical and laboratory improvement after 6 months. These findings indicate that it may be a useful marker of disease activity in inflammatory myopathies.
Dubois, et al. studied local texture anisotropy as a new parameter in 26 patients with definite IBM and 10 patients with Duchenne muscular dystrophy [52]. Texture anisotropy index (TAI) was compared to gray scale index (GSI). TAI appeared to be less influenced by gain settings of the US machine and had lower between-day variability compared to GSI values, while correlating linearly with muscle weakness in IBM. Additionally, TAI results were significantly lower in patients with Duchenne muscular dystrophy compared to healthy controls. These findings suggest TAI could be a promising parameter to follow.
In ultrasonic elastography, tissue deformation is measured as a response to external force. Ultrasonic elastography has proven itself as a useful tool with added value in other fields of expertise like breast disease [53] but has not been widely studied in the domain of IIMs. There are various ways to measure tissue elasticity, but the most studied technique in IIMs is strain elastography. The mechanism of strain elastography is based on comparison of the radiofrequencies of ultrasonic waves obtained before and after compression with the transducer [54]. Botar-Jid, et al. revealed a decrease of muscle elasticity in a group of 24 musculoskeletal patients mostly consisting of PM and DM [54]. The results of muscle elasticity also correlated with muscle enzyme levels, suggesting the accuracy of this technique in assessment of muscle structure damage. Berko, et al. investigated the efficacy of compression-strain US elastography in 18 patients with active JDM [55]. Although a high correlation was found between muscle elastography findings and echogenicity (p < 0.001), muscle elastography reached a poor sensitivity and specificity of 40% and 67% in detecting active myositis in JDM. The difference in results of these studies likely reflects the difference in their methodologies, including means of analysis of the resulting color map representing tissue elasticity.
In 2016 Song, et al. carried out a sonoelastographic study in 17 patients with inflammatory myopathies [56]. They scored the muscle elasticity using a 5-point severity scale and calculated the ratio between the muscle elasticity score of the affected target muscle and healthy reference muscle. The mean of this strain index ratio was 2.78 in muscles affected by myositis, which means that affected muscles were much stiffer than healthy references. Muscles affected in DM and PM tended to reach higher strain index ratios than JDM or other causes of myositis, although this difference was not significantly proven. Muscle biopsy showed infiltration of inflammatory cells in the affected muscles. It was suggested that this infiltration could be the cause of the altered mechanical properties of the muscle tissue.
A more modern elastography technique is shear wave elastography. This technique is based on shear waves travelling perpendicularly through the tissue, and in contrast with strain elastography it does not require the examiner to apply stress with the transducer [57]. Bachasson, et al. performed a recent study to explore the reliability of this new technique when analyzing diseased muscles [58]. They analyzed the biceps brachii of 34 patients with IBM using shear wave elastography with positive results. The within-day reliability of the shear wave analysis was adequate, but differences in between-day measurements were only moderate. Additionally, lower muscle stiffness was associated with more severe muscle weakness in IBM. This is in contrast to that found by the other studies above showing increased stiffness with inflammation and may hint at the differences between active and chronic forms of the disease (edema versus damage). Their study provides a rationale for further elastographic studies to investigate the muscle changes occurring in IIMs, which may prove to be a good complementary modality.
A new and different approach to the quantification challenge of muscle US analysis is the use of machine learning. In machine learning, computer algorithms are used to identify and quantify features on the US image which operators are often not able to detect consistently [59]. The computer creates these algorithms by first analyzing a set of 'training' data, which allows identification of discriminative patterns or features which are then tested on new data such as for classification or regression. Deep learning is a subfield of machine learning. Deep learning uses neural networks which are formed by classifying input data through a multilayered scheme of mathematical functions [59]. Millions of parameters are involved in these mathematical functions, which are automatically learned based on the labeled input data.
König, et al. explored the use of a computer aided diagnosis system based on texture analysis in 11 patients with myositis using only the biceps muscle [60]. The texture analysis method included first-order statistics, Haralick's features and Wavelet features. Their computer aided diagnosis system reached 85-87% accuracy, 90% sensitivity, and 83-85% specificity, depending on the expert radiologist. Additionally, their study showed that using a polygonal ROI leads to better test performances than a rectangular ROI. Molinari, et al. carried out a study in muscles of healthy subjects using a similar analysis methodology and showed that multivariate texture analysis can be used to discriminate gender and muscle types [61].
Burlina, et al. carried out a study to explore the use of machine learning using US images of 80 subjects including IBM, PM, DM and health controls [59]. Two different machine learning techniques were compared in this study: A conventional machine learning technique based on Random Forests (RF) and a deep learning technique based on deep convolutional neural networks (DCNN). Overall DCNN had a higher accuracy than RF which is advantageous given that it is fully automated and requires no user intervention. Accuracy for DCNN was 86.6% for distinction of IBM vs. normals, 76.2% for all disease vs. normal and 74.8% for IBM vs. PM/DM. Accuracy for RF was 84.3% in IBM vs. normal, 72.3% in disease vs. normal and 68.9% in IBM vs. PM/DM. Although this study was only an exploratory first step in the field of machine learning, its results suggest that automated diagnostics for US could be a potential in the future.
Until today MRI remains the first choice of imaging of IIMs as it can sensitively visualize the distribution of muscle involvement throughout the body [5]. Pattern recognition of muscle involvement in varying compartments using MRI can help in differentiating subtypes of IIMs [6]. MRI can also accurately distinguish between fatty infiltration and muscle edema [6], an aspect which tends to be challenging on ultrasonography.
The improvement of image resolution of muscle US in recent years has allowed for a detailed view of the muscle architecture, not otherwise achieved with MRI. For example, atrophic and hypertrophic fibres can be differentiated and provide clues as to the underlying disease [62]. Additionally, advancements in muscle US techniques assessing for vascularity and tissue stiffness may provide further information about the involved muscles. Dynamic assessments of muscle can also be accomplished on US and remains an arena to be explored in myositis.
MRI remains to be the gold standard for muscle imaging [63]. However, the role of US as a diagnostic tool in the field of IIMs has grown over the years, and the promising results of new advanced imaging techniques suggest that it has not reached its full potential yet. Muscle ultrasound is heavily dependent on examiner experience and is currently utilized mostly in specialty centers. However, it is a feasible and easily implementable instrument that is becoming useful as a screener for muscle disease and as a diagnostic tool for the inflammatory myopathies.
J.A. is funded by the Jerome L. Greene Foundation.
Both authors have no conflict of interests or any affiliations with third parties that might influence the contents of this manuscript.
Included articles were found on PubMed using a combination of the search terms "ultrasonography", "ultrasound", "imaging", "myositis", "dermatomyositis", "polymyositis", "inclusion body myositis." Retrieved articles were critically analyzed and additional articles were selected by cross-referencing.
K. L. performed the literature search and took the lead in writing the draft manuscript. J. A. conceived the original idea and supervised the project, including intellectual review and editing. Both authors contributed to completion of the final manuscript.