The novel corona virus 19 (nCoV-19) created a global pandemic situation. To control this pandemic effectively, the basic reproduction number (Ro) is an effective epidemic tool. This study was undertaken to estimate the basic reproduction number (Ro) of the novel corona virus (COVID-19) infection in Bangladesh.
This study used Susceptible-Exposed-Infected-Recovered (SEIR) compartmental model and their differential equations for the calculation of Ro and for the favor of calculation assume that, all the cases that occurred before 15 April, 2020 occurs under free propagation without any intervention. This study calculated the Ro based on the real time confirmed cases and suspected cases in April 14 and also theoretical prediction of cases based on other studies. Other parameters for calculation were taken from the epidemiological determinants of Severe Acute Respiratory Syndrome (SARS).
The basic reproduction number were estimated between 3.19-5.24 based on real time data of infected cases of nCoV-19 from WHO situation report and the range was 2.53-6.72 from sensitivity analysis.
The Ro of nCoV-19 is higher than SARS and have a higher transmissibility. This transmission rate can be controlled by separating infected and susceptible people. Well planned and effective control measures are needed to prevent further spread of the disease.
Novel corona virus (COVID-19), Basic reproduction number, Ro, SEIR model
The SARS corona virus 2 (COVID-19) pandemic is a global public health threat of international concern declared by WHO [1]. It is by far the largest outbreak of atypical respiratory syndrome diseases the world has ever seen, since the outbreak of SARS in 2003. In fact, within a week of initial outbreak it has exceeded the number of cases and that from those of SARS [2]. The outbreak was first identified in late December 2019 when clusters of respiratory illness cases of unknown etiology were found in the city of Wuhan of Hubei Province, which is considered to be associated with a seafood market [3].
COVID-19, similarly to SARS, is a beta-coronavirus that can be spread to humans through intermediate hosts such as bats [4]. Human-to-human transmission has been observed via virus-laden respiratory droplets, as a growing number of patients reportedly did not have animal market exposure, and cases have also occurred in healthcare workers.
Since the first cases the virus spread throughout the whole world and the number of cases is increasing day by day. The first case in Bangladesh was identified in March 8, 2020 in Dhaka. The first few cases were the immigrants who came from other country during the outbreak and their family members. However, gradually it transmitted to the native people and from them the community transmission occurred in the late march.
Estimating the epidemiological determinants of COVID-19 is significant and urgent regarding the assessment of future transmissibility, the prediction of future trend of epidemic spread and also in designing proper control measures in Bangladesh.
The most important parameter to find out the transmissibility of COVID-19 is through calculating the Basic reproduction number, Ro. The Ro id defined as the number of secondary cases generated from primary cases throughout its whole infectious period in a completely susceptible population without any intervention.
But in reality, during an outbreak a population is never completely susceptible because there are some interventions applied by the government or the people themselves and reduce the number of susceptible. However, as it is a new disease to the world and there is no potent vaccine against it, so we considered the whole population is susceptible. This study assumed that the infected individuals whose onset time of symptoms no later than March, 2020 were resulted from the free propagation, that is, the transmission was without interventions.
The main target focusing on controlling the disease is to make the Ro less than 1 and let the infection fade out in a population. This study use SEIR (Susceptible-Exposed-Infected-Recovered) model to estimate the Ro in Bangladesh.
This study was intended to find out the Basic reproduction number of the COVID-19 in Bangladesh, under free propagation. The community transmission was started in Bangladesh from late March to early April. The actual lockdown and intervention Method were started after the community transmission has started in April 1st, so prior to that point the virus go the chance to propagate freely. As the incubation period of the virus is 2-14 days (average 5.1 days) [5], this study considered that the cases would be taken until April 14. So, it will include cases from the time when the virus could propagate freely.
This study uses the SEIR compartmental model [4] to characterize the condition of spreading of COVID-19. In this model, any individual could fit one of the four compartments: Susceptible (S), Exposed (E), Infectious (I), Recovered (R).
At every time steps, the probability that a susceptible person would become an exposed person to COVID-19 is if he/she came in contact with an infected individual. The probability that an exposed person become an infectious person is γ and μ is the probability that an infectious person would recover in that time steps. The differential equations for SEIR model thus could be denoted as:
In the equations, the S(t), E(t), I(t), R(t) represent the number of individuals in each compartment of Susceptible, Exposed, Infectious, Recovered, respectively at time t. In that case, it could be said that the total number of populations in the compartments N is,
N = S(t) + E(t) + I(t) + R(t)
The total population is so large that the infectious people in the early stage of infection could be negligible. So, S(t) approximates to N when time t approaches to 0. The basic reproduction number could be described as [6]:
Where is the early exponential growth rate, described as and Y(t) people who are infectious in time t with visible signs and symptoms. The exposure period can be denoted as and the infection period as . The approximate generation time would be . The ratio of exposure period to generation time, expressed by P is .
Now we can rephrase the basic reproduction number equation as:
Before estimating the Ro of nCOVID-19, determination of the parameters λ, p, Tg were needed.
The λ is determined by Y(t). The real time data from WHO sitrep, and IEDCR [7] showed that, total confirmed cases in Bangladesh were 1572 and suspected cases are 1486 in 14th April, 2020. Actually, in reality the cases would be much higher than that because of poor detection method and lack of proper equipment and man-power available. Besides, a good proportion of infected person didn't show any symptoms and remain unidentified. But, in favor of the calculation we have to ignore the situation. To estimate q, the fraction of suspected that became confirmed this study observed q of last 7 days (April 8-April 15) and then the average was taken (Table 1). The result was 0.111.
Table 1: Estimation of the proportion of suspected turned into confirmed, denoted by ‘q'. View Table 1
So, the number of cases with symptoms would be Y(t) = 1572 + 1500*0.111 = 1737. The actual scenario of infected would be much higher and this study considered this is the lower bound of the people with onset of symptoms.
Previously published paper showed that the confirmed cases were merely 5.1% of total cases including asymptomatic cases [8]. So, if only that percent of cases were detected the actual infected people would be much larger than the confirmed cases in April 15 (1572). If we calculate, the actual number of patients with nCOVID-19 would be 31,440 (considering detected cases as 5% of total cases), so much larger than the confirmed cases. This amount was used as the upper bound for sensitivity analysis for Y(t). As the occurrence of first confirmed cases were identified at March 8, this study considered this date as t = 0, despite the fact that the onset of symptoms might occur before collection of samples. The estimated Ro could be a little bit higher by considering March 8 as t = 0. This study used Y (39) = 1737 as lower bound and Y (39) = 31,440 as the higher bound of infected cases in the community.
Some previously published paper showed that the p of SARS was in Between the range of (0.5-0.8) and this study considered p as 0.65 due to lack of sufficient data [2,9]. As the formula p(1-p) was a symmetrical formula, the range (0.5-1) would cover all the possible values of p. In sensitivity analysis, this study took the range of p as (0.5-1).
The average generation time Tg was 8.4 days according to Lipsitch [10,11], where in the early outbreak, the Tg were as high as 10 days. They suggest that the range of Tg in sensitivity analysis was (8-12). Due to lack of any real time data for Tg of COVID-19, this study mainly concentrated on Tg = 8.4 days and Tg = 10 days and in sensitivity analysis, the range were taken as 8-12.
Considering all the facts, for Y(t) = 1737, the Ro was 3.19 (for Tg 8.4 days) and 3.73 (for Tg 10 days). And when Y(t) = 31,440, the Ro was estimated as 4.35 (for Tg 8.4 days) and 5.24 (for Tg 10 days) (Table 2).
Table 2: The estimated basic reproduction number under different parameters. View Table 2
For sensitivity analysis of the result of Ro, three parameters [Y(t), Tg, p] were taken. As worst-case scenario, this study took Y (39) = 31440, Tg = 12 and p = 0.5. For the best-case scenario, the values were taken as Y(39) = 1737, Tg = 8 and p = 1 (Figure 1).
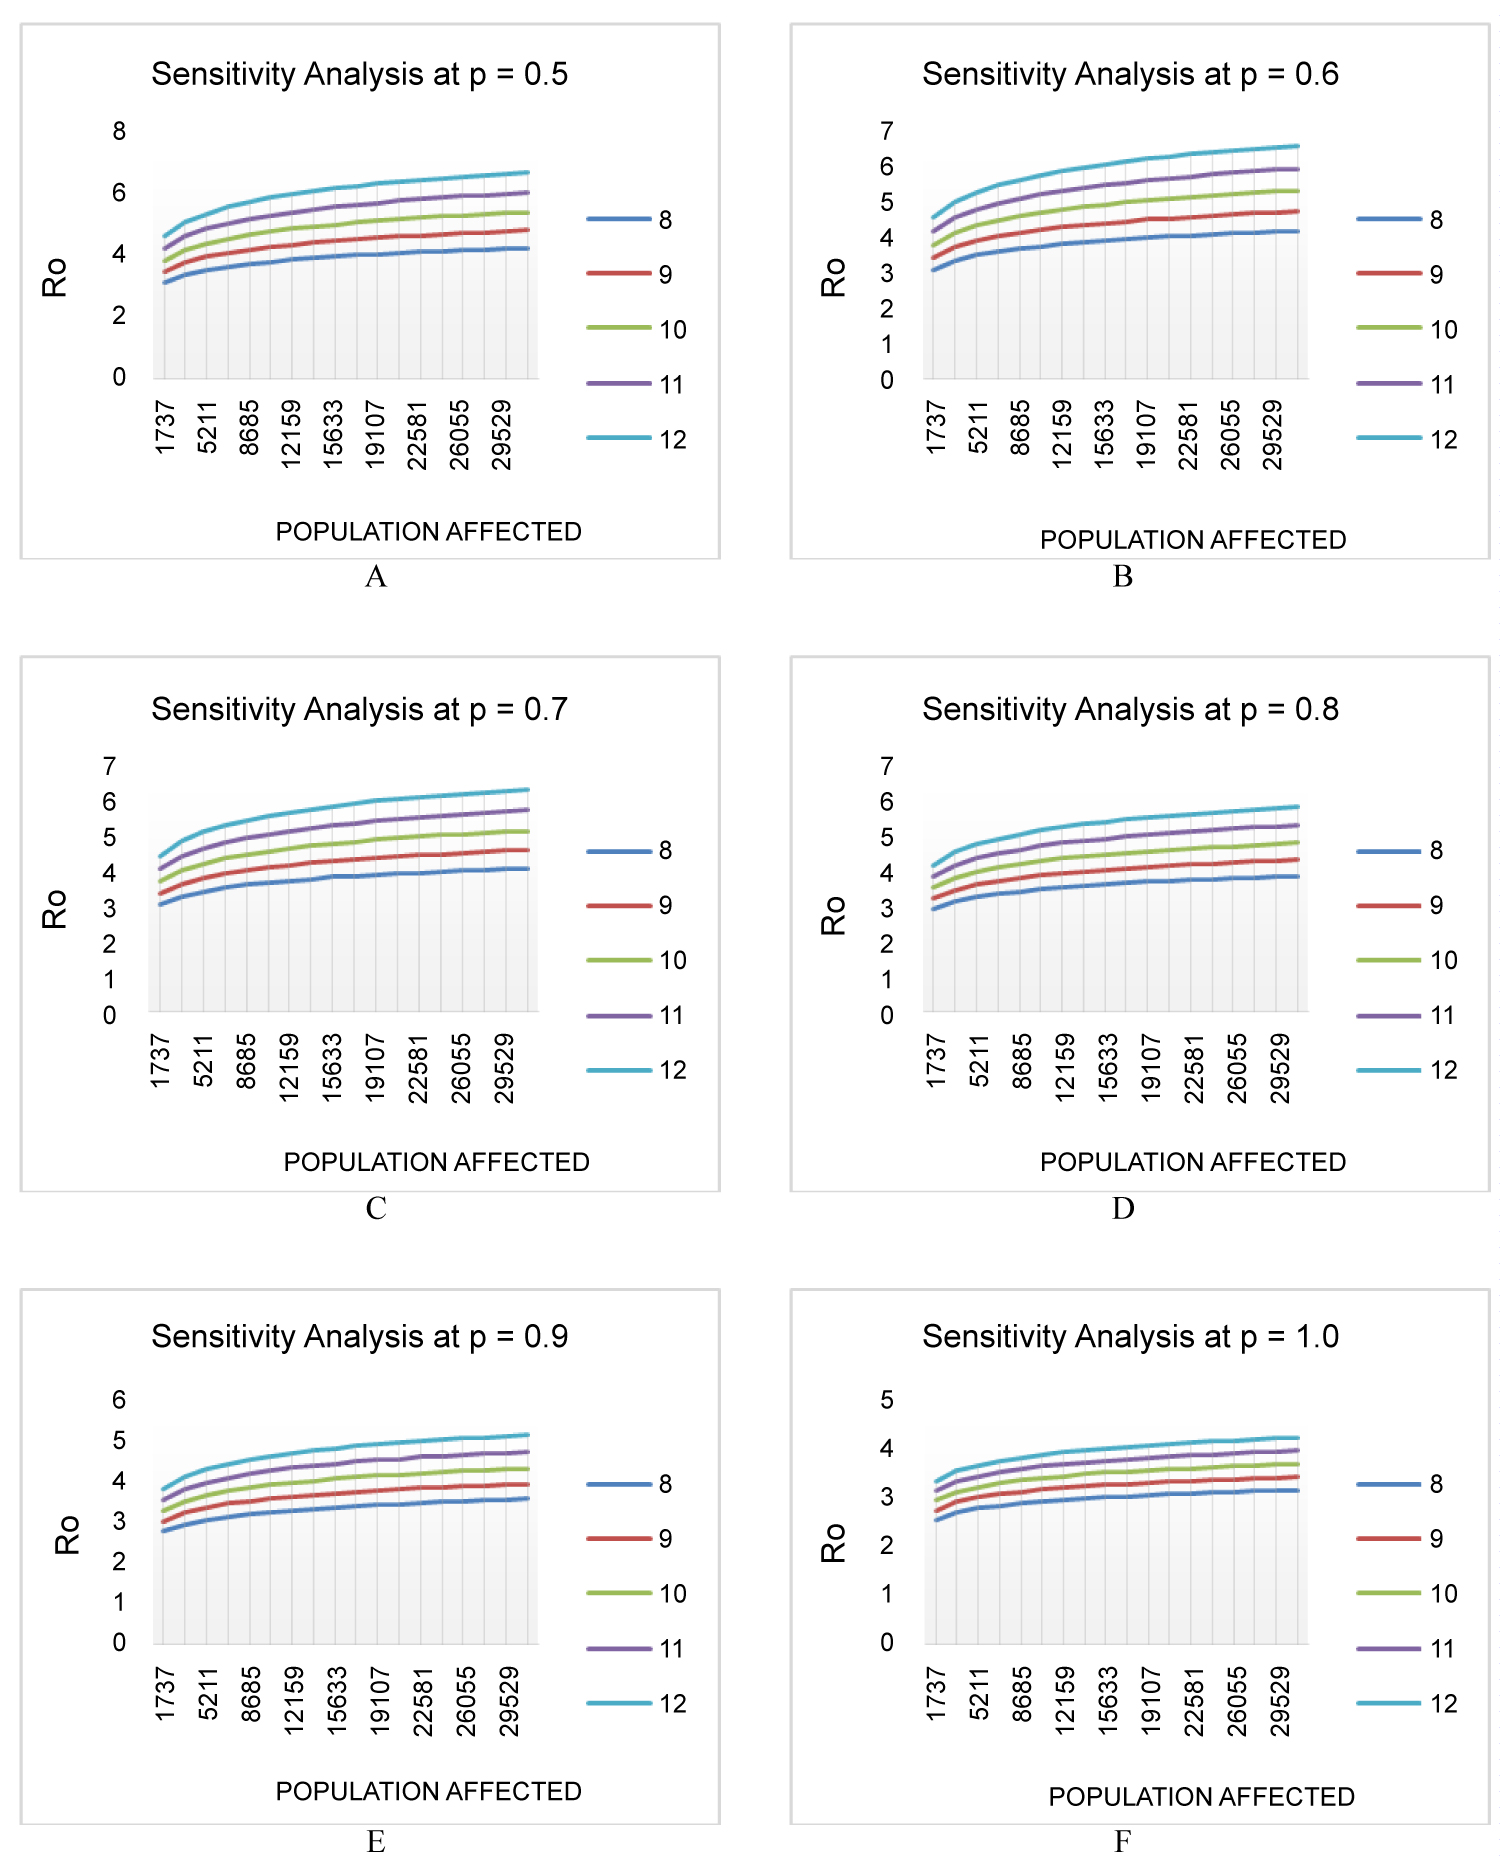 Figure 1: Effect of different parameters in basic reproduction number based on sensitivity analysis. The X-axis indicates number of cases with symptoms, Y (39) and Y-axis indicates the Ro. (A-F) indicates different scenario at p = 0.5, 0.6, 0.7, 0.8, 0.9, 1.0 respectively. The curve denotes Tg 12, 11, 10, 9, 8 from top to bottom respectively.
View Figure 1
Figure 1: Effect of different parameters in basic reproduction number based on sensitivity analysis. The X-axis indicates number of cases with symptoms, Y (39) and Y-axis indicates the Ro. (A-F) indicates different scenario at p = 0.5, 0.6, 0.7, 0.8, 0.9, 1.0 respectively. The curve denotes Tg 12, 11, 10, 9, 8 from top to bottom respectively.
View Figure 1
Considering the worst- and best-case scenarios, the basic reproduction number (Ro) had the range of 2.53-6.72, which is slightly higher than the Ro estimated in China (2.3-5.2). This number is higher than the Ro of SARS which is in the range of 2.2-3.6 according to Lipsitch, et al. [10] and 2.7(2.2-3.7, 95% CI) according to Riely, et al. [12]. Even the best-case scenario of COVID-19 has a slightly higher Ro than those of SARS. But, the Ro of COVID-19 is lower than or similar to many known viruses, for example, MERS had 8.09 in South Korea epidemic in 2015 [13-15], small pox had 3.5-6.0 [16], the measles had 12-18 [17], the chicken pox had 10-12 [18] and the mumps had 10-12 [19]. So, in relation with those viruses the COVID-19 doesn't have a very high level of transmissibility.
The result of Basic reproduction number was varied greatly with the change of generation time, Tg. The more accurate estimation of Tg thus will help to determine the Ro more accurately. Further epidemiological survey is essential to determine the Tg.
The number of affected people varies greatly due to lack of proper identification method. A fair percent of the affected people remains unidentified or have mild symptoms that recover without even going to the hospital. But they act as a carrier for the virus. Besides, the asymptomatic cases are also a great source of transmission. So, the actual number of affected people will be much higher than the official confirm list. That's why this study consider the worst case affected people are 31,440 in April 15, which is approximately 18 times higher than the official confirmed cases. This study suggests to be more pessimistic and less optimistic and consider the Ro of worst-case scenario, in designing the control measures.
This study took the value of p within the range of 0.5-1.0, because the individuals in exposed condition may have a different degree of infectiousness. The wide range of p would cover all the differences in the infectiousness.
The method used in this study was largely based on preliminary and insufficient data. In order to determine more accurate basic reproduction number and effective reproduction number, we need to know about the epidemiological determinants precisely and clearly. Besides, to get an idea about the epidemic trends of the COVID-19, the model used in this study need to be further developed by taking into account about the versatility of infectiousness, dynamics of susceptibility, probability of getting infected in different sex, age groups and ethnicities and the mechanism of transmission under different community in environmental conditions, population density and human movement [18,20-22].
Under a dynamic perspective, the government control policies should target to reduce all of those parameters (λ, p, Tg) and overall reduction of basic reproduction number or effective reproduction number under 1. According to the result of the study, in the worst-case scenario, this has to be reduced from 6.72 to less than 1. That's become a huge task for the government. Staying at home and avoiding any social gatherings or community meetings will help to reduce the contact between infected and susceptible individual and thus decreasing the probability of getting exposed to COVID-19, β. Washing hands with soap or any alcohol-based sanitizers will do the same. If an individual has contact with a confirmed individual, quarantined him from the community and immediate medical attention will reduce the duration of exposure, γ for the community. Because, according to some epidemiological study, the individual can become infectious, but remain as exposed, long before showing any signs and symptoms. Individual showing signs and symptoms of COVID-19, should be isolated immediately to stop the transmission to a susceptible one and thus decreasing the infectious period, µ. Restrictions of public transportation, lockdown of highly affected zone and contact premises, will help to reduce the parameters as well as the basic reproduction number.
The SEIR model is used to describe the dynamics of infection of COVID-19 and the estimation of basic reproduction number. Based on the collection of real time data, the basic reproduction number is predicted under different infected population by sensitivity analysis. The basic reproduction number of COVID is higher than SARS and has a higher rate of transmissibility. To effectively control this condition, proper control measures have to be undertaken quickly and to make the basic reproduction number less than 1. This study shows that, the Ro is sensitive to different parameters, mainly generation time, Tg. This study suggests that further research is required to determine the parameters more accurately and thus make the more precise prediction of basic reproduction number.
The authors of the study have no conflicts of interests.
All authors have equally contributed.