To investigate the relationship between pre-exercise blood glucose levels and performance during a 7-point incremental swim test.
Forty-two National level swimmers undertook a 6 × 200 m incremental training set at predetermined pace, followed by an additional maximum effort swim, with each swim starting every 6:30 minutes. Subjects were asked to be one hour post-absorptive. Results were analysed in three groups based on pre-test blood glucose level; Low Blood Glucose (LBG) below 4.3; Euglycemic (EUG), 4.3 mmo/l to 6.0 mmol/l; High Blood Glucose (HBG) above 6.0 mmol/l. After each 200 m - swim, blood glucose, blood lactate, and heart rate were taken. Additionally, swim speed, stroke count, and stroke rate were recorded for each swim. Values were plotted against the swim time of each swim.
Significant differences were observed between responses for both LBG and HBG when compared to EUG for blood glucose, lactate and heart rate (P < 0.01). Additionally, markers of swim efficiency and swim speeds were significantly affected by LBG (P < 0.01). High blood glucose appeared to be beneficial to swimming efficiency against LBG and EUG (p < 0.01).
Blood glucose levels prior to swimming had a marked effect on performance. LBG resulted in a significant reduction in the blood glucose, lactate, heart rate, and swimming efficiency responses to swimming at a range of intensities, up to maximal effort.
Blood glucose, Maximal effort, Swimming
Carbohydrate ingestion prior to exercise has been the subject of much debate over the last few decades [1] with a range of individual responses observed with different carbohydrate loads, across a time period of 15-75 minutes pre-exercise [2]. It has been argued that pre-exercise carbohydrate feeding, and subsequent insulin response, added to the onset of moderate intensity exercise can lead to hypoglycaemia (defined as a blood glucose level below 3.9 mm/L) [3,4]. This response appears to be highly individualised and protocol dependant [5], leading to a picture that is inconclusive.
The majority of investigations into the effect of glucose ingestion on exercise performance have been conducted at intensities between 30 and 70% of maximal aerobic capacity (VO2max). Even, those at higher intensities have been carried out at less than 85% of VO2max, and conducted over exercising periods where the subject cycled to exhaustion (minimum 30 mins up to 3 hours) [1,3,5-10]. The vast majority of Olympic events however, last less than 8 minutes or are made up of repetitions of short highly intense periods between 10 seconds and 1-4 minutes [11]. In this situation, performance begins at or about VO2max and can be as high as 150% of VO2max. The very short events can reach intensities in excess of 175% VO2max [12]. In these circumstances, we argue that the vast majority of the research concerning the effect of glucose ingestion on performance is inapplicable.
To our knowledge, none of the procedures used previously have looked at the effect of pre-exercise blood glucose level on competition-specific performance. Rather, the focus has been on the size or timing of the bolus used, and then to observe a reaction. For this reason, we believe that important issues are being missed in the effect of the level of blood glucose on the subsequent performance.
The aim of this investigation was to investigate the effect of pre-exercise blood glucose level on markers of performance during a stepped exercise test covering intensities from 70 to 100% of maximal effort (75 to 110% of VO2max).
Forty-two National and World-class swimmers, regularly competing at international and world championship level, undertook a 7-point step test as part of their conditioning and monitoring program. All swimmers were familiar with the test protocols since these tests formed part of their routine fitness programme. Each swimmer carried out 7 × 200 m swims, repeated on a 6-minute 30-second interval, in a 50-metre pool. Each swim started from a push. Swimmers were asked to progress the pace of each successive swim, starting at 30 seconds slower than their personal best time and progressing to the final swim at maximal pace. This was a pace that was deemed to be at a pace that was no slower than 5 seconds of their personal best for a 200 m swim (which would have been from a dive start). Although this final swim was completed at maximal effort, due to each individual's stage of training, it may not always have matched their personal best performance time. The swimmers were asked to be 1-hour post-prandial at the time of the test. All swimmers completed the standard warm-up, then waited 5 minutes before having the pre-test blood glucose and lactate samples taken. Blood was taken from an ear prick and measured using a Lactate Pro Lactate meter (Axon Labs., Austria) and GL40 Blood glucose metre (Beurer, Germany). During each stage of the 7-point swim test the following data were collected: Swim time, heart rate (recorded immediately on completion of each swim via a 10 second palpitation), lactate and glucose (collected 2 minutes after the completion of each swim), stroke count, and stroke rate.
This study was approved by the ethics committee of Christchurch College of Education and written consent was obtained from all participants.
Based upon the pre-test blood glucose values, the swimmers profiles were divided into three groups for analysis. The median value of all 42 swimmers was 5.2 mmol/l. Low Blood Glucose (LBG) was then deemed to occur from 0.9 mmol/l below this value (LBG < 4.3 mmol/l) and a High Blood Glucose (HBG) level was deemed to occur from 0.9 mmol/l above this level (HBG > 6.1 mmol/l). There were 11 profiles in the LBG group, (range 3.7-4.2 mmol/l), 11 profiles in the HBG group (range 6.1-6.4 mmol/l), leaving 22 profiles in the Euglycaemic (EUG) group (range 4.3-6.0 mmol/l).
The data were analysed using Microsoft Excel and Minitab (Version 5) software package. Descriptive data were presented as mean values ± Standard Deviations (SD). Between groups differences (HBG, LBG, EUG) were determined via t-tests. Statistical significance was set a priori at an alpha level of 0.05, but was adjusted to account for multiple tests (HBG vs. EUG; HBG vs. LBG; EUG vs. LBG; 0.05/3 = 0.016).
Pre-swim mean plasma glucose levels were 5.2 ± 0.42 mmol/l (EUG), 4.0 ± 0.23 mmol/L (LBG), and 6.3 ± 0.28 mmol/L. Both the LBG and HBG resting values were significantly different from the EUG value (p < 0.001).
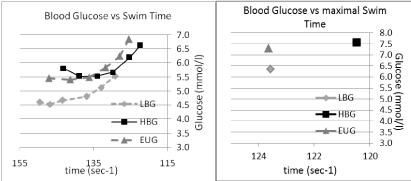
For the HBG group, we observed a significant drop with blood glucose with the onset of exercise, dropping from 6.3 ± 0.28 mmol/l to 5.81 ± 0.69 mmol/l (p < 0.05) after step 1. For the LBG group, we observed a significant increase during the same period with blood glucose rising from 4.0 ± 0.23 mmol/l to 4.53 ± 0.50 mmol/l (p < 0.05). No such changes were observed in the EUG group.
During the following stages we observed no significant changes in blood glucose for each of the groups until swim speed reached approximately 95% of max speed. This occurred during stage 4, 5, 6 for the HBG, and stage 5, 6 for the LBG and EUG groups.
The blood glucose - velocity profiles for each of the groups can be seen in (Figure 1). In the EUG group, from the resting point, blood glucose rose but not significantly with the onset of exercise and the rise of intensity until the rise in intensity between steps 5 and 6 (96.61% and 98.52% of EUG max speed) and between steps 6 and the maximal effort swim (98.52% and 100% EUG max speed).
 Figure 1: Blood glucose vs. swimming time in three conditions, LBG EUG & HBG. View Figure 1
In the HBG group, after step one (86.36% of max speed), blood glucose showed a significant fall from the resting value of 6.3 ± 0.28 mmol/l to 5.81 ± 0.69 mmol/l, and fell further in step 2 (89.06% of max speed) and plateaued between step 2 and step 3 (92.25% of max speed) at 5.54 ± 0.83 mmol/l. From here the blood glucose began to rise, initially marginally, then more significantly between steps 4 and 5 and particularly between steps 6 (98.36% max speed; 6.2 ± 0.64 mmol/l) and step 7, (102.62% max speed; 7.57 ± 0.94 mmol/l). None of these individual changes were seen as significantly different.
In the LBG group, after step one (82% of maximal swim), blood glucose showed a significant rise from 4.00 ± 0.13 mmol/l to 4.53 ± 0.50 mmol/l (P < 0.003). The blood glucose then rose marginally until step 4. From step 4 to 5 blood glucose rose, but not significantly. From step 5 to 6 blood glucose rose significantly from 5.15 ± 0.45mmol/l to 5.54 ± 0.49 (P < 0.003) and showed a further steep rise from points 6 to the maximal effort swim (5.54 ± 0.49 to 6.35 ± 0.44 mmol/l; p < 0.05).
When observing the mean glucose profile for all submaximal swims [1-6], overall, there was no significant difference between the EUG and HBG groups. The mean glucose profile in the LBG group, however, was significantly different from the HBG (p < 0.001) and EUG groups (P < 0.001).
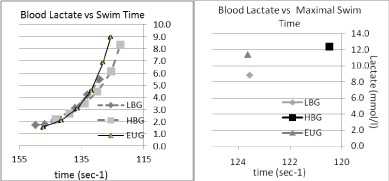
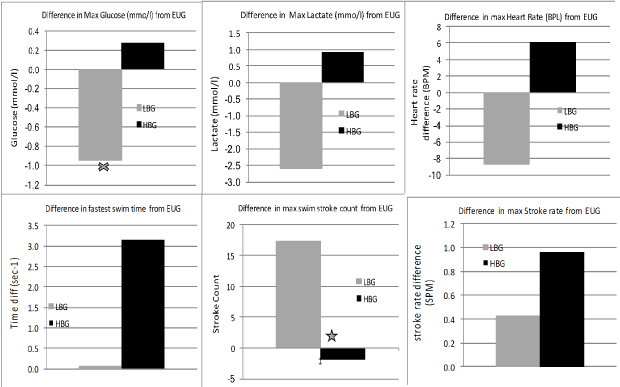
When observing the overall blood lactate profiles (Figure 2), in comparison to the EUG group, the following observations were made. Blood lactate appeared to follow the same overall profile shape, however the swim speed at any given lactate appears to be slower for the LBG and faster for the HBG. Peak lactates, observed after the final swim, were significantly lower (8.85 vs. 11.42 mmol/l; p < 0.05) for the LBG group, with no significant difference observed between the HBG and the EUG group (12.35 vs. 11.42; p < 0.45).
 Figure 2: Blood lactate vs. swimming time in three conditions, LBG, EUG & HBG. View Figure 2
The heart rate profiles for each condition are shown in (Figure 3). Heart rate was significantly lower throughout the range of intensities in the LBG condition than the EUG group (p < 0.001), even in the initial lower intensity swims (1 & 2), which were carried out at a higher relative pace in the LBG condition. The heart rate was significantly higher in the HBG condition (p < 0.001).
 Figure 3: Heart rate vs. swimming time in three conditions, LBG, EUG & HBG. View Figure 3
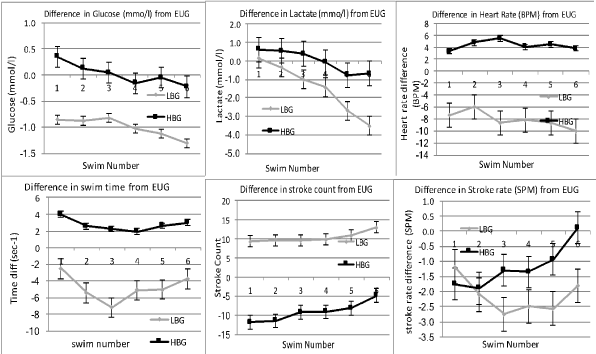
The degrees of change of all parameters in the submaximal swims are shown in (Figure 4) while the difference in response during the maximal swims is shown in (Figure 5).
 Figure 4: Comparative differences between EUG ("0" line) High Blood Glucose and Low Blood Glucose on Time, Lactate, Stroke Count and Stroke Rate, Heart Rate and Glucose. Standard deviation is shown. View Figure 4
 Figure 5: Differences in Max swim responses. Significant difference at P < 0.05 is denoted by X. View Figure 5
Stroke count was significantly lower in the HBG group compared to the EUG group in all swims except during the final maximal effort swim (p < 0.01). Swimmers in the LBG condition however used significantly more strokes per length than either EUG (p < 0.001) and the HBG condition (p < 0.001).
Stroke rate is often used as a marker of intensity in swimming by coaches. At the lower intensities (swims 1-4), both LBG (p < 0.003) and HBG (p < 0.05) conditions were lower than in the EUG condition. The LBG condition also showed stroke rates lower than the HBG swims (p < 0.05). The Stroke rate in the LBG group was similar to the other two groups. At the higher swim speeds in swims 5, 6 & 7, there was no difference in the stroke rates in any condition (p < 0.001).
Although as a relative effort compared to the maximal swim, all swims were not significantly different between all conditions, the combination of differences in the stroke count and stroke rate meant that the actual swim speeds were significantly faster in the HBG group than were seen in the LBG group (p < 0.001). The LBG group was also significantly slower than the EUG group (p < 0.001). The EUG group was not significantly different from the HBG group.
The selected ranges of blood glucose gave 11 profiles in the LBG group (range 3.7- 4.2 mmol/l), 11 profiles in the HBG group (range 6.1-6.4 mmol/l), and 22 profiles in the EUG group (range 4.3-6.0 mmol/l). Previously hypoglycaemia has been suggested to not affect performance in exercise lasting 20 minutes or more [1,13,14]. In this study, which used shorter, more intense, exercise periods, transient hypoglycaemia (range 3.7-4.2 mmol/l) was seen to detrimentally affect the performance markers of stroke rate, stroke count, and swim time. Being in a LBG condition prior to the start of 7-point stepwise trial, that incorporated a range of intensities up to a maximal effort, resulted in lower plasma glucose observations at all intensities. Moreover, there appeared to be an over-estimation of effort at lower intensities around the glucose turn point [15] and an under performance in absolute and relative terms at maximal effort.
In all states, a progressive and significant increase in glucose levels was observed across the 7-point stepwise trial, with the exception of the initial efforts in the HBG group. Plasma glucose in EUG showed a distinct rise in level as the intensity of exercise rose. A similar rise was seen in the LBG profile, although it occurred at a decreasing rate compared to the other two profiles. There was also a definable turn point in the plasma glucose profile that may relate to the change in use of glucose at a cellular level [4,16].
The rise in blood glucose seen in this study is likely due to the effort of the increasingly faster swims throughout the test, creating a rise in catecholamine level [11,17]. Elevated catecholamine appearance associated with intense exercise can create up to a 15-fold increase in blood glucose release, independent of the effect of other hormones. With rates of glucose utilisation showing a 3 to 4-fold increase in similar exercise protocols [12,18], the net rise in blood glucose with increasing intensity of effort was therefore expected.
Our findings are in contrast with previous research observing a drop in plasma glucose at lower intensities [2,6,19], even though there appears to be no convincing evidence that this is always associated with impaired exercise performance [1,3].
Plasma insulin action following carbohydrate ingestion in the hour before exercise can lead to transient hypoglycaemia during subsequent exercise in susceptible individuals [5,20,21]. During exercise at 80% of VO2max, plasma glucose concentration was observed to decrease in the first 5 minutes of exercise, before stabilising above a level considered hypoglycaemic (3.5 mmol/l) [6,7]. Significant differences in plasma glucose concentration and insulin level have been observed immediately prior to exercise but the differences disappeared within ten minutes [2,5].
Pre-exercise hypoglycaemia (LBG) did not stop the initial rise in plasma glucose that was observed in the EUG and HBG conditions. The rise, however, occurred at a slower rate (LBG = 0.13 mmol/l/sec vs. EUG = 2.42 mmol/l/sec vs. HBG = 0.283 mmol/l/sec). Even though the maximal effort times for the EUG and LBG groups were almost the same, all other submaximal swims in the LBG group were slower. The blood glucose level in the LBG group rose at a faster rate between the last two swims (0.145 mmol/l/sec) but was almost 70% slower compared to the EUG group (0.246 mmol/l/sec) and 330% slower than the HBG (0.481 mmol/l/sec). It is worth noting that the LBG group in this study (mean 4.0; range 3.7-4.3 mmol/l) would be considered Euglycaemic by previous authors [4,6,15], who suggested that this level of transient hypoglycaemia would not affect performance.
In the LBG group, blood glucose was significantly lower throughout the range of intensities. There was an initial pulse to raise the plasma glucose level before it also showed a flatter response to the lower effort swims. Heart rate was significantly lower (6-10 bpm; p = 0.000) than EUG and lower again (9-15 bpm; p = 0.000) than HBG. This may represent a reduced efficiency in the circulatory function [22]. This lower heart rate also accompanied a reduction in performance. Reductions in heart rate at a similar relative intensity are generally assumed to represent an improvement in endurance capacity [18] and, combined with the lower lactate values, may lead to over-estimation of aerobic ability and pace due to a skewing of the data set, should the LBG state not be considered.
Stroke rate was significantly different in the LBG to that of both the EUG and HBG groups, being slower by 2-3 strokes per minute per swim. The length of stroke was also significantly shorter in the LBG group than either the EUG or HBG groups in all except the final maximal effort swim. This is likely to indicate a significant loss of stroke efficiency while in the LBG condition [23]. The overall swim times observed in the LBG condition were significantly slower that those seen in both the EUG and HBG groups, although, in the final swim, the LBG and EUG times were within 1/10 sec of each other.
During Insulin induced hypoglycaemia, enhanced tissue extraction of glucose from interstitial spaces by the action of glucose on GLUT-4 carriers occurs in both oxidative and glycolytic fibres. The uptake is, however, greater in oxidative than glycolytic fibres regardless of the level of glycaemic conditions and independent of insulin [2]. At lower effort levels, it can be assumed that a higher proportion of oxidative fibres will be recruited [13,24]. In swimming however, where resistance increases at a much greater rate (proportional to the cube of the velocity), the recruitment of glycolytic fibres may occur at much lower intensities, particularly in less efficient swimmers.
During the final swim, at maximal effort, there was a marked rise in plasma glucose in each group, although the degree of this effect was much larger in the LBG group. This would appear to be a response to the magnitude of effort required in the maximal effort. By reducing the pace that can be held at all intensities of effort up to near maximal, the effect of initial LBG appears to be to reduce swimming efficiency, cardiac efficiency, and in this way to affect the performance outcome.
At transient hypoglycaemic levels, the potential to affect performance outcome in high intensity efforts is much more likely [18,25]. We suggest that, on the basis of our observations in this study, performance in shorter duration higher effort trials may be affected at a blood glucose level previously considered as only transiently hypoglycaemic, and not thought to have this effect.
It may be that, where swimmers exercise regularly in the LBG state, whether due to daily nutritional disruptions or early morning training, when low blood glucose occurred after hyperinsulinemia, it created marked impairment of epinephrine and glucose production and increased peripheral insulin sensitivity may occur [20]. This may compromise training outcome.
The high insulin levels largely block glucose output from the liver. Feeding glucose can therefore bring on a rapid cessation of glucose production from the liver [10]. The practical application of this is that, whilst pre-exercise glucose feeding may be detrimental during longer events (60 seconds to 8 minutes), due to the catecholamine response, it may not be detrimental during high intensity events (10-30 seconds). In HBG group the blood glucose was not significantly different from the EUG at all effort levels. The swimming velocities at which they occurred were always faster by between 2-4 seconds. When compared in relative terms, the HBG blood glucose dropped in relation to the EUG group for the first to the 4th effort and then stabilised before rising at a higher rate that the EUG group on the final maximal effort. As the initial intensities were approximately 80% to 95% of maximal effort, the observation is in line with other authors [1,2,9,10].
Lactate was higher in the HBG state at intensities up to 90% of maximal effort and then dropped below the EUG profile for swims 5 & 6. In the final maximal effort, the lactate level of the HBG rose higher than both the EUG and LBG groups. Heart rate was between 6 and 8 bpm above the EUG group. There was also an increased stroke length and modified stroke rate, which may be considered to be a more efficient stroke. This would be expected to result in improved performance. This was not the case however, as there was no significant difference in blood lactate or swimming time between the HBG and EUG groups. In agreement with studies that looked at longer durations [7,9], a HBG prior to exercise will not benefit or hinder performance at these lower effort levels.
Stroke count for the HBG was approximately 10 strokes per 200 less than in the EUG group for the first 5 swims (lower stroke count is indicative of a longer stroke). Only in the maximal swim did the stroke count rise back toward that of the EUG group, although it remained lower (although not significantly so) than the EUG group. Stroke rate (strokes per minute) for the HBG swimmers was also lower than for the first 5 swims only being higher than the EUG group in the maximal swim. These two parameters are the determinant of speed and efficiency of the stroke. As such the HBG group were significantly more efficient at lower intensities and, although the stroke counts were similar to the EUG group on the maximal swim, the rise in stroke rate led to the increased speeds. It appears that raised blood glucose at lower efforts does not negatively affect performance, and may possibly aid it. Whilst the swimmers in this study completed the 7-point swim test in a 1 hour post-prandial condition, it is possible that inappropriate timing of glucose ingestion in the 15-45 mins prior performance could lead to the LBG we observed in this study.
In conclusion, the level of blood glucose, below which a marked and significant effect on performance can be observed, is much higher than has been suggested by previous researchers. Where previously blood glucose of 3.5 mmol/l was seen as being hypoglycaemic and a point at which the LBG may affect performance, in this study the average blood glucose was 4.0 (± 2.8) and all swimmers in the group showed marked hindrance to performance at a range of intensities from 82% of max to 98% of max. At maximal effort, although there was no significance in the time achieved, the way the performance was achieved was significantly different and marked by a much reduced efficiency of performance. In this study a marginally raised blood glucose level before the test demonstrated the same characteristics shown in previous studies at lower intensities. The significantly faster last swim showed there were benefits to having a higher initial blood glucose up to an hour prior to the test swims. Controlling this level however may be more difficult.
There are no conflicts of interest in the production of this article.