Contrast sensitivity (CS) expresses the quality of human vision. This article presents the main points for the interpretation of CS and what structures of the eye and brain contribute to achieving it. There is still information on the ways and types of CS clinical examination, factors and conditions affecting it, and the latest technological developments in its measurement.
Visual contrast sensitivity, Visual acuity, Magno, Parvo, Pelli-Robson
Visual acuity (V.A.) is the measure of the spatial resolution of the eye (the clarity or sharpness of vision) and its measurement determines the highest spatial frequency or smallest detail that the eye can perceive at high levels of contrast [1,2]. But V.A. is measured on a fixed target (optotype) and it may be the basic assessment of vision but does not fully meet the daily requirements of the human visual function, which comes into contact with a variety of stimuli of varying intensity.
Contrast sensitivity (C.S.) is the ability of the eye to detect small changes in illumination at targets that do not have clearly defined limits [3,4]. Measuring C.S. is just as important as V.A. and is now universally accepted as complementary [1] as it reflects the quality of vision and in many cases declines earlier, while V.A. remains normal (6/6 or better) [4]. C.S. defines the threshold between visible and non-visible, which has both elementary and clinical significance in the science of vision.
From the point of view of physics, most light stimuli can be analyzed in a series of sine waves (Fourier analysis -1822) [5-7]. To compare the performance of optical systems, a commonly used measure is the modulation transfer function (MTF). For example, the MTF of a lens is its ability to transfer contrast at a particular resolution from the object to the image. So MTF is a way to incorporate resolution and contrast into a single specification. As line spacing decreases on a line test target, it is difficult for the lens to transfer this decrease in contrast while MTF decreases. However, MTF does not correspond fully to analyze the contrast of the image created in the human visual system Figure 1 [8].
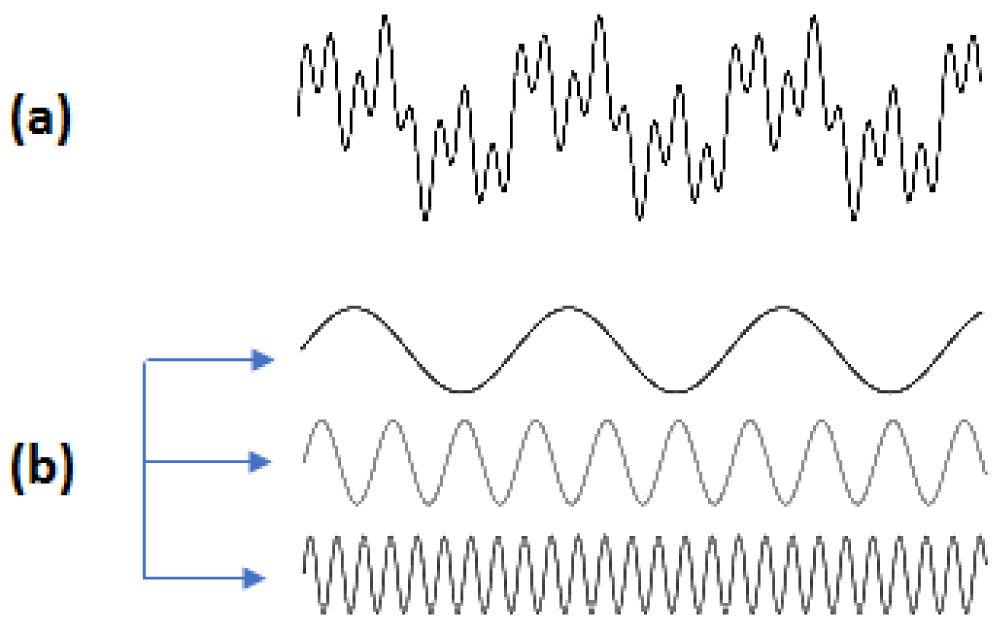 Figure 1: (a) Fourier analysis of a complex wave. (b) This wave can breakdown into three simple sine waves.
View Figure 1
Figure 1: (a) Fourier analysis of a complex wave. (b) This wave can breakdown into three simple sine waves.
View Figure 1
A more complete description of the spatial resolution of the optical system of the eye is given by the curve of the spatial contrast sensitivity function (CSF) [2,9]. The CSF curve describes the size of the object in relation to the spatial frequency (c/deg) of a sine wave [9] and this corresponds to the actual V.A. of the person [2].
Similarly, the graph of the time frequency as a function of pulse light (flashing) is given [2]. The first scientist that calculated the optical contrast sensitivity as a function of spatial frequency was Schade (1956) Figure 2 [10].
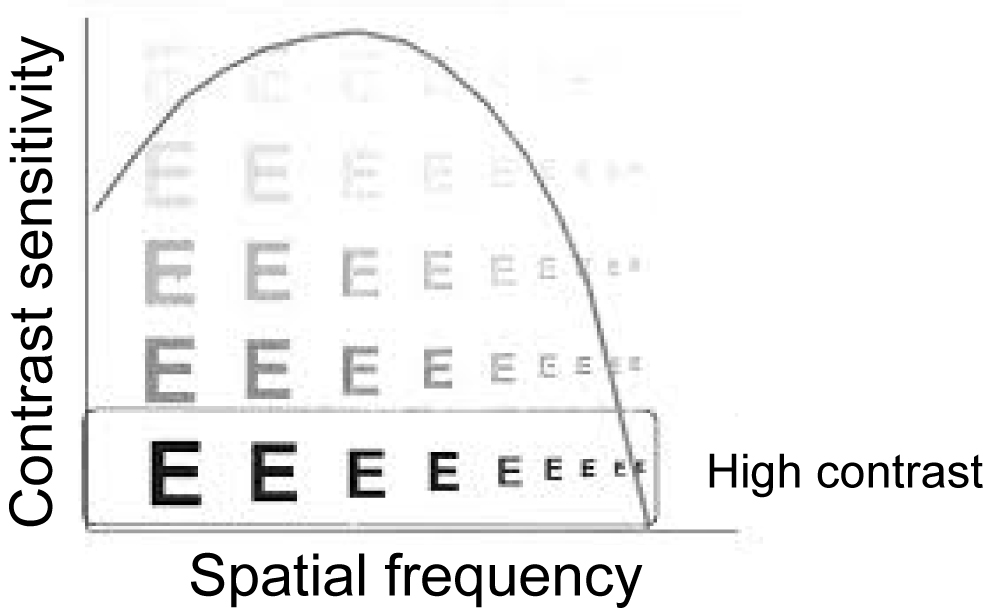 Figure 2: Contrast sensitivity function (CSF) curve.
View Figure 2
Figure 2: Contrast sensitivity function (CSF) curve.
View Figure 2
One of the most important terms for studying CSF is spatial frequency. The number of cycles of an image falling over a certain spatial distance, usually one degree of angle of vision, is the spatial frequency [5]. It is the measure that determines the clarity and gradation of the bright and dark areas. The representation consists of a light and a dark region, for example in a sine wave [5]. The high spatial frequency representation comprises many narrow lines that means, many circles within each degree of angle-cycles per degree (cpd), while at low frequencies the lines widen, so the cycles are less per degree [5]. Spatial frequency can also be set with respect to the observation distance, so as the distance decreases each line increases, so the frequency decreases [5]. The highest spatial frequency of human perception is 30 c/deg and corresponds to approximately V.A. 6/6 Figure 3 [7].
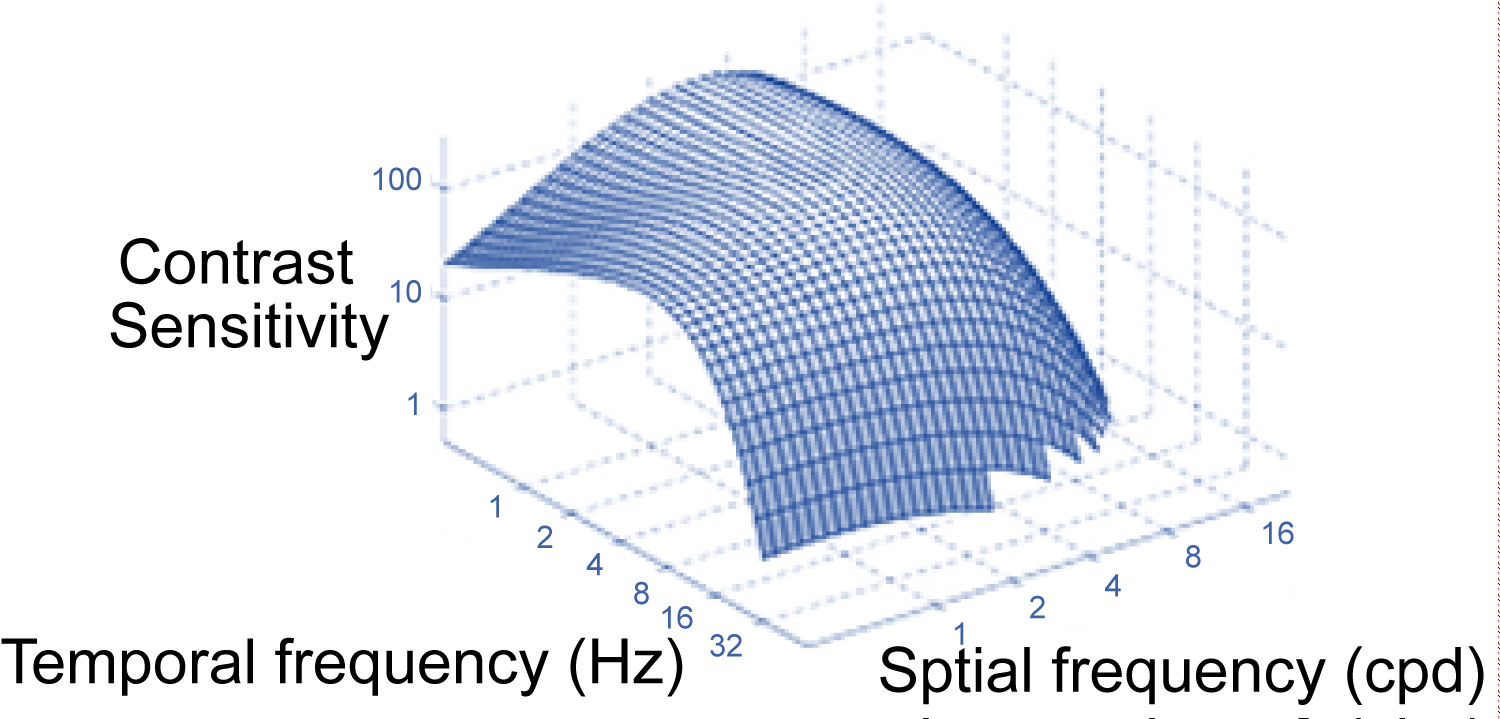 Figure 3: Spatial and temporal frequency combination in CSF.
View Figure 3
Figure 3: Spatial and temporal frequency combination in CSF.
View Figure 3
CS depends on the function, anatomy and distribution of the optic nerve axons. Starting from the region of the retina where the photoreceptors are located, phototransmission converts light energy into electrical signals. dipole cells and ganglion cells. The axons of the ganglion cells form the optic nerve [11]. The main nodal points of electrical signals as they travel to the visual cortex of the brain are photoreceptors (cones and rods), dipoles and ganglion cells. The axons of the ganglion cells form the optic nerve.
The ganglion cells are divided into subgroups according to how they respond to light ((bright light or dark) – (response in the presence or absence of light)) and depending on the area of the lateral geniculate body they end up into two types of cells [11,12] (Magni and Parvi/Large and Small). A third subclass of ganglion cells, which respond to S-cones, has recently been discovered, which percepts blue yellow. P cells make up 90% of the optic nerve and come from most of the macular fovea centralis. They have a small receptive field (excitation field from the photoreceptor region) and respond better to high spatial frequencies and color perception, but with a reduced CS [11,13,14]. The M cells are few in number (10% of the optic nerve) with a large but receptive field and thus have a reduced spatial resolution but have an increased CS [11,13,14]. M and P cells continue their course to lateral geniculate nucleus (LGN). The lower layers pass through the M cells and form the Magnocellular pathway, and the P cells passing through the upper layers of the LGN form the Parvocellular pathway. The M and P paths end up at different points in the primary visual cortex, conveying different information from their beginning. The M path elaborates the motion and depth perception and the P path the perception of colors, shape and shapes Figure 4 [11,13].
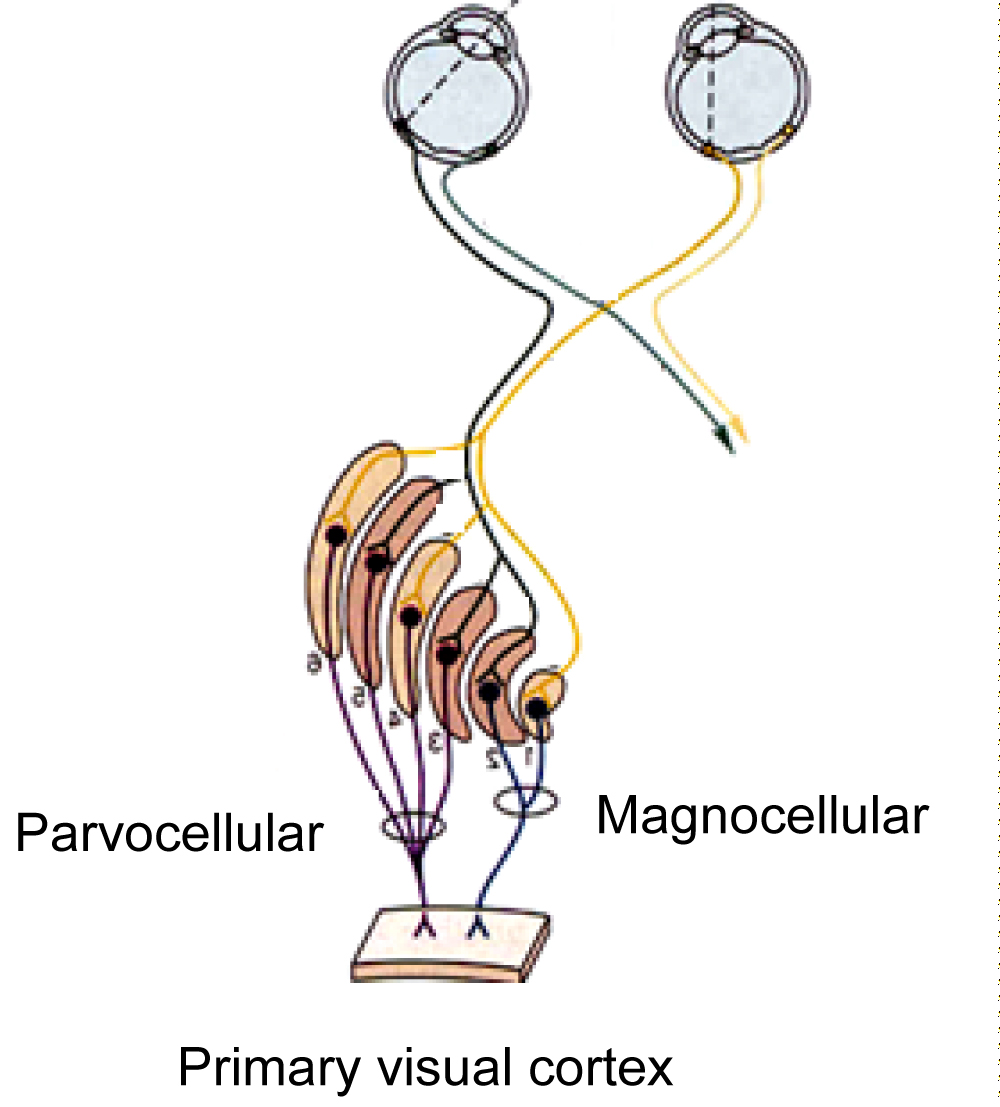 Figure 4: Magnocellular and Parvocellular pathway.
View Figure 4
Figure 4: Magnocellular and Parvocellular pathway.
View Figure 4
Bailey-Lovie: This test, in addition to accurate OO measurement, is also used to evaluate CS. Due to the logarithmic size difference between the letters it comprises and the gaps between them in glare, it is possible to determine the CS of the examinee Measurement of Contrast Sensitivity CS as a term was first mentioned in 1860 (Fechner-Elemente der Psychophysik) and the first test for its measurement was published in 1918 (BJO).
However, the first to make substantial subjective measurement of CS using sinusoidal grating patterns were Green and Campell in 1965 (Journal of Physiology) [1,10]. Furthermore, the Arden grating chart of contrast sensitivity, which consisted of vertical gratings of different spatial frequency, has been used in clinical practice since 1976 [15]. Measurements have since evolved, tests have been upgraded and refined, depending on the problem that needs analysis. The subjective examination of CS depends on the type of options the respondent has to answer. That is, there are free answer tests where the respondent states his or her answers until he or she cannot respond (e.g. Vistech) and forced answer tests where the respondent is forced to choose one of at least two alternative answers (e.g. Cambridge) Figure 5A.
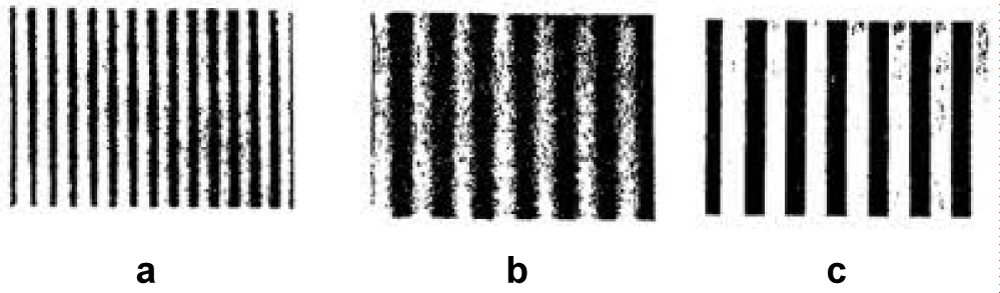 Figure 5a: Arden grating chart of contrast sensitivity.
View Figure 5a
Figure 5a: Arden grating chart of contrast sensitivity.
View Figure 5a
CS measurement tables are divided into two main types, depending on the stimulus, [5] on the grating charts for which the contrast of the targets is given by the Michelson equation:
And letter charts, which the contrast of the targets is given by the Weber equation:
Where Lmax is the maximum illumination of the light areas of the chart, Lmin the minimum illumination of the dark areas, Lbackground the illumination of the background [10,16]. Generally, today there is a variety of different optotypes used for CS testing but the two most widely used are the Vistech and the Pelli-Robson.
The Pelli-Robson chart consists of letters of equal size, in sixteen triples, with a decrease in brightness of 0.15 log units per triple [5,6,17]. The test is set one meter from the person examined and the letter size is 4.9 × 4.9 cm and consists of eight rows of letters [5,6,18]. The Pelli-Robson test is easy to use as it resembles the V.A. measurement that most patients are familiar with, its fast and with good repeatability [6,16]. It is ideal for cataract detection, screening of patients with intraocular lenses and for checking drivers for impaired vision [6]. The patient's CS is determined by the last triplet’s letter in which he or she will be able to read two of them Figure 5b [5].
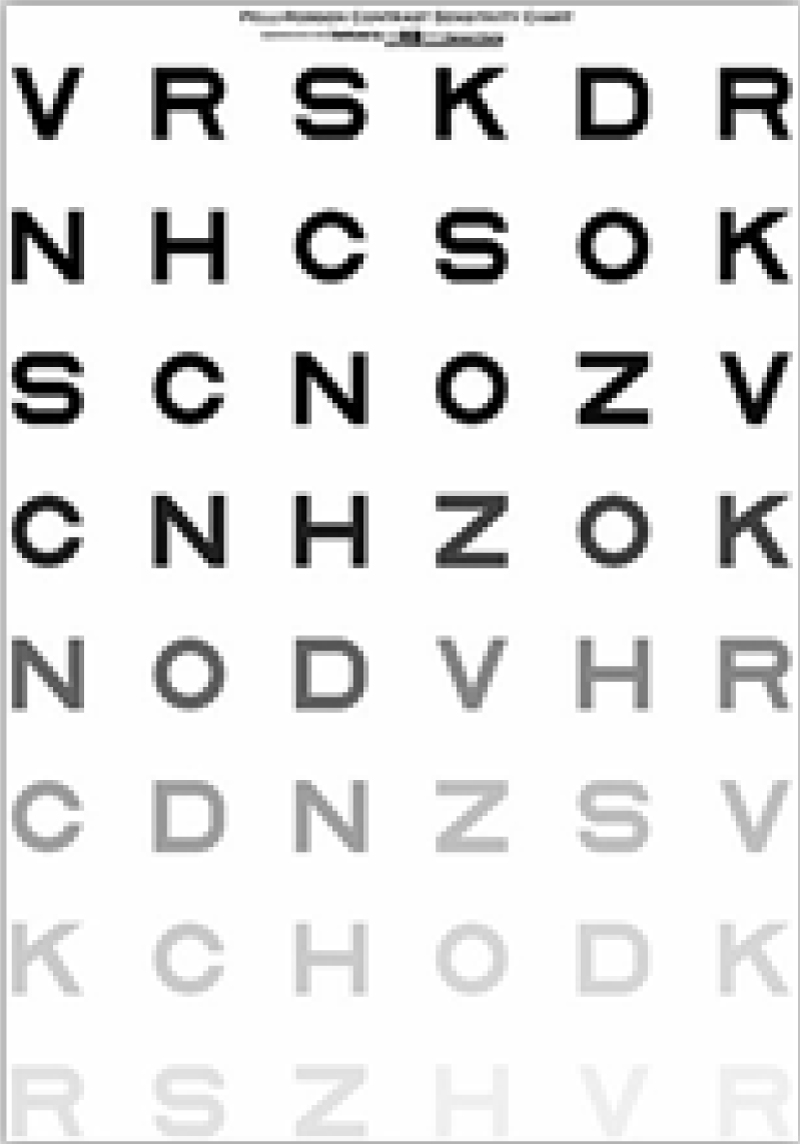 Figure 5b. The Pelli-Robson chart.
View Figure 5b
Figure 5b. The Pelli-Robson chart.
View Figure 5b
Striped or sinusoidal tests consist of bright and dark areas called circles [5]. The most popular is the Vision Contrast Test System (VCTS) or Vistech, which was introduced in the 1980s [19]. It consists of circular gratings in five rows and nine columns, with spatial frequencies of 1.5, 3, 6, 12 and 18 c/deg and the contrast decreases from left to right [18,20]. The circular gratings may be vertical positioned (90°) or inclined 15° counterclockwise or clockwise. It is available in two versions, one for remote and one for close examination. The VCTS 6500 is used for the three-meter long test and is 93 × 68 cm in size and the VCTS 6000 is 40 cm in size 17.5 × 14 cm respectively. Depending on the last correct answer for each test series given by the patient, the CSF curve is constructed Figure 6a [6,10].
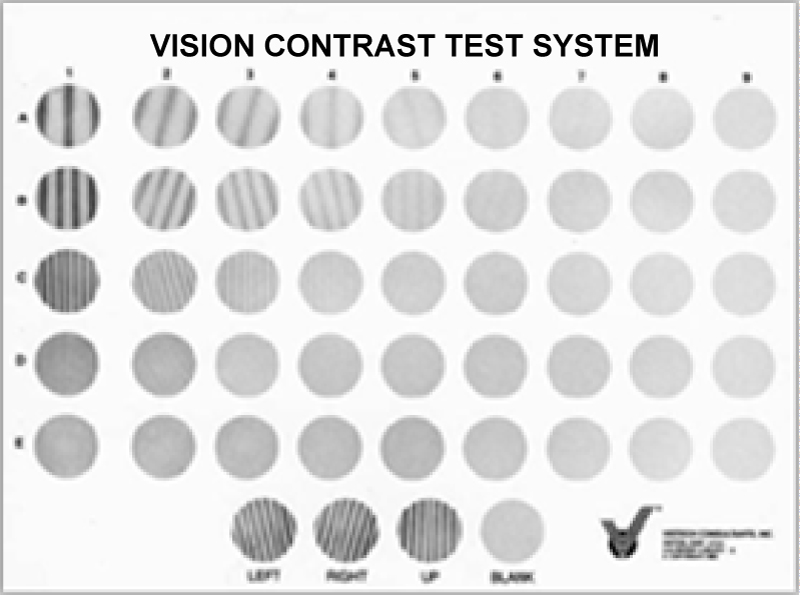 Figure 6a: The VCTS chart.
View Figure 6a
Figure 6a: The VCTS chart.
View Figure 6a
This test, in addition to accurate V.A. measurement, is also used to evaluate CS. Due to the logarithmic size difference between the letters it comprises and the gaps between them in glare, it is possible to determine the CS of the examinee [6,18].
This test is conducted at 6 meters, presenting the subject with a spiral book (28 × 22 cm) with two images of the same average brightness, but only one has a grating pattern. The patient is asked to answer which of the two images has a grating pattern. This test detects only 4 c/deg [6,18].
Functional Acuity Contrast Test- It is almost the same as VCTS and consists of the same number of gratings with the difference in orientation and contrast, but it is conducted at close range (46 cm) [5,8].
It is a letter test, at close range (41-59 cm) and 23 × 36 cm in size, with contrast between 0.04-1.92 log units. The letters, as in Pelli-Robson, are equal in size but their contrast is reduced to 0.04 log units per letter. Usually a close correction of 2 diopters is needed [5,20,21].
It is a CS test conducted on an electronic screen. It presents letters or numbers in the same way as the Pelli-Robson test, which decreases in triplicate. The difference is that it is held within one meter of the subject and may require a correction of approximately + 0.75D [5,20].
As with other eye examinations, in the case of CS, measurements must be made under specific lighting conditions. If this is not done, the test will produce results that are not true. As a general rule, ambient lighting should be within 10-30% of the average brightness of the target [22]. However, each test is different and test conditions should be suggested by the manufacturer/researcher promoting it.
Many conditions (age, myopia, etc.) and eye diseases (diabetes, cataract, glaucoma, etc.) affect CS, just before any change in V.A. is detected. Studies around the world have been conducted by various researchers on CS changes depending on the case and the effect this change has on patients' daily lives. With age, the functions of the body begin to decline and so does CS. Although it has generally not been established by studies in patients with good visual acuity, what exactly neurological changes in age contribute to the loss of CS [23]. The frequencies initially affected are the lowest and begin at approximately after the age of 40 [23].
Although myopia is a refractive error, it is a significant factor in effecting CS of the eye. Several studies show that there is a decrease in CSF in myopia, but the role of refractive error is unclear, as various optical factors, such as eye aberration (spherical aberration, diffusion by the crystalline lens), are inserted [24-26].
The retina and the macula area are affected by several diseases, such as age-related macular degeneration, diabetes, detachment, central serous retinopathy, macular holes, etc. CS appears weakened to a degree regarding the severity of the disease [27-31]. For example, in the case of macular holes, the less tissue missing, the closer the CS is to the normal (but not completely normal) [31]. Nevertheless, CS is definitely affected and usually before V.A. of the patient, in the early stages of the disease (age-related macular degeneration, diabetic retinopathy), causing problems in his quality of the patient life (driving, working etc.) [28,32,33]. In the retinal diseases category, there are also studies with positive CS results. In some situation it is possible to recover part of the lost CS by restoring the tissue, such as retinal detachment, following surgery [29] or in cases of diabetic macular edema resection [7,33].
Cataracts, as they form a blur to the crystalline lens, are one of the most common causes of CS decline, as they block part of the light from reaching the retina. CS changes even in the early stages of the disease [34] mainly at high frequencies, without necessarily affecting the V.A. from such an early stage [35]. Although now successfully treated, many patients live with cataracts for a sufficient period of time until the intraocular lens replace the milky crystalline lens, and therefore with reduced CS [36].
Glaucoma has been described by many optometrists and ophthalmologists as the silent thief of sight. Causes damage to ganglion cells that play a key role in the functioning of the human eye's CS and therefore leads to its reduction [23,37]. And in the case of open angle glaucoma changes in the CS are observed clinically before the V.A. is affected [37] and in some patients before even reducing their field of vision [38].
Optical neuritis, usually due to multiple sclerosis, affects the optic nerve and consequently the ganglion cell axons and the three pathways of transport of stimuli to the brain (M/P cellular and the S cone response group) [12]. Mostly, color perception is affected by optic neuritis rather than CS, especially if the P pathway is affected [12,39,40]. Therefore, the important role of the M pathway in CS is confirmed.
Intraocular lens used either in cataract surgery or in refractive surgery does not reduce CS [35,41]. Especially in the case of cataracts they certainly improve CS postoperatively, and the possible differences that can be observed in CSF measurements are mainly due to their materials [42] and whether they are spherical or aspherical [43].
In refractive surgery (PRK and Lasik) there is a change in CS postoperatively, mainly at medium and high frequencies, even if V.A. reaches 6/6, [44] and when the pupil's diameter is about 7 mm the problem is aggravated by the increasing aberrations [45-47]. The problem is now improved with PRK in combination with mitomycin, thinner flaps and Lasik wave front, but compared to intraocular lenses CS postoperatively is slightly reduced [47-49].
The purpose of orthokeratology is good daytime vision, without any aids such as glasses or contact lenses [50]. The application is successful in low and medium myopia [50]. Specially designed RGP contact lenses are used throughout the night (worn during sleep) to eliminate myopia [50]. The disadvantage of this method is the high order aberrations and the reduction of mesopic CS, thus making night vision particularly difficult [50].
Another factor that affects CS is severe dry eye [51]. In addition to be an unpleasant condition for the patient, in combination with the glare it can reduce the quality of one's vision. The administration of artificial tears usually leads the CS to normal levels [51].
It has been observed in clinical studies that schizophrenia reduces the CS of the sufferer and is associated with deficits in the Magno tract [52]. Studies have shown a decrease in the CS curve, but no direct interaction with M-pathway, and may be due to the medication patients receive [53]. The immune system of HIV patients is malfunctioning, so they are affected by other viruses that the healthy body would have been able to deal with. Ophthalmologically, abnormalities in CS and color vision are often present in HIV patients [54].
New technologies for examining CS are starting to emerge, mainly taking advantage of modern electronic devices. Quick-CSF (Quick CSF) promises complete testing in a matter of minutes (2-5 min) with fully automated means (handled via a tablet) test [55]. Finally using the well-known web browser, Firefox, an innovative CSF Nearby SPARCS test, uses a computer screen and the gray gradations it can perform Figure 6b.
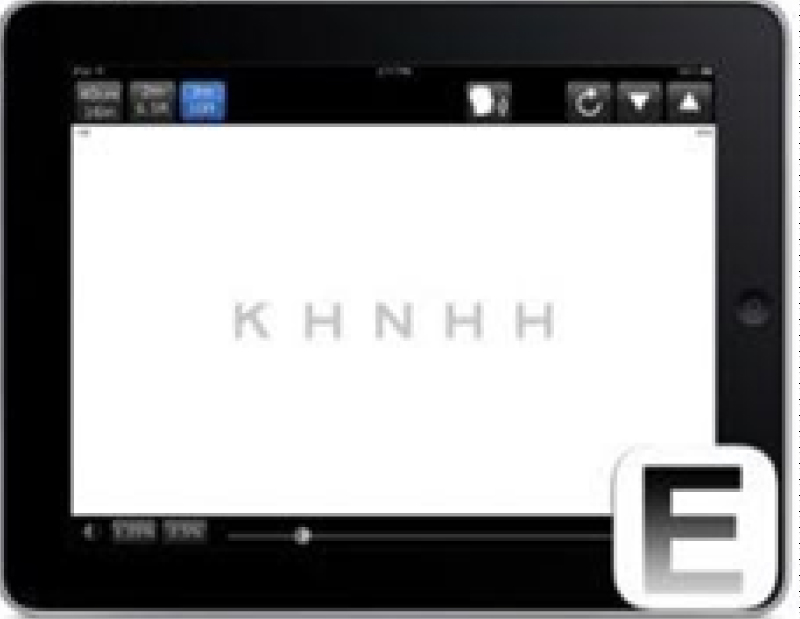 Figure 6b: Test CS at iPad.
View Figure 6b
Figure 6b: Test CS at iPad.
View Figure 6b
Vision is one of the most demanding functions of the human brain. The introduction of visual stimuli into the eye and their path from its anatomical structures to its retinal photoreceptors is a condition that is interdependent on many factors. Subsequently, transferring stimuli from the retina to the occipital lobe but also analyzing and deciphering them is a complicated process involving many parts of the brain.
The case of CS is even more complicated as the roles of the anatomical structures of the optic nerve and the brain that contribute to it have not been fully defined [12]. Each eye is also a separate case, with its own visual aberrations making it even more difficult the study of CS accurately.
Finally, the tests used clinically do not necessarily have consistent results, depending on several factors (eye refractive errors, ambient illumination, age, patient concentration - do not cease to be part of the subjective examination), as well as not all of them current tests perform equally valid in each case (e.g. Vistech does not give accurate results after refractive surgery) [8].
It is certain that studying the function of vision will always remain a pleasant challenge for scientists in the field. Research and the discovery of new methods for understanding the fascinating parts of the human eye and brain, as well as the connection between them, will not stop.