Diabetes Mellitus (DM) remains one of the world's most debilitating diseases. According to the World Health Organization, the prevalence of Diabetes Mellitus in Qatari Adult population is approximately 17%. By 2020, it will contribute to 7% of the total disease burden, and 10% of the mortality in Qatar. The burden of the disease is higher among Qatari National. "Qatari nationality was the strongest risk factor for DM" [1]. Our aim is to try to study the association between key risk factors and the risk of having "Diabetic Status" defined as hemoglobin A1c >= 5.7 among Adult Qatari nationals. In addition, we tried to evaluate the impact of initiatives that encourage the adoption of healthier life style such as the Primary Health Care Corporation's SMART Clinics.
The SMART clinic was firstly established at Al Wakra Health Center in the Southern region of Doha, Qatar. At the clinic individuals were screened for type II DM and depending on the outcome, a specific pathway was designed for them to follow ensuring patients and their families remained on the correct health initiative. A cross-sectional study design was used to study adult Qatari nationals registered at Al Wakra Health center's Smart Clinic using data obtained between (Jan 2015-Jan 2016). The sample chosen was based on inclusion and exclusion criteria. Using scaled hemoglobin A1c readings, participants were categorize into normal, pre-diabetic or diabetic ranges. We examined the association between key risk factors and having "Diabetic Status" using multiple logistic regression, and we estimated odd ratios and 95% confidence intervals. Using a paired sample T-Test we examined the before and after HbA1c mean levels to try to determine the effectiveness of the intervention introduced to pre-diabetic and diabetic participants.
3515 adult Qatari individuals were screened for type II DM. Out of them we chose 1876 subjects who had complete data on key risk variables to be studied. From multiple regression analysis we found that variables namely "Age, BMI, Blood Pressure, Central Obesity, HDL Level, and Cholesterol Level" were associated with a greater risk of having "Diabetic Status" (P < 0.05). Age group (>= 58) (OR = 7.822; 95% CI = 4.287-14.273; P = 0.000) when compared to the reference group (18-27). High Blood pressure (>= 140/90) (OR = 2.176; 95% CI = 1.520-3.177; P = 0.000) when compared to the reference group (BP < 140/90). HDL (< 1.03), OR = 1.917; 95% CI = 1.192-3.085; P = 0.007) when compared to the reference group (HDL > 1.55). Cholesterol level (> 6.2) (OR = 1.966; 95% CI = 1.174-3.293; P = 0.010) when compared to the reference group (<= 6.2). BMI >= 25 (OR = 1.555; 95% CI = 1.045-2.314; P = 0.029) when compared to the reference group (BMI < 25). Central Obesity (Males with waist circumference >= 102 cm, and females with waist circumference >= 88 cm) (OR = 1.370; 95% CI = 1.031-1.819; P = 0.030) when compared to the reference group (males WC < 102 cm, females WC < 88 cm). Variables "Gender, and Triglycerides level" did not have statistically significant association with the outcome "Diabetic Status".
We found a statistically significant difference in the results of HbA1c mean levels among diabetic group before (M = 7.3, SD = 1.3), and after the intervention (M = 6.6, SD = 0.7), t (69) = 3.8, P = 0.000). And, we found statistically significant difference in the mean level of HbA1C levels among pre-diabetic group before (M = 5.9, SD = 0.2), and after the intervention (M = 5.8, SD = 0.4), t (545) = 4.961, P = 0.000).
Trying to understand the relationship between key risk factors and type II DM is essential to inform and design preventive health initiatives targeting high-risk populations.
Diabetes Mellitus (DM) remains one of the world's most debilitating diseases [2]. According to the World Health Organization, the prevalence of type 2 diabetes mellitus in Qatari Adult population is approximately 17% [3]. By 2020, it will contribute to 7% of the total disease burden, and 10% of the mortality in Qatar. Over the last decade, increased labor demand has driven population growth in the State of Qatar resulting in a primarily urban based population of 2.2 million people. Similar to numerous Middle East nations, the Qatari population has shifted the disease burden towards the non-communicable diseases. Urbanization, lifestyle changes (in terms of diet and exercise), and hereditary risks have been identified as contributors to the emergence of these diseases [2]. According to the International Diabetes Federation (2014, np), the burden of the diseases that are related to diabetes is significantly greater in the State of Qatar than in other parts of the world. The World Health Organization currently estimates the prevalence rate of type 2 diabetes mellitus in the entire Qatari population is at approximately 17% [3]. Moreover, the burden of the disease is higher among Qatari National. "Qatari nationality was the strongest risk factor for DM" [1].
Our aim is to examine the change in mean HbA1c level, and BMI level for the Diabetic and pre-diabetic groups measured at the beginning and the end of the intervention provided through the Primary Health Care Corporation's SMART Clinics. The secondary outcome is to calculate the proportion of pre-diabetics who achieved target HbA1c (<= 5.6%) after the intervention. These goals will help us in determining the efficacy of the SMART clinic care approach that uses a multidisciplinary team to improve health outcomes for diabetic and pre-diabetic patients.
In addition, we tried to study the association between key risk factors and of developing "Diabetic Status" defined as hemoglobin A1c >= 5.7 among Adult Qatari nationals.
The SMART clinic was established at Al Wakra Health Center in the Southern Region of Doha, Qatar. The area also have Al Wakra Hospital that provides the necessary secondary care as needed so patients had a complete hub and designated pathway of management. The main objective of the initiative was to screen individuals using glycosylated hemoglobin (HbA1c) levels and plot them against standardized readings that would categorize them into either normal, pre-diabetic or diabetic ranges. The HbA1c ranges were determined based on the American Diabetes Association [4] guidelines. For each outcome there would be a specific pathway to follow ensuring patients and their family remained on the correct health initiative.
A team-based approach and a standardized individual care plan was used to address pre-diabetes and diabetes as well as risk reduction in all those screened. Evidence validates that team-based approach improves patients' diabetic outcomes particularly blood glucose (measured using HbA1c levels), lipid levels and, blood pressure. Team based interventions also increase the proportion of patients who reach target blood glucose, blood pressure, and lipid levels [5].
The team included dietitians, health educators, nurses and physicians who worked in conjunction to guide the patient to achieve healthier outcomes and to lead a healthier lifestyle. Initial phase took implementation in January 2016. The process began with a personalized invitations to patients to screen at their convenience and at their local health center. Dedicated nurses took histories, measurements and ordered HbA1c levels. The patients were then given return appointments with a physician to review the results and discuss outcomes. At the follow up appointments, patients met the physician and he explained the results and set up goal plans. Participants with normal HbA1c levels were referred to dietitians and health educators to ensure that they are on the right track. Individuals with levels indicating Pre-diabetic status were seen by the physicians-whom would order further testing and risk assessment- health educators, and dietitians to work on a devised plan that would ultimately reverse the status toward normal or optimal levels. This group of patients were kept on a tight schedule of follow ups ensuring they have continuous support and care. For patients newly diagnosed as diabetics through the screening program, their physician meeting would address treatment goals alongside health goals set by the health educators and dietitians. Furthermore, a multidisciplinary Team that included a team from Al Wakra Hospital Diabetes unit was set up. This was an open gateway that allowed patients' access to untethered care from both sides (primary and secondary care levels). Moreover, patients with complicated disease or organ dysfunction were easily transferred to secondary care and those stabilized were transferred back into primary care.
3515 adult Qatari individuals were screened for type 2 DM. Out of them we chose 1875 subjects. The sample chosen was based on inclusion criteria that included, age above 18, Qatar nationality, being an active member of Al Wakra Health Center, and having a risk factor such as: Obesity, hyperlipidemia, hypertension, or any other chronic disease. Study population was categorized based on HbA1c level. Out of them 67% (1259) had normal HbA1c level (HbA1c <= 5.6%), 29% (546) were classified as pre-diabetics (HbA1c between 5.7% and 6.4%), and 4% (70) individuals were classified as diabetics (HbA1c >= 6.5%).
A cross-sectional study design was used to study adult Qatari nationals registered at Al Wakra Health center's Smart Clinic. The intervention was implemented from January 2015 to January 2016. We used data obtained through that time. For the primary outcome, HbA1c level and BMI we analyzed the mean (95% CI) differences over time for the same group of participants before and after the intervention using t tests for paired samples.
To determine key risk factors of Type 2 DM in Qatari population, we tried to examine the association between independent variables "Age, Gender, BMI, Blood Pressure, Total Cholesterol, Triglycerides level, HDL level, and Central obesity", and the dependent variable "Diabetic Status" with two outcomes: individuals with diabetic status (classified based on HbA1c level as diabetics and pre-diabetes) and individuals with normal results. Independent variables selection was based on established biological plausibility as well as consistency with existing knowledge and research that identifies a relationship between the independent factors included in this model and type 2 diabetes mellitus. According to Christos PJ, et al. [1] they studied the risk factors for developing diabetes in Qatar and they concluded that Variables such as age, BMI, and metabolic syndrome were in fact significant predictors of type 2 diabetes mellitus. As a result, for our analysis we decided to include all hypothesized independent variables of interest in the model without using bivariate analysis or other techniques to screen the variables for best fit. Liao H & Lynn H [6] mentioned, "the screening of variables using significance testing runs the risk of increased type I errors of the predictors in the multivariable model, and should instead be based on evaluation of background knowledge. In addition, using bivariate associations to select variables for multivariable analysis ignores potential confounding or co-linearity between the independent variables, implying that a non-significant variable in the bivariate analysis can in fact be a significant variable in the multivariable analysis". The data was analyzed using SPSS statistical software.
From Table 1 we can see that of the total people screened, 65.7% were female and 34.3% male. Most individuals are between 38 and 47-years-old (27.9%), followed by the age group (28-37) which represented 25.5%. In terms of risk factors, 79.3% of people screened were obese, and 50.2% have central obesity. Around 9% had high cholesterol level, while 31% had borderline high levels. In addition, 16.9% had low levels of HDL, while 62% had borderline low levels. 22.3% had abnormal triglycerides' levels. Finally, 5% of them had high blood pressure, and 15.3% had borderline high level.
Table 1: Study population demographics and characteristics. View Table 1
The primary outcome is change in mean HbA1c level, and BMI level for the Diabetic and pre-diabetic groups measured at the beginning and the end of the intervention. The statistical comparison will be based on a paired sample T-Test. The secondary outcome is the proportion of pre-diabetics who achieved target HbA1c (<= 5.6%) after the intervention.
We found a statistically significant difference in the results of HbA1c mean levels among diabetic group before (M = 7.3, SD = 1.3), and after the intervention (M = 6.6, SD = 0.7), t (69) = 3.8, P = 0.000).
After comparing the mean BMI before and after the intervention we found statistically significant difference in the results of BMI mean levels among diabetic group before (M = 34.5, SD = 6.6), and after the intervention (M = 33.5, SD = 6.9), t (69) = 3.725, P = 0.000 (Graph 1 and Graph 2).
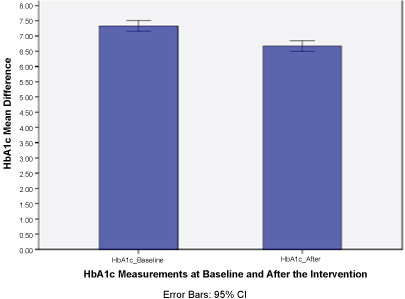 Graph 1: HbA1c mean difference before and after the intervention for diabetics.
View Graph 1
Graph 1: HbA1c mean difference before and after the intervention for diabetics.
View Graph 1
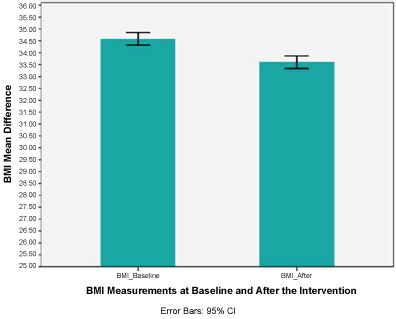 Graph 2: BMI mean difference before and after the intervention for diabetic.
The above graphs show the difference in the HbA1c mean levels before and after the intervention with standard deviation error bars.
We can see that the mean scores are lower after the intervention and there is no overlap, which means that the difference is statistically significant.
View Graph 2
| Primary outcome | Participants n | Baseline outcome | Follow-up outcome | Mean Difference (95% CI) | P (value) |
| HbA1c (%) | 70 | 7.3 | 6.6 | -0.6580 (0.3105-1.0055) | 0.000 |
| BMI (kg/m2) | 70 | 34.5 | 33.5 | -0.9851 (0.4575-1.5128) | 0.000 |
We found a statistically significant difference in the results of HbA1c levels for pre-diabetic group before (M = 5.9, SD = 0.2), and after the Intervention (M = 5.8, SD = 0.4), t (545) = 4.961, P = 0.000 (Graph 3).
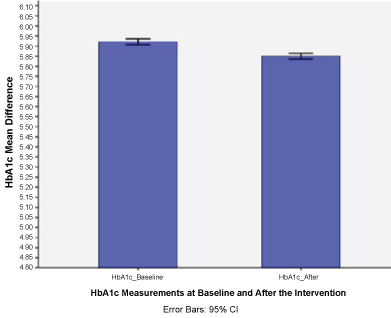 Graph 3: HbA1c mean difference before and after the intervention for pre-diabetics.
View Graph 3
Graph 3: HbA1c mean difference before and after the intervention for pre-diabetics.
View Graph 3
And, we found a statistically significant difference in the results of BMI mean levels among pre-diabetic group before (M = 32.5, SD = 6.8), and after the intervention (M = 31.9, SD = 6.5), t (534) = 4.961, P = 0.000, (Graph 4).
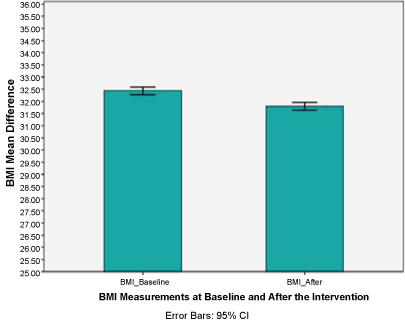 Graph 4: BMI mean difference before and after the intervention for pre-diabetics.
The above graphs show the difference in the HbA1c mean levels before and after the intervention with standard deviation error bars. We can see that the mean scores are lower after the intervention and there is no overlap, which means that the difference is statistically significant.
View Graph 4
| Primary outcome | Participants n | Baseline outcome | Follow-up outcome | Mean Difference (95% CI) | P (value) |
| HbA1c (%) | 546 | 5.92 | 5.85 | -0.0709 (0.0428-0.0989) | 0.000 |
| BMI (kg/m2) | 535 | 32.49 | 31.86 | -0.6353 (0.3175-0.9532) | 0.000 |
To assess the secondary outcome, we looked at the proportion of Pre-diabetics that were able to achieve target HbA1c level (<= 5.6). Around 26% (142) out of 548 participants who were classified as pre-diabetics (HbA1c >= 5.7) at baseline were able to move to the normal HbA1c range. However, 5% (28) of Pre-Diabetic participants moved to the Diabetic range, Graph 5.
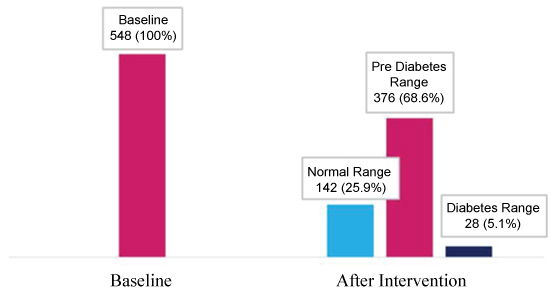 Graph 5: Comparing proportions of individuals based on HbA1c range.
*2 data points were missing from the followup (after the intervention) measurements.
View Graph 5
Based on the multiple regression analysis (Table 2), we can see that significant predictors of developing "Diabetic Status: Pre-diabetes and diabetes" are: Age, BMI, Blood Pressure, HDL Level, Central Obesity measured by Waist Circumference, and Cholesterol Level". (Significance level was set at P <= 0.05) "Gender, and Triglycerides level" did not have statistically significant association with the outcome "Diabetic Status".
Table 2: Coefficient score, p value (sig) and odd ratios of variables in the Multiple Regression model. View Table 2
Individuals in the age group (18-27) was used as the reference category. Individuals in the age group (>= 58) had the highest odds (7.82 times more likely) to develop "Diabetic Status" when compared to the reference group (18-27) (OR = 7.815; 95% CI = 4.293-14.226; P = 0.000). Followed by individuals in the age group (48-57) (OR = 5.066; 95% CI = 3.030-8.469; P = 0.000). The age group (38-47) were 1.65 times more likely to develop "Diabetic Status" when compared to the reference group (18-27) (OR = 1.653; 95% CI = 0 .996-2.743; P = 0.05). No significant relationship was found between the age group (28-37) and the outcome.
Individuals with high Blood pressure (>= 140/90) were 2.17 times more likely to develop "Diabetic Status" when compared to the reference group (BP < 140/90), (OR = 2.165; 95% CI = 1.512-3.100; P = 0.000).
Individuals with Intermediate HDL (1.03-1.55) were 1.9 times more likely to develop "Diabetic Status" when compared to the reference group with optimal level (HDL > 1.55), (OR = 1.991; 95% CI = 1.385-2.862; P = 0.000). Individuals with Abnormal HDL (< 1.03) had very similar odds. They were about 1.9 times more likely to develop "Diabetic Status" when compared to the reference group (HDL > 1.55), (OR = 1.935; 95% CI = 1.203-3.112; P = 0.006).
Individuals with Cholesterol level (> 6.2) were 1.93 times more likely to develop "Diabetic Status" when compared to the reference group (<= 6.2), (OR = 1.931; 95% CI = 1.208-3.087; P = 0.006).
Individuals with BMI >= 25 were 1.53 times more likely to develop "Diabetic Status" when compared to the reference group (BMI < 25), (OR = 1.532; 95% CI = 1.031-2.275; P = 0.035).
Males with waist circumference >= 102 cm, and females with waist circumference >= 88 cm tend to be 1.37 times more likely to develop "Diabetic Status" when compared to the reference group (males WC < 102 cm, females WC < 88 cm), (OR = 1.368; 95% CI = 1.030-1.817; p = 0.031).
The primary Health Care Corporation adopted the "SMART Clinic" intervention. The intervention is based on using a multidisciplinary team to guide patients through managing their blood glucose level. Each team includes the patient, the patient's primary health care provider and one or more other health professionals.
According to Ackroyd S & Wexler D [7] diabetic patients that receive team-based care tend to have better outcomes. They have better glycemic control, and cardiovascular outcomes. In addition, studies demonstrated that patients enrolled in multidisciplinary-based care that includes a diabetes specialist, a nurse and a dietitian had a higher percent of "home self-monitoring of blood glucose testing, and enhanced pharmacological and nutritional management".
In addition, a systematic review of 35 studies concluded that when compared to regular care, team based approach improves participants' blood glucose (measured using HbA1c level), blood pressure, and lipid levels. Moreover, the proportion of patients who achieved target blood glucose, blood pressure, and lipid levels increased after the program [5].
Our aim is to try to identify groups among adult Qatari nationals with higher risk for developing "diabetic status" defined as hemoglobin HbA1c >= 5.7. Our analysis shows that Age, BMI, Blood Pressure, HDL Level, Central Obesity measured by waist circumference, and Cholesterol Level are significant predictors of developing "Diabetic Status: pre-diabetes and diabetes". Our findings are consistent with the trends of type 2 DM established by similar research in Qatar and MENA region in general. Christos PJ, et al. [1] concluded that the key risk factors for the developing type 2 DM in Qatar are demographic and lifestyle factors driven by the rapid socio-demographic and economic change that happened in Qatar.
However, no significant relationship was found between gender or triglycerides levels and our outcome "Diabetic Status". Studies in the region have found "direct effect of triglyceride levels on diabetes status" [8]. This could be explained by the fact that in our sample 77.25 had normal levels of triglycerides.
Our results also shows that adopting this approach contributed to improvements in clinical outcomes mainly HbA1c level and BMI for diabetic and prediabetes patients. Both measurements were slightly improved in both groups. This could be due to the small sample of the "diabetic" group. For the "pre-diabetic" group, although we had a large sample, yet we didn't control for comorbidities that might affect the participants glycemic control. The "presence of comorbidity in type 2 diabetes patients affected the long-term course of HbA1c, specific types of comorbid disease had a negative influence on long-term diabetes control parameters in primary care cohort" [9].
This study has limitations such as incomplete data (Missing values) of some important variables, absence of smoking status data, family history of type 2 DM or metabolic syndrome. According to Bener A, et al. [10], "family history of Metabolic Syndrome among parents, maternal aunt, maternal grandfather, and consanguineous marriages among patients of Metabolic Syndrome are significantly associated with the development of T2DM in Qatar".
In conclusion, our results suggest that a multidisciplinary team approach can be beneficial in primary care settings with all of the above mentioned factors taken into consideration.