

International Archives of Addiction Research and Medicine
Clustering Alcohol Use Behavior: State Socioeconomic Conditions, Alcohol Policy and Individual Regular Alcohol Use in the US
Tulshi D Saha*, Roger Pickering, Bridget F Grant
Laboratory of Epidemiology and Biometry, National Institute on Alcohol Abuse and Alcoholism, National Institutes of Health, USA
*Corresponding author:
Tulshi D Saha, Laboratory of Epidemiology and Biometry, Room 3083, Division of Intramural Clinical and Biological Research, National Institute on Alcohol Abuse and Alcoholism, National Institutes of Health, M.S. 9304, 5635 Fishers Lane, Bethesda, MD 20892-9304, USA, Tel: 301-443-0017, Email: sahatd@mail.nih.gov
Int Arch Addict Res Med, IAARM-2-014, (Volume 2, Issue 1), Original Article; ISSN: 2474-3631
Received: December 27, 2015 | Accepted: February 25, 2016 | Published: February 29, 2016
Citation: Saha TD, Pickering R, Grant BF (2016) Clustering Alcohol Use Behavior: State Socioeconomic Conditions, Alcohol Policy and Individual Regular Alcohol Use in the US. Int Arch Addict Res Med 2:014. 10.23937/2474-3631/1510014
Copyright: © 2016 Saha TD, et al. This is an open-access article distributed under the terms of the Creative Commons Attribution License, which permits unrestricted use, distribution, and reproduction in any medium, provided the original author and source are credited.
Abstract
This multilevel study examined whether state-level variations existed in the prevalence of regular alcohol use in the US after controlling for individual characteristics, evaluating the contribution of both individual socio-economic status, and state economic and alcohol policy in explaining alcohol use behavior using data from the 2001-2002 National Epidemiologic Survey on Alcohol and Related Conditions and data from the U.S. Census and National Institute of Alcohol Abuse and Alcoholism State Policy System.
When controlled for individual-level variables, state poverty level, Sunday alcohol sales, states with higher per capita ethanol sales were associated with individual alcohol use. Over and above the individual characteristics, state-level predictors explained a considerable proportion of state variance and had an impact on individuals' propensities to use alcohol regularly. This implies that both individual characteristics and state conditions were independently associated with alcohol use behavior.
Our results showed that state socio-economic conditions and state alcohol policy were as important as individual-level characteristics in explaining alcohol use in the U.S. Policies aimed at reducing alcohol use may be more effective if they address both situational and individual factors.
Keywords
Regular alcohol use, State, Clustering, Multilevel
Introduction
Contextual variables are important determinants of health even after accounting for differences in individual-level characteristics [1-3]. However, research into the determinants of health has often focused on individuals, ignoring social context.
In most developed nations, higher individual-level socioeconomic position is associated with increased rates of drinking [4] In addition to individual-level socioeconomic status, there is growing consensus that area-level socioeconomic disadvantages may also play an important role in alcohol consumption [5] including increased prevalence of drinking during recessions. An increase of 5 percentage points in the unemployment rate induced an 8 % increase in binge drinking [6]. There has also been increasing attention to the ways neighborhood environments may influence alcohol consumption and alcohol-related health problems [7]. A large body of literature shows that alcohol availability is positively related to consumption. Alcohol consumption is influenced by the cultural context of drinking and the level of integration of alcohol in the society [8]. Ecological studies find alcohol-related outcomes occurring disproportionately in neighborhoods with high alcohol outlet density. However, it appears that an effect of outlet densities on alcohol-related outcomes operates through effects at the neighborhood rather than the individual level [9].
Cumulative and compelling evidence suggests that alcohol-related harm can be substantially reduced through public health-oriented alcohol policies. Evidence of effectiveness is strongest for measures that regulate the availability of alcoholic beverages, including pricing/taxation and restrictions on sales. Such measures have the potential to affect both consumption levels and drinking behavior [10]. Increased alcohol taxes, and therefore increased price, can reduce the demand for alcohol. Moreover, specific deterrence laws, including those concerning blood alcohol content (BAC) and the National Minimum Drinking Age Act, have been created to reduce traffic fatalities caused by driving under the influence (DUI) [7]. Stringent alcohol-related laws that are strictly enforced can reduce alcohol consumption at the individual level. Cross-sectional variation in beer taxes or prices is negatively related to teen alcohol use; therefore, tax increases would generate substantial reductions in teen drinking [11-13]. In a national sample, higher state beer tax was significantly associated with lower prevalence of alcohol dependence symptoms among both men and women [14]. However, this study found that state income inequality does not increase the prevalence of alcohol dependence or dependence symptoms.
Though a few studies took into account the dependence of alcohol use behavior on neighborhood context, these studies neglected to determine whether variations exist between contexts, and whether context should be considered in seeking to understand variation of individual alcohol use behavior. The development of multilevel modeling techniques has created a mechanism for measuring associations of contextual factors on health outcomes, while providing a robust method of analyzing hierarchical clustered data [15]. Over the past few years, interest in the use of multilevel analysis to investigate public health problems has grown [16]. To date, few studies of nationally representative U.S. samples have used state-level information to address relationships of state policy and economic conditions to alcohol use behavior.
There are large state to state differences in important social, economic and health indicators. Importantly, states have primary legal responsibility for regulating the sale and consumption of alcoholic beverages as provided by the 21st Amendment to the U.S. Constitution [17]. Many states regulate the number of different types of alcoholic beverage licenses according to factors including community population sizes.
The purpose of this study was to examine state clustering and associations of both individual and state characteristics with variability of alcohol use behavior in a multilevel modeling framework. The specific analytic goals were: (i) to examine variations in prevalences of regular alcohol use in the United States; (ii) to determine whether state variation is explained by individual characteristics; (iii) to examine whether state-level socioeconomic environment and state alcohol policies were associated with individual alcohol use behavior, after controlling for the characteristics of individual residents; and (iv) to explore whether state-level variations in alcohol use behavior diverged from what would be expected on the basis of individual characteristics and state socioeconomic and policy environments, and examine states in which alcohol use prevalences deviated from expectation.
Materials and Methods
Data
The 2001-2002 National Epidemiologic Survey on Alcohol and Related Conditions (NESARC) is a representative sample of the USA, conducted by National Institute of Alcohol Abuse and Alcoholism (NIAAA), as described elsewhere [18,19]. The NESARC's target population was the civilian non-institutionalized population residing in households and group quarters, 18 years and older. Face-to-face interviews were conducted with 43,093 respondents, with a response rate of 81%. Blacks, Hispanics and young adults (aged 18-24 years) were oversampled, with data adjusted for oversampling and household- and person-level non-response. These analyses were based on past year regular alcohol use status among current drinkers (26,946 respondents) nested within 50 states and DC. US State level data were obtained from the U.S. Bureau of Census and the NIAAA Alcohol Policy Project.
Response Variable
The response variable was "regular alcohol use status" based on a single question in the NESARC: "During the last 12 months, did you have a total of at least 12 drinks of any kind of alcohol?" Responses to this question were coded 1 = yes, 0 = no.
Independent Variables
At the individual level, we included key socio-demographic (age, gender, and race or ethnicity) and socioeconomic (education and income) variables. Age was centered to the grand mean. Four dummy variables were created to describe race/ethnicity, with non-Hispanic whites constituting the referent group. Educational status was dichotomized as less than high school vs. high school or more. Family income was categorized as lower and higher than median income.
Five state-level variables were included - three describing socioeconomic status and two describing specific alcohol policies. We used the percentage of the population living below the federal poverty line from the 2000 census as a measure of state's economic position. The poverty rate seems to be a robust correlate across diseases and geographic locations and carries potential policy implications [20]. It is argued that unequal societies could have adverse consequences for individual health and postulated to be an impact of a society's income distribution on individuals' health [21]. Other indicators of state economic conditions were the percentage of the population without health insurance, obtained from the U.S. Census Bureau's Current Population Survey [22] Average (over 1991-2000) state-level per-capita ethanol consumption was included from alcohol sales data. These variables were centered to their grand means.
Two state-level policy variables, bans on off-premises Sunday sales and insurers' liability for losses due to intoxication, were obtained from the NIAAA-sponsored Alcohol Policy Project. Most states place limits on the days and times when alcohol may be sold, restrictions varying widely across jurisdiction. The "bans on Sunday alcohol sales" variable was dichotomized (1 = Ban on Sunday, 0 = No). In 1950, the National Association of Insurance Commissioners (NAIC) developed a model law entitled the Uniform Accident and Sickness Policy Provision Law (UPPL) under which the insurer is not liable for losses sustained as consequences of the insured being intoxicated or under the influence of any narcotic unless administered on the advice of a physician. Most state statutes and regulations that either permit or prohibit this exclusion apply to health insurance. Laws in some jurisdictions also apply to accident, long-term care, disability, and/or life insurance. The ‘denial of insurance liability law' variable was also dichotomized (1 = prohibited, 0 = permitted).
Statistical Analysis
Multilevel logistic regression models were fit to estimate associations of the individual-level sociodemographic characteristics and state-level (contextual) socioeconomic and policy characteristics with alcohol consumption behavior. The basic model we used in this study was the two-level random intercept model in the following form:
where pij is the probability of regular alcohol use for the ith individual in the jth state. The xs are individual-level explanatory variables, and the ss are state-level explanatory variables. β0 is the overall mean probability of regular alcohol use. β1 ... βq denote a set of fixed effects associated with the q explanatory variables (the xs and ss). The random effect eij and μoj are assumed to have a mean of 0, to be mutually independent, and to have variances var(eij) = σe2 and var(μoj) = σμ2. The random effects μ0j can be regarded as shrunken residual1 at the state level, or state effects that are left unexplained by independent predictor variables. The level one residual eij is constant across the state. In this model, the intercept β0 + μoj vary across states but the effects of xs and ss are the same (fixed) for each state [23,24].
1Shrunken residual is calculated by weighting the raw residual with reliability factor.
μ0j = a shrinkage factor x raw residual for state j
μ0j = [σμ2/( σμ2 + σe2/nj)] r+j
where nj = number of respondent in state j and r+j = raw residual
To assess the degree of state level clustering in the outcome variable, the intra-class (or intra-state) correlation was estimated using the following formula:
ISC = σμ2/( σμ2 + σe2 )
where σμ2 denotes state-level variance and σe2 denotes individual-level variance, with this latter variance set to π2/3 (variance of the standard logistic distribution) [24]. Although the ISC is only a function of the state level variance and does not directly depend on the prevalence of the outcome, this correlation can be interpreted in two ways: (i) it quantifies the degree to which individual alcohol use behavior is clustered within states, and (ii) it is also the proportion of the total unexplained variance of the outcome that is between states [24,25].
We also used the MOR (Median odds ratio) which measures state variance on odds ratio (OR) scale [26]. If the MOR is equal to 1 (no state level variance), there is no difference between the states regarding alcohol use. Conversely, the higher the MOR, the more important the state effects for understanding the individual probability of alcohol use. The MOR is statistically independent of the prevalence of the phenomenon and can easily be computed in the null model as well as in more elaborate models using the formula:
MOR = exp [√(2σμ2) 0.6745], where σμ2 is state-level variance and 0.6745 is the 75th percentile of the standard normal distribution with mean zero and variance one.
This analysis employed a sequential approach for model building. We first estimated a ‘‘null'' or base model (model 1), which only included a random intercept and allowed us to detect the existence of a possible contextual dimension. This null or empty model also provided the basis for further comparison of the state variations. We used the state-level variance σμ2, MOR as well as the ISC to measure these state variations.
To investigate whether state variability resulted from individual level factors, we next examined whether the state-level variance σμ2 decreased when individual variables were introduced into the model (model 2). Finally we added the state variables (model 3) to investigate whether this contextual phenomenon reflected specific state characteristics and whether state variations remained statistically different from zero in this final model.
Parameters were estimated using the iterative generalized least squares (IGLS) and 2nd order penalized quasi-likelihood (PQL) using MLwiN version 2.29 [27].
Results
Among current drinkers, 48 percent were regular drinkers who drank at least 12 alcoholic drinks in the preceding year (13,012 out of 20,836).
Fixed effects
Table 1 summarizes the results of the multilevel logistic models for regular alcohol drinking status in the US. Converting the logit estimates from the null model (first model), we found that prevalence of alcohol use was 52% (95% predicted interval2 was 33% to 70%) across all US states. The reference group in model 2 (containing individual level variables) was around 46 year-old, white, female, with the less than high school education and less than $35,000 family income. For this group, the prevalence of alcohol use was 31% (95% predicted interval 17% to 50%). Results for both models (one with individual factors; the other with individual plus state factors) showed that age is linearly and negatively associated with alcohol use. Significant sex differences were observed, with men more likely to be drinkers than women. A statistically significant association was observed with race/ethnicity, the probability of regular drinking for non-white groups significantly lower than for non-Hispanic whites. In addition, respondents with higher levels of education were about twice as likely (OR = 1.99; CI = 1.84 - 2.16) to be regular drinkers as respondents who had not finished high school. Family income was not significantly associated with alcohol use.
![]()
Table 1: Results of the multilevel logistic models for current regular drinking status in the United States (N = 26,946)
View Table 1
2The formula for 95% predicted interval [28]: α ± 1.96 √σμ2 where α is the logit parameter and σμ2 is state variance. Logits can also be converted to proportion by the following formula: exp (logit)/[1 + exp (logit)].
The final model assessed associations of state socioeconomic and policy variables on individuals' alcohol use behavior. Inclusion of state-level variables had little impact on parameter estimates for the individual-level variables (Table 1). State economic condition (percentage of population below poverty) was negatively associated with alcohol use (Table 1). Percentage of population without health insurance was not related to alcohol use behavior. As expected, propensity toward individual regular alcohol use was significantly higher in states with higher aggregate consumption. Residents of states with Sunday alcohol sales bans were less likely to consume alcohol regularly than respondents living in states where Sunday alcohol sales are permitted (OR = 0.83, CI = 0.70 - 0.99). State laws concerning insurer liability for health and sickness losses due to intoxication were not associated with alcohol use behavior.
Random effects
The bottom of Table 1 presents state-level random effects, measured indirectly from their variances. The null model (model 1) that took account of the state clustering revealed significant variation in alcohol use (σμ2 = 0.158) between states. Controlling for individual age, sex, race, education and income did not eliminate state clustering in alcohol use (Table 1, model 2). However, adding state socio-economic and policy variables (model 3) decreased the state-level variance by more than 60 percentage points. The relative contribution of individual- and state-level variables to the explanation for state-level variance of alcohol use (comparison of full model with null model) was 63% ([0.158-0.059]/0.158 × 100).
The median odds ratio (MOR) in models 1 and 2 in Table 1 suggests that a respondent might increase his or her propensity to regularly drink alcohol by about 47% (MOR = 1.47) by moving to a state with a higher rate of alcohol use. The intra-state correlation (ISC) in alcohol use was 0.05 in models 1 and 2. The MOR was reduced to 1.26 and ISC to 0.02 when state-level characteristics were included in the model, indicating a sizable reduction in the proportion of unexplained between-state variance of current alcohol use accounted for by state-level predictor variables. Nevertheless, although the (unexplained) state-level variance was reduced when state-level variables were included in the model, the remaining state-level variance still differed significantly from zero.
Clustering effect: Analysis of residuals
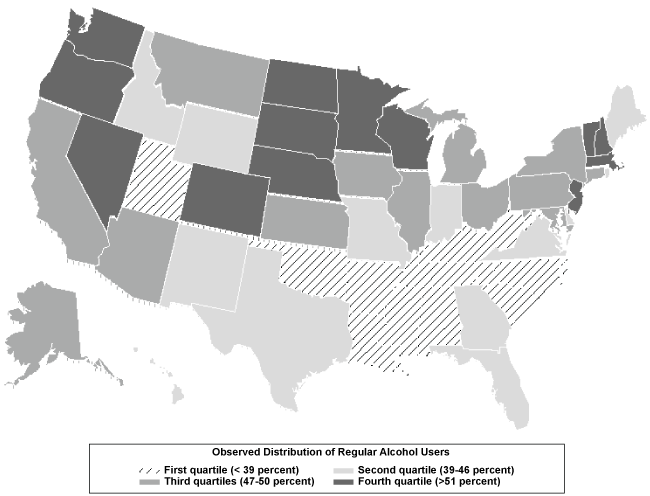
The state-level residuals can provide a very useful conduit for discussion with policy makers. Residuals represent departures of each state from average alcohol use, predicted by the fixed part of the multilevel model. Before we performed the residual analysis, we examined the crude distribution of alcohol use behavior in the US from NESARC sample. Figure 1 maps3 the observed (crude) percentage distribution of alcohol users (individuals who drank at least 12 drinks in the past year) by state, showing notable concentrations of low alcohol use in the Southern region (Bible belt states) and high alcohol use in West and Midwest states.
3All maps depicted in this paper were made using Proc gmap procedure in SAS software.
We next examined states with significantly higher or lower rates of regular alcohol use after individual characteristics and state socioeconomic and policy variables had been accounted for. For the purpose of this analysis, a state-level residual which was positive had higher levels of reported alcohol use than was predicted by the multilevel model, i.e. a "high-prevalence" state. Conversely, a negative state-level residual indicated lower levels of reported regular alcohol use than expected, i.e., a "low-prevalence" state. The estimated state effect was regarded as significant if the coefficients differed from zero for more than 1.96 times of its standard deviation (approximate simultaneous 95% confidence interval). Any residual that was not significant included zero in their simultaneous 95% confidence intervals.
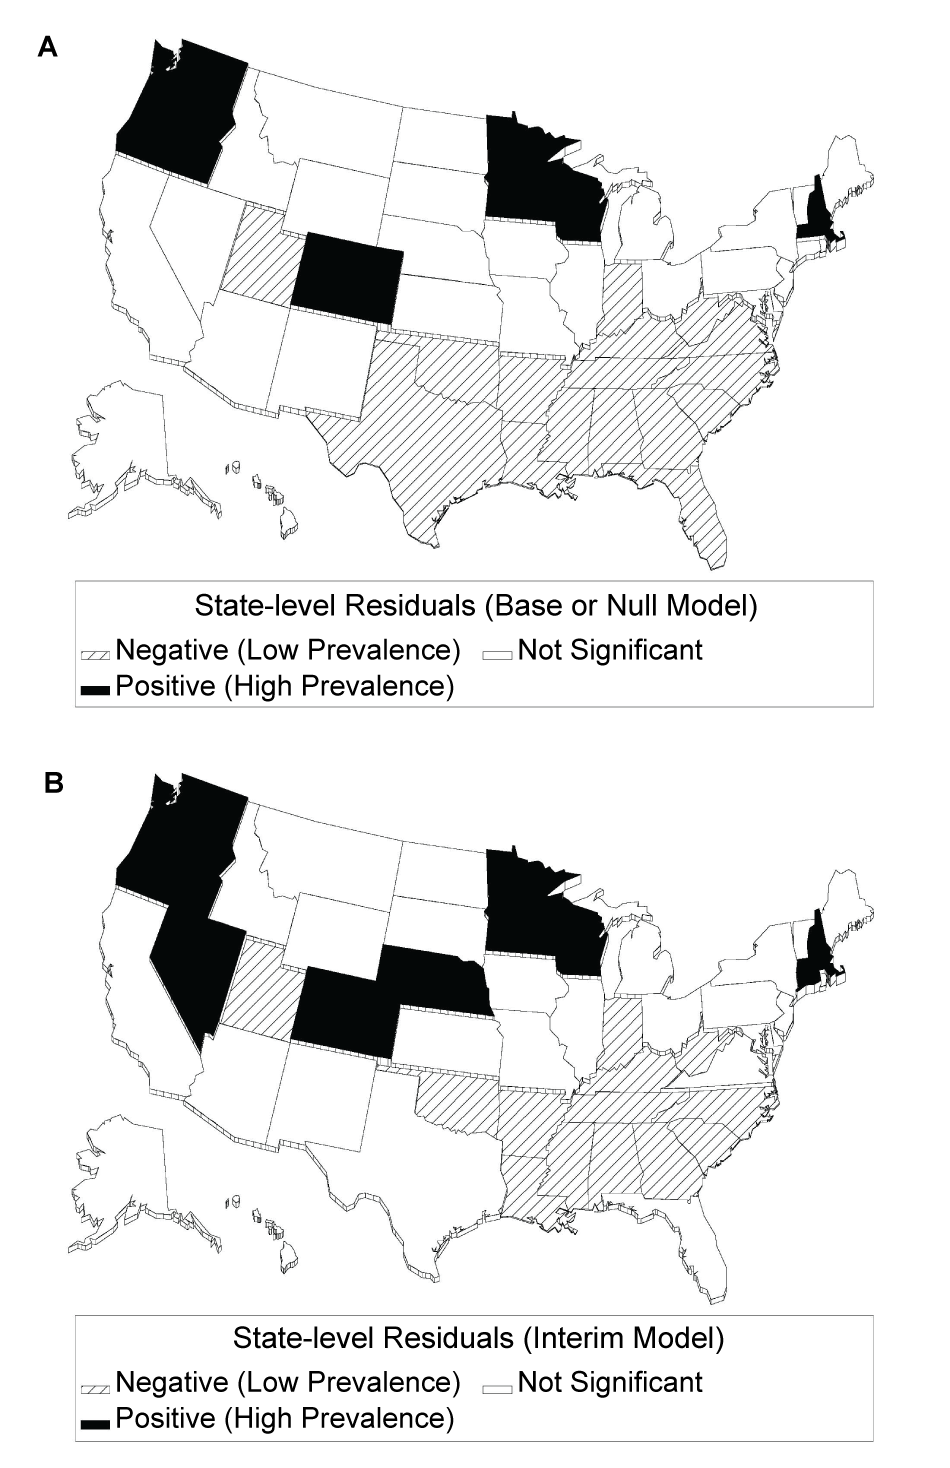
Figure 2a shows the residual analysis of alcohol use illustrated on the map for the base (null) model with no information about individual-level characteristics, showing 16 negative (low prevalence) and 7 positive (high prevalence) residuals. The base model appears to highlight geographical distribution of current regular alcohol use. States with high negative residuals, indicating low prevalence, were generally found in the South. States with high positive residuals, indicating high levels of alcohol use, were located in the Midwest (Minnesota, Wisconsin), West (Washington, Oregon, and Colorado), and Northeast (Massachusetts, New Hampshire).
.
Figure 2: US Map of the Estimated State Effects on Alcohol Use Based on Approximate Simultaneous 95% Confidence Interval (Residual Analysis). (a) Null (base) model; (b) Interim model: (Model with individual characteristics).
View Figure 2
Figure 2b shows that the residuals for the interim model (individual characteristics as fixed effects) had 13 negative and 10 positive residuals. In this model, 11 of 13 states with low alcohol use were located in the South. This suggests that lower regular use of alcohol was not accounted for solely by individuals but also by the nature of the state. We also observed a higher number of positive residuals in the interim than in the base model.
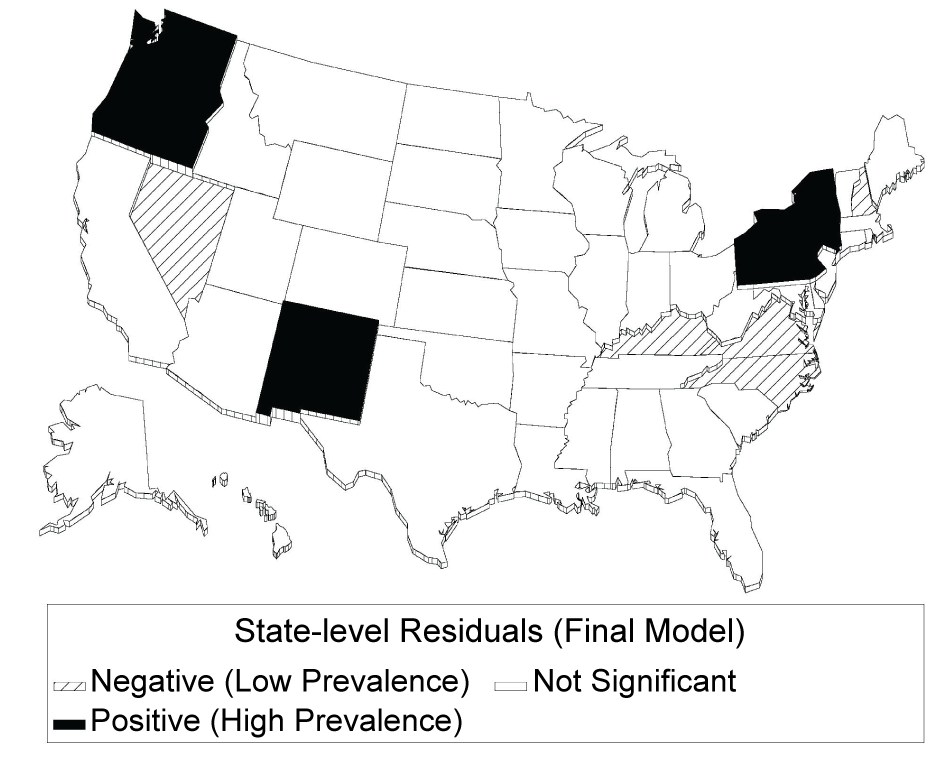
The extent to which alcohol use differences among states can be explained by individual and state characteristics is illustrated in Figure 3. Once state characteristics were included in the final model, the number of states with high alcohol use decreased from 10 to 5. In addition, the number of states with low regular alcohol use decreased from 13 to 5.
Discussion
This study investigated the contribution of individual and state-level characteristics in explaining alcohol use behavior, the geo-spatial distribution of regular alcohol use in the United States, and state-specific prevalence of regular alcohol use.
At the individual level, male, older age, and higher levels of education exhibited the strongest associations with prevalence of regular alcohol use. Non-white groups such as Blacks, Asians and Hispanics had lower rates than non-Hispanic whites. Inclusion of state-level variables did not change the individual parameters. However, residing in states with higher percentages of their populations below poverty level was associated with lower regular use of alcohol. Using data from four California cities, one study [4] found that living in the most deprived neighborhoods was not related to heavy drinking. Conversely, living in states characterized by high per capita alcohol sales was associated with higher use of alcohol. Associations of state alcohol policies with individuals' alcohol use behavior was also observed. Respondents living in states where Sunday alcohol sales are banned were less likely than those living where Sunday alcohol sales are permitted to drink regularly. Findings from both cross-sectional and quasi-experimental studies from twelve US states and two Canadian provinces [29] suggest that allowing Sunday alcohol sales predictably and significantly increases Sunday alcohol consumption from ten percent to 25 percent.
The observed MORs suggested that two respondents with similar individual characteristics from different states might differ by 47% in propensity to drink regularly only because of different states of residence. Introduction of state characteristics did not change estimates of the associations between individual characteristics and alcohol use behavior. However, state-level characteristics explained a considerable part of state variance and were associated with individuals' propensities to drink. This implies that individual characteristics as well as state conditions were independently associated with alcohol use behavior.
Regarding the geo-spatial distribution of alcohol use behavior, the multilevel model allowed us to identify significant variations between states in the prevalence of regular drinking. One may conclude that alcohol use behavior exhibits important ecological dimensions in the United States. Referring to the graphical representation of the residual analysis of state effects, we found relatively high prevalence in the West, Midwest and Northeast regions, and relatively low prevalence concentrated mostly in the South.
Conclusion and Policy Implication
To our knowledge, the present study is the first to demonstrate the joint contributions of state socioeconomic environment and alcohol policy and individual-level socioeconomic conditions on alcohol use behavior in the United States.
With the use of multilevel modeling, we were able to analyze alcohol use behavior within a framework that explicitly recognizes a population hierarchy in which individuals reside within particular areas. This study's findings add to the evidence that alcohol use behavior varies not only by individual characteristics but also by characteristics of the state in which the individual resides. Our results suggest that state policies targeting the reduction of alcohol use affect individual alcohol use behavior, over and above individual characteristics.
Limitations of the study include the fact that geo-spatial data were only available at the state level. States reflect administrative boundaries, which may not adequately capture the finer-grained variations in social context important for individual behaviors. When region sizes are large (e.g., most U.S. states), variation within a state may be limited. When between-state variation is small, detecting state effects is difficult. Besides, we can't rule out some unmeasured confounding factor that is correlated both with state level condition and individual alcohol use.
Despite these limitations, this study's strengths make it an important contribution to the literature on contextual determinants of alcohol use behavior. It is a large, population-based study with national coverage and high response rates. Advantages in examining alcohol use behavior in the US using a multilevel approach include the ability of state-level analyses to identify the context in which individuals live and may experience health outcomes, including those related to alcohol. Individual alcohol use behavior is influenced by state policies such as those governing availability of alcohol, temporal restrictions on sales of alcohol, and insurance coverage of treatment for alcohol-related victims.
Disclosure Statement
Role of funding sources
The National Institute on Alcohol Abuse and Alcoholism (NIAAA) funded the National Epidemiologic Survey on Alcohol and Related Conditions (NESARC) with supplemental funding from the National Institute on Drug Abuse (NIDA).
References
-
Diez Roux AV (2001) Investigating neighborhood and area effects on health. Am J Public Health 91: 1783-1789.
-
Diez-Roux AV, Merken SS, Hannan P, Jacob DR, Kiefe CI (2003) Area characteristics, individual-level socioeconomic indicators, and smoking in young adults: the coronary artery risk development in young adults study. Am J Epidemiol 157: 315-326.
-
Kim D, Subramanian SV, Gortmaker SL, Kaachi I (2006) US state- and county-level social capital in relation to obesity and physical inactivity: A multilevel, multivariate analysis. Social Science and Medicine. 63: 1045-1059.
-
Pollack CE, Cubbin C, Ahn D, Winkleby M (2005) Neighbourhood deprivation and alcohol consumption: does the availability of alcohol play a role? Int J Epidemiol 34: 772-780.
-
Pickett KE, Pearl M (2001) Multilevel analyses of neighbourhood socioeconomic context and health outcomes: a critical review. J Epidemiol Community Health 55: 111-122.
-
Dee TS (2001) Alcohol abuse and economic conditions: evidence from repeated cross-sections of individual-level data. Health Econ 10: 257-270.
-
National Institute on Alcohol Abuse and Alcoholism (NIAAA) (2000) 10th Special report to the U.S. Congress on alcohol and health, Bethesda, NIH. REP023.
-
Room R, Mäkelä K (2000) Typologies of the cultural position of drinking. J Stud Alcohol 61: 475-483.
-
Scribner RA, Cohen DA, Fisher W (2000) Evidence of a structural effect for alcohol outlet density: a multilevel analysis. Alcohol Clin Exp Res 24: 188-195.
-
European Union (EU) (2006) Health In All Policies: High-level Expert Conference under Finland’s EU Presidency, Kuopio.
-
Grossman M, Chaloupka FJ, Saffer H, Laixuthai, A (1994) Effects of alcohol price policy on youth: a summary of economic research. Journal of Research on Adolescence. 4: 347-364.
-
Coate D, Grossman M (1998) Effects of alcoholic beverage prices and legal drinking ages on youth alcohol use. Journal of Law and Economics 31: 145-171.
-
Cook PJ, Moore MJ(1993) Taxation of alcoholic beverages. In: Hilton, M., Bloss, G, Economics and the Prevention of Alcohol-related Problems, NIAAA Research Monograph No 25, US Department of Health and Human Services, Washington DC.
-
Henderson C, Liu X, Diez Roux AV, Link BG, Hasin D (2004) The effects of US state income inequality and alcohol policies on symptoms of depression and alcohol dependence. Soc Sci Med 58: 565-575.
-
Stephenson R, Baschieri A, Clements S, Hennink M, Madise N (2006) Contextual influences on the use of health facilities for childbirth in Africa. Am J Public Health 96: 84-93.
-
Duncan C, Jones K, Moon G (1993) Do places matter? A multi-level analysis of regional variations in health-related behaviour in Britain. Soc Sci Med 37: 725-733.
-
Linsky AS, Colby JP Jr, Straus MA (1987) Social stress, normative constraints and alcohol problems in American states. Soc Sci Med 24: 875-883.
-
Grant BF, Moore TC, Shapard J, Kaplan K (2003) Source and Accuracy Statement, Wave 1 National Epidemiologic Survey on Alcohol and Related Conditions (NESARC). National Institute on Alcohol Abuse and Alcoholism: Bethesda.
-
Grant BF, Stinson FS, Dawson DA, Chou SP, Dufour MC, et al. (2004) Prevalence and co-occurrence of substance use disorders and independent mood and anxiety disorders: results from the National Epidemiologic Survey on Alcohol and Related Conditions. Arch Gen Psychiatry 61: 807-816.
-
Schootman M, Jeffe DB, Baker EA, Walker MS (2006) Effect of area poverty rate on cancer screening across US communities. J Epidemiol Community Health 60: 202-207.
-
Subramania SV, Kawachi I, Kennedy BP (2001) Does the state you live in make a difference? Multilevel analysis of self-rated health in the US. Soc Sci Med 53: 9-19.
-
U.S. Census Bureau. Current Population Survey, Washington, DC 20233-8700. 2002.
-
Goldstein H (1999) Multilevel statistical models, New York: Wiley.
-
Snijders TA B, Bosker RJ (1999) Multilevel analysis-An introduction to basic and advanced multilevel modeling, Thousand Oaks, CA: Sage.
-
Merlo J, Lynch JW, Yang M, Lindström M, Östergren PO, et al. (2003) Effect of neighborhood social participation on individual use of hormone replacement therapy and antihypertensive medication: A multilevel analysis. Am J Epidemiol 157: 774-783.
-
Larsen K, Merlo J (2005) Appropriate assessment of neighborhood effects on individual health-integrating random and fixed effects in multilevel logistic regression. Am J Epidemiol 161: 81-88.
-
Rasbash J, Browne W, Goldstein H, Yang M, Plewis I, et al. (2000) A user’s guide to MLwiN. London: University of London, Institute of Education.
-
Hox JJ (2002) Multilevel Analysis. Techniques and Applications. Mahwah, NJ: Lawrence Erlbaum Associates.
-
Carpenter CS, Eisenberg D (2009) Effects of Sunday sales restrictions on overall and day-specific alcohol consumption: evidence from Canada. J Stud Alcohol Drugs 70: 126-133.
